R E S E A R C H A R T I C L E
Open Access
Predicting oral malodour based on the
microbiota in saliva samples using a deep
learning approach
Yoshio Nakano
1*, Nao Suzuki
2and Fumiyuki Kuwata
1Abstract
Background: Oral malodour is mainly caused by volatile sulphur compounds produced by bacteria and bacterial interactions. It is difficult to predict the presence or absence of oral malodour based on the abundances of specific species and their combinations. This paper presents an effective way of deep learning approach to predicting the oral malodour from salivary microbiota.
Methods: The 16S rRNA genes from saliva samples of 90 subjects (45 had no or weak oral malodour, and 45 had marked oral malodour) were amplified, and gene sequence analysis was carried out. Deep learning classified oral malodour and healthy breath based on the resultant abundances of operational taxonomic units (OTUs)
Results: A discrimination classifier model was constructed by profiling OTUs and calculating their relative abundance in saliva samples from 90 subjects. Our deep learning model achieved a predictive accuracy of 97%, compared to the 79% obtained with a support vector machine.
Conclusion: This approach is expected to be useful in screening the saliva for prediction of oral malodour before visits to specialist clinics.
Keywords: Oral malodour, Deep learning, Oral micorobiota
Background
Oral malodourous compounds are reportedly produced by periodontitis-associated bacteria in the oral cavity, such as those belonging to the genera Porphyromonas and Prevotella, which produce volatile sulphur com-pounds (VSCs) [1–4].Fusobacterium nucleatumand Tre-ponema denticola also produce VSCs, but additionally produce butyric acid and other volatile organic com-pounds that cause oral malodour [3, 5–7]. Neverthe-less, because there are over 700 known bacterial species in the human oral cavity [8, 9], and because several species produce VSCs to varying degrees, the presence of VSCs in the breath cannot be predicted by the presence of specific species. Concentrations of oral malodourous compounds produced by oral bacteria vary according to the type and abundance of species. Interactions
*Correspondence:[email protected]
1Department of Chemistry, Nihon University School of Dentistry,
Kanda-Surugadai, Chiyoda-ku, 101-8310 Tokyo, Japan Full list of author information is available at the end of the article
between bacterial species may play important roles in the production of VSCs.
Analysis of the oral microbiota reveals several sig-nals from various bacterial species present in various numbers, but we cannot directly or indirectly distin-guish bacterial species producing oral malodourous com-pounds from non-producing bacteria; the bacterial cells form complicated networks in the oral cavity. Machine learning is suitable for prediction from such complicated data, and we previously reported some success in pre-dicting oral malodour using support vector machines (SVMs) [10].
Machine learning algorithms use training data to uncover underlying patterns, build models, and make predictions based on the best fit models. Indeed, some well-known algorithms, such as SVMs, random forests, Bayesian networks, and Gaussian networks, have been applied in genomics, proteomics, systems biology, and numerous other domains [11]. We previously reported
prediction of oral malodour from oral microbiota in saliva by using an SVM based on peak areas of terminal restric-tion fragment length polymorphisms (T-RFLPs) of the 16S rRNA gene as data for supervised machine-learning meth-ods [10]. Using this training data, the SVM achieved a high classification accuracy of 82%, with a sensitivity of 51% and specificity of 95%. Currently, T-RFLP does not provide economic advantages over 16S RNA sequence analysis. In this study, we devised a more precise clas-sification system using a deep-learning approach based on 16S rRNA sequences with a higher resolution than that of T-RFLP analysis, and compared it with SVM-based prediction.
Methods
Study population
The study population consisted of 90 patients (37 men and 53 women, mean age of 50.0 ±14.7 years) who had visited the Oral Malodour Clinic of Fukuoka Dental College Medical and Dental Hospital between August 2011 and October 2016 with a complaint of halitosis. They had not consumed antibiotics within 3 months and had no otorhinolaryngological illness or metabolic disease. Of the 90 patients, 45 had no or weak oral malodour and 45 had marked oral malodour. All participating subjects understood the nature of the research project and provided written, informed con-sent. Permission for this study was obtained from the Ethics Committee for Clinical Research of Fukuoka Den-tal College and Fukuoka College of Health Sciences (approval numbers 89, 233, and 249). All study meth-ods were carried out in accordance with the approved guidelines.
Malodour assessment
The severity of oral malodorour was determined in each patient using an organoleptic test (OLT) and gas chro-matography. Malodour assessment and clinical exam-ination, including tests of salivary flow and mucosal moisture level, were performed at least 5 h after eat-ing, drinkeat-ing, cheweat-ing, smokeat-ing, and brushing or rins-ing the mouth. The OLT scores were estimated by two of three evaluators using a scale of 0 to 5 [12], and the mean of the scores given by the evaluators was used. The presence of OLT scores ≥2 among the three evaluators always exceeded 75% ( = 0.50). Gas chro-matography (model GC2014; Shimazu Works, Kyoto, Japan) was used to measure the concentrations of hydro-gen sulphide (H2S), methyl mercaptan (CH3SH), and dimethyl sulphide (CH3SCH3) in the breath. The value for total VSCs was defined as the sum of the H2S, CH3SH, and CH3SCH3 concentrations. The threshold for marked oral malodour was defined as an OLT score of ≥3 and total VSC concentration of ≥0.3 ppm. The
threshold for no or weak oral malodour was defined as an OLT score of <3 and total VSC concentration of<0.3 ppm.
Sample collection and pyrosequencing analysis
Saliva samples were collected from subjects using chewing gum. Subjects were asked to spit into a vessel through-out the a 5 min collection period. Samples (0.5 ml) were collected and were transferred to sterile plastic tubes. Bac-teria were harvested by centrifugation (20,400 × g, 15 min at 4°C), and the resulting pellets were resuspended in 150 μl of buffer containing 50 mM Tris-HCl, 1 mM EDTA, and 1% sodium dodecyl sulfate (SDS; pH 7.6). The suspension was added to plastic tubes containing 0.3 g zirconia-silica beads (bead size, 0.1 mm; Biospec Prod-ucts, Bartlesville, OK, USA) and one tungsten-carbide bead (bead size, 3 mm; Qiagen, Hilden, Germany). The samples were heated at 90°C for 10 min and then vig-orously agitated for 3 min in a cell disruptor (Dis-ruptor Genie, Scientific Industries, Inc., Bohemia, NY, USA). After centrifugation at 6000 × g for a few sec-onds, 200 μl of 1% SDS was added, and the samples were incubated at 70°C for 10 min. The mixtures were extracted using 400 μl of phenol–chloroform–isoamyl alcohol (25:24:1), and the nucleic acids were precipi-tated with 100% ethanol. Following centrifugation, the DNA was washed with 70% ethanol, resuspended in 100 μl of TE buffer (10 mM Tris-HCl, 1 mM EDTA, pH 7.6), and frozen until subsequent analysis. After extrac-tion, samples were PCR-amplified under permissive con-ditions using primers to amplify the 508-807 region in prokaryotic 16S rDNA containing the MiSeq sequenc-ing adapters and an 8-nucleotide barcode on the for-ward primer, followed by the bases matching the 16S rRNA gene. The analysis was performed using the for-ward primer AA TGA TAC GGC GAC CAC CGA GAT CTA CAC XXXXXXXX TCG TCG GCA GCG TCA GAT GTG TAT AAG AGA CAG and the reverse primer GTT CGT CTT CTG CCG TAT GCT CTA CAA GCA GAA GAC GGC ATA CGA GAT XXXXXXXX CAG AGC ACC CGA GCC TCT ACA CAT ATT CTC TGT C. Pyrosequencing was conducted at Hokkaido Sys-tem Science Co., Ltd. (Sapporo, Japan) on an Illumina MiSeq sequencer (Illumina, San Diego, CA, USA) using a paired-end 300 bp sequence read run with the Miseq Reagent Kit v3 and MiSeq Control Software version 2.6.2.1 (Illumina).
Data analysis and taxonomy assignment
Each representative sequence was compared using the BLAST algorithm with 998 sequences of the oral bacterial 16S rRNA gene (Human Oral Microbiome Database [HOMD] 16S rRNA RefSeq Version 15.1) deposited in HOMD and assigned to the best BLAST hit with a 97% identity. A total of 3000 sequences were randomly extracted from each sample and used for the follow-ing analyses (Additional files 1 and 2). LDA effect size (LEfSe) [15] analysis was used to detect significant dif-ferences between the relative abundances of OTUs in samples from patients with healthy and malodourous breath.
Machine learning
Learning and classification of the bacterial compo-sition of each sample were accomplished using R (http://www.r-project.org) with the h2o package for deep learning and the activation type RectifierWith-Dropout, and the e1071 package for the SVM with the radial basis function (RBF). The radial kernel func-tion transformed the data using the non-linear funcfunc-tion k(x1,x2) = exp(−γ|x1−x2|2), whereγ determines the RBF width, unless otherwise specified. Classification by machine learning was evaluated by leave-one-out cross-validation, i.e., one sample was classified by supervised machine learning using the other 89 samples for train-ing. The commands used in this study are showed in Additional file3.
Results
Evaluation of microbiome compositions based on 16S rRNA sequences
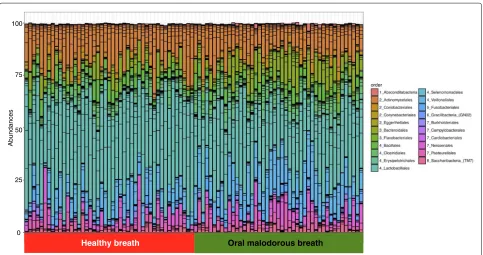
Nucleotide sequences of 16S rRNAs were determined and their taxa were estimated by BLAST analysis using HOMD. A total of 3000 sequences from each sample were analysed and the results showed a typical bacterial com-position profile (Fig.1) when compared to the 16S rRNA sequences of known oral microbes. OTUs with ≤0.1% frequency, found in≤4 samples, were omitted from the following calculation. In total, 108 distinct OTUs were noted, and the minimum, maximum, and mean numbers of OTUs per sample were 20, 66, and 38.9, respectively (Additional file1).
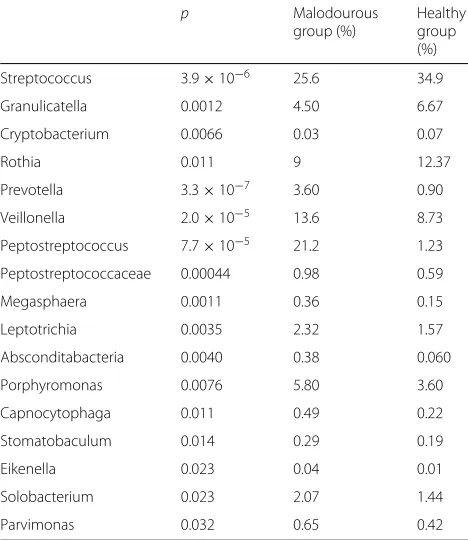
Some OTUs belonged to the same genus, so we re-examined the composition of the genera (Additional file2). Thirty-seven were present in the samples. Genera characteristic of healthy and malodourous mouth breath were analysed using the Mann-Whitney U test. Table1
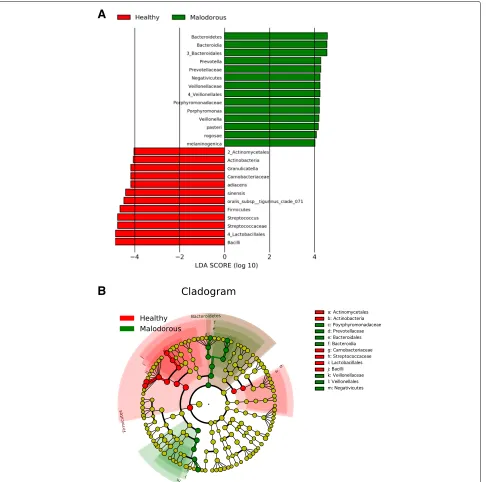
shows the significance of bacteria between two groups. Linear discriminant analysis (LDA) was performed using LEfSe [15] to detect OTUs with significantly differ-ent relative abundances in oral malodourous and healthy breath. A total of 108 OTUs were found to be signifi-cantly differences between bacteria in the groups (Fig.2). OTUs identified as most strongly associated with oral malodour were from theBacteroides,Prevotella, and Por-phyromonasgenera.
s
e
c
n
a
d
n
u
b
A
100
0 75
50
25
Healthy breath Oral malodorous breath
Table 1Malodourous and healthy breath-specific genera compared with non-parametric Mann Whitney U test (p<0.05)
p Malodourous
group (%)
Healthy group (%)
Streptococcus 3.9×10⁻⁶ 25.6 34.9
Granulicatella 0.0012 4.50 6.67
Cryptobacterium 0.0066 0.03 0.07
Rothia 0.011 9 12.37
Prevotella 3.3×10⁻⁷ 3.60 0.90
Veillonella 2.0×10⁻⁵ 13.6 8.73
Peptostreptococcus 7.7×10⁻⁵ 21.2 1.23
Peptostreptococcaceae 0.00044 0.98 0.59
Megasphaera 0.0011 0.36 0.15
Leptotrichia 0.0035 2.32 1.57
Absconditabacteria 0.0040 0.38 0.060
Porphyromonas 0.0076 5.80 3.60
Capnocytophaga 0.011 0.49 0.22
Stomatobaculum 0.014 0.29 0.19
Eikenella 0.023 0.04 0.01
Solobacterium 0.023 2.07 1.44
Parvimonas 0.032 0.65 0.42
Classification of the presence of oral malodour by SVM and deep learning
To evaluate the classification performance of SVM and deep learning for oral malodour, proportions of OTUs associated with oral malodour in 16S rRNA analysis were used for classification by the support vector machine and deep learning (Table2). Deep learning discriminated oral malodour from normal breath with 96.7% accuracy as compared to SVM, which discriminated between them with 78.9% accuracy.
Discussion
We previously reported that SVM discriminated oral mal-odour from normal breath based on T-RFLP analysis with 81% accuracy [10]. T-RFs are generated by digestion with restriction enzyme(s); therefore, the resolution for dis-crimination of bacterial species is limited by the size of recognition sites within the target fragments and lacks quantitative ability. The costs for 16S rRNA sequence analyses have been reduced by pyrosequencing and other next-generation sequencing techniques. We expected that the higher resolution would improve the recognition rate by SVM and other machine learning systems. Contrary to our expectations, the SVM classifier discriminated between the presence and absence of oral malodour using the amplified 16S rRNA sequences from the saliva sam-ples with an accuracy of 78.9%, similar to that of T-LFs (Table2).
The bacterial composition in the saliva samples showed a typical oral microbiota profile (Fig. 1), and statisti-cal analysis showed some genera specific to healthy and malodourous breath (Table 1). Of the genera present at over 5% abundance,Streptococcus,Granulicatellaand Rothiawere more abundant in the healthy group, whereas Veillonella,Peptostreptococcus, andPorphyromonaswere more abundant in the malodourous group. These genera contain oral malodour-associated species, and Porphy-romonas spp, in particular, as periodontal bacteria, are strongly suggested to be an oral malodour-producing bac-teria [4,16,17]. In addition, LEfSe analysis revealed many bacterial species, genera, and families with significantly different relative abundances in oral malodourousand healthy breath. A total of 74 OTUs or OTU groups were noted to be significantly differentially abundant in these groups, with an LDA threshold of 4.0 (Fig. 2). The Bac-teroidales order, which includes the generaPrevotellaand Porphyromonas, was strongly associated with oral mal-odour. The results of LEfSe analysis include a cladogram showing the significant differences at different hierarchi-cal levels (Fig.2b). In this study, the relative abundance ofFusobacteriumwas an averaged 0.12%, andTreponema was detected in almost no samples. Thus, VSC concen-trations cannot be predicted based on the abundances of some known VSC-producing bacteria, and machine learning techniques are useful.
A large proportion of oral microbiota, particularly in the saliva, does not produce oral malodourous com-pounds, but may indicate the presence of organisms specific to oral malodour owing to the interactions among bacterial species. Thus, machine learning can be expected to classify oral microorganisms as oral mal-odourous or non-malmal-odourous, although our first trial with SVM did not show high classification accuracy (Table 2). We next focused on deep learning, which has advanced significantly in solving problems that have resisted the best attempts of the artificial intelligence community for several years [18]. Application of deep learning in bioinformatics has become a focal point of research [19].
A
B
Fig. 2LEfSe analysis.aHistogram of the LDA scores computed for features differentially abundant in healthy (red) and oral malodourous (green) breath.bCladogram showing different abundance values (according to LEfSe) of taxa
Table 2Recognition rates of oral malodour by SVM and deep learning
Sensitivity (%) Specificity (%) Accuracy (%)
SVM 77.8 80.0 78.9
Deep learning 100 93.3 96.7
impractical, whereas preparation of a saliva sample is sim-ple, as DNA from oral bacterial cells in the saliva can be dried and transported at room temperature by using FTA cards (GE Healthcare, Little Chalfont, UK).
Conclusions
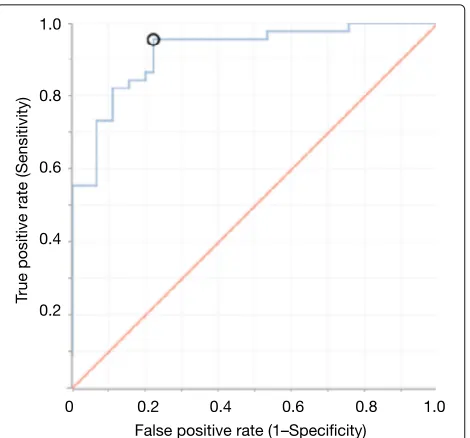
Fig. 3ROC curve for classification of malodourous and healthy breath using 30-fold validation with activation of Tanh
sequences from microbiota in saliva samples. Classi-fication using saliva samples is suitable for screening of oral malodour risk. In addition, treatment for oral malodour can be monitored using this classification system.
Additional files
Additional file 1: Dataset of numbers of OTUs in samples. A total of 3000 sequences were randomly extracted from each sequence data of a sample. The second column, “Malodour”, shows malodourous (P, positive) or normal (N, negative) breath. (CSV 24 kb)
Additional file 2: Dataset of numbers of genera in samples. OTUs in Additional file1were combined into genera and counted again. (CSV 10 kb) Additional file 3: The commands of h2o and e1071 in R. (TXT 1 kb)
Abbreviations
LDA: Linear discriminant analysis; LEfSe: LDA effect size; OLT: Organoleptic test; OTU: Operational taxonomic units; RBF: Radial basis function; ROC: Receiver operating characteristic; SVM: Support vector machine; T-RFLP: Terminal restriction fragment length polymorphisms; VSC: Volatile sulphur compound
Funding
This study was supported in part by Grants-in-Aid for Scientific Research 15K14423 (F. K), 16K07205 (Y. N.), 26463175 (N. S.); and by Sato Fund (2015–2016) from Nihon University School of Dentistry. The funding agencies had no role in the design of the study and collection, analysis, and interpretation of data or in the writing of the manuscript.
Availability of data and materials
The dataset used is attached as Additional file1.
Authors’ contributions
YY and NS designed the experiments. NS collected the samples and prepared purified DNA for sequence analysis. YN and FK performed data analysis. All authors reviewed the manuscript. All authors read and approved the final manuscript.
Ethics approval and consent to participate
All participating subjects understood the nature of the research project and provided written, informed consent. Permission for this study was obtained from the Ethics Committee for Clinical Research of Fukuoka Dental College and Fukuoka College of Health Sciences (approval numbers 89, 233, and 249). All the study methods were carried out in accordance with the approved guidelines.
Consent for publication
Not applicable.
Competing interests
The authors declare that they have no competing interests.
Publisher’s Note
Springer Nature remains neutral with regard to jurisdictional claims in published maps and institutional affiliations.
Author details
1Department of Chemistry, Nihon University School of Dentistry,
Kanda-Surugadai, Chiyoda-ku, 101-8310 Tokyo, Japan.2Department of Preventive and Public Health Dentistry, Fukuoka Dental College, Tamura, Sawara-ku, 814-0193 Fukuoka, Japan.
Received: 19 September 2017 Accepted: 16 July 2018
References
1. Kleinberg I, Westbay G. Oral malodor,. Crit Rev Oral Biol Med. 1990;1(4): 247–59.
2. Scully C, Porter S, Greenman J. What to do about halitosis. BMJ. 1994;308(6923):217–8.
3. Hughes FJ, McNab R. Oral malodour–a review. Arch Oral Biol. 2008;53 Suppl 1:1–7.
4. Suzuki N, Yoneda M, Hirofuji T. Relationship Between Oral Malodor and Oral Microbiota. In: Oral Heal. Care - Prosthodont. Periodontol. Biol. Res. Syst. Cond. London: InTech. p. 123–30. Chap. 9.
5. Nakano Y, Yoshimura M, Koga T. Methyl mercaptan production by periodontal bacteria. Int Dent J. 2002;52 Suppl 3:217–20.
6. Tanaka M, Yamamoto Y, Kuboniwa M, Nonaka A, Nishida N, Maeda K, Kataoka K, Nagata H, Shizukuishi S. Contribution of periodontal pathogens on tongue dorsa analyzed with real-time PCR to oral malodor. Microbes Infect. 2004;6(12):1078–83.
7. Moore WE, Moore LV. The bacteria of periodontal diseases. Periodontol 2000. 1994;5:66–77.
8. Aas JA, Paster BJ, Stokes LN, Olsen I, Dewhirst FE. Defining the Normal Bacterial Flora of the Oral Cavity. J Clin Microbiol. 2005;43(11):5721–32. 9. Dewhirst FE, Chen T, Izard J, Paster BJ, Tanner ACR, Yu W-H,
Lakshmanan A, Wade WG. The Human Oral Microbiome. J Bacteriol. 2010;192(19):5002–17.
10. Nakano Y, Takeshita T, Kamio N, Shiota S, Shibata Y, Suzuki N, Yoneda M, Hirofuji T, Yamashita Y. Supervised machine learning-based classification of oral malodor based on the microbiota in saliva samples. Artif Intell Med. 2014;60(2):97–101.
11. Larrañaga P, Calvo B, Santana R, Bielza C, Galdiano J, Inza I, Lozano JA, Armañanzas R, Santafé G, Pérez A, Robles V. Machine learning in bioinformatics. Brief Bioinform. 2006;7(1):86–112.
12. Yaegaki K, Coil JM. Examination, classification, and treatment of halitosis; clinical perspectives. J Can Dent Assoc. 2000;66(5):257–61.
13. Edgar RC, Haas BJ, Clemente JC, Quince C, Knight R. UCHIME improves sensitivity and speed of chimera detection. Bioinformatics. 2011;27(16): 2194–200.
14. Li W, Godzik A. Cd-hit: a fast program for clustering and comparing large sets of protein or nucleotide sequences. Bioinformatics. 2006;22(13): 1658–9.
15. Segata N, et al. Metagenomic biomarker discovery and explanation. Genome Biol. 2011;12(6):60.
17. Nakano Y, Yoshimura M, Koga T. Correlation between oral malodor and periodontal bacteria. Microbes Infect. 2002;4(6):679–83.
18. LeCun Y, Bengio Y, Hinton G. Deep learning. Nature. 2015;521(7553): 436–44.