SOFTWARE ARTICLE
An efficient algorithm for protein
structure comparison using elastic shape
analysis
S. Srivastava
1,2, S. B. Lal
1, D. C. Mishra
1, U. B. Angadi
1, K. K. Chaturvedi
1, S. N. Rai
2,3and A. Rai
1,4*Abstract
Background: Protein structure comparison play important role in in silico functional prediction of a new protein. It is also used for understanding the evolutionary relationships among proteins. A variety of methods have been proposed in literature for comparing protein structures but they have their own limitations in terms of accuracy and complexity with respect to computational time and space. There is a need to improve the computational complexity in comparison/alignment of proteins through incorporation of important biological and structural properties in the existing techniques.
Results: An efficient algorithm has been developed for comparing protein structures using elastic shape analysis in which the sequence of 3D coordinates atoms of protein structures supplemented by additional auxiliary information from side-chain properties are incorporated. The protein structure is represented by a special function called square-root velocity function. Furthermore, singular value decomposition and dynamic programming have been employed for optimal rotation and optimal matching of the proteins, respectively. Also, geodesic distance has been calculated and used as the dissimilarity score between two protein structures. The performance of the developed algorithm is tested and found to be more efficient, i.e., running time reduced by 80–90 % without compromising accuracy of com-parison when compared with the existing methods. Source codes for different functions have been developed in R. Also, user friendly web-based application called ProtSComp has been developed using above algorithm for compar-ing protein 3D structures and is accessible free.
Conclusions: The methodology and algorithm developed in this study is taking considerably less computational time without loss of accuracy (Table 2). The proposed algorithm is considering different criteria of representing protein structures using 3D coordinates of atoms and inclusion of residue wise molecular properties as auxiliary information.
Keywords: Protein structure comparison, Backbone atoms, Geodesic distance, Side chain properties
© 2016 The Author(s). This article is distributed under the terms of the Creative Commons Attribution 4.0 International License (http://creativecommons.org/licenses/by/4.0/), which permits unrestricted use, distribution, and reproduction in any medium, provided you give appropriate credit to the original author(s) and the source, provide a link to the Creative Commons license, and indicate if changes were made. The Creative Commons Public Domain Dedication waiver (http://creativecommons.org/ publicdomain/zero/1.0/) applies to the data made available in this article, unless otherwise stated.
Background
Comparison of protein structures is an important for understanding structural, functional and evolutionary relationship among protein specially in case of novel pro-teins [1]. In addition to this, it is being extensively used for identifying homologous residues [2, 3], finding recur-rent folds [4], identifying structural motifs and functional
sites, searching similar structure in structural database, predicting interaction among residues/proteins, and hier-archical classification of proteins [5–10]. Structural anal-ysis of proteins is much more important than sequence analysis as protein structures are more conserved than sequences [1, 11]. The comparison of protein can also be used for evaluation of sequence alignment methods [12, 13], prediction of unknown protein structures and evalu-ation of predicted 3D structure of a protein.
In the last two decades, research in the area of protein structure comparison has gained momentum but the
Open Access
*Correspondence: [email protected]
4 Centre for Agricultural Bioinformatics, ICAR-Indian Agricultural Statistics Research Institute, Library Avenue, New Delhi 110012, India
problem of finding optimal alignment having significant role in biological context still continues [1]. Number of methods for comparing two protein structures has been proposed in the literature. These methods are either based on various distance measures or scoring schemes. There is strong need to develop standard scoring func-tion [14, 15] based on strong theoretical foundation as majority of existing techniques are heuristic in nature [1]. These existing techniques are not only less accurate but have more computational time and space complex-ity [16]. Hence, there is a scope for improvement in the existing methods for better comparison of protein struc-tures [1, 15, 17].
Algorithms of two protein 3D structures comparison approaches can be broadly classified into two catego-ries, i.e., (1) is based on rigid body alignment by super positioning protein structures heuristically with scal-ing, rotation, transformation and then super-positioning [18] and (2) based on fragmentation of structures and assembling by non-sequential alignment [18, 19]. The techniques of first category can perform better when the protein structures are small and each having equal num-ber of residues in their sequences. The basic limitations of second category are selection of appropriate fragments size, computational time and space complexity for align-ments. Various metrics for comparing and scoring iden-tity between two protein structures are employed in both category of approaches, but the most commonly used are p values and root mean square deviation (RMSD). These metrics are rarely used for protein structure comparison with respect to single technique. Further, method such as Distance mAtrix aLIgnment (DALI) employ similarity score which is not a metric but it uses heuristic rule to search the neighborhoods based on strong matches [20]. Comparing of these techniques with respect to imple-mentation and their practical utilities, these methods are difficult to use practically due to space and time complex-ity [21].
Recently, an attempt has been made for protein struc-ture comparison using geodesic distance as dissimilarity score based on a particular Riemannian metric [22]. In this technique 3D coordinates of backbone atoms have been used to derive parameterized curve in real numbers in three dimensional space i.e. R3, for representing the
protein structures. The alignment of two protein struc-tures is being defined as the alignment of the two curves derived from backbone atoms of two structures i.e., one from each protein. Each of these parameterized curve is represented by a special function called square root velocity function (SRVF). Further, shapes comparison has been done after removing all shape preserving transfor-mations from these curves. It has been pointed out that this comparison can be improved further by using higher
dimensional composite curves by concatenating the geo-metric (3D) coordinates with primary and secondary structures as auxiliary coordinates [23, 24] and side chain atoms. These side chain atoms play an important role in determination of protein structure and consequently pro-tein functions. The orientations of side chains and molec-ular properties of residues have significant effect on protein conformational dynamics and hence the protein function [25]. Therefore, the inclusion of the side chain atoms and molecular properties are likely to improve this protein structures comparative analysis and it may lead to a better alignment as compared to the alignment obtained from existing techniques.
Therefore, in this study an attempt has been made to develop a method/algorithm based on the elastic shape analysis [26–29] considering both geometrical and molecular properties of protein. In the proposed algo-rithm, side chain atoms along with molecular properties such as hydrophobicity, polarity, orientation (dihedral angles), mass of residues, functional group type (ali-phatic, acyclic, hydroxyl or sulphur-containing, aromatic) and number of side-chain atoms as auxiliary information have been included. The proposed technique requires significantly less time without compromising with the accuracy for comparing protein structures. The devel-oped algorithm has been implemented using open source R software. The method has been elaborated stepwise in the “Proposed algorithm” section. The performance of the developed method was compared with the existing methods i.e., ESA [22, 23], combinatorial extension (CE) [30] and jFATCAT [31], Matt [32], multiple structural alignment algorithm (MUSTANG) [33] for which the details are provided in the “Results and discussion” sec-tion. Our method was found to be more accurate for clas-sification purpose and efficient in terms of computational time.
Proposed algorithm
An algorithm for comparison of two protein 3D struc-tures based on elastic shape analysis [22, 34, 35] has been developed and implemented as web based tool for com-paring two protein structures. This tool requires PDB files [36] as input and provides geodesic distance along with graphical display of optimal matching and super-posed protein curves as an output for visualization.
a. Algorithm
In the proposed algorithm, both geometric properties from 3D coordinates of atoms and molecular proper-ties having significant role in protein folding were con-sidered to derive a curve from protein structure (PDB file). Geometric properties are derived in three criteria from 3D coordinates of atoms for each residue of a pro-tein, i.e., (1) by using the backbone (N, Cα and C) atoms
(ESA-BB), (2) using Cα atoms only (ESA-CA) and (3) the
mean coordinates of backbone atoms for each residue (ESA-MC-BB). Additionally, dihedral angles (phi, psi and omega) are included as compulsion in criteria (2) and (3). The molecular properties considered for development of this algorithm are hydrophobicity, polarity, mass of resi-dues functional group type (aliphatic, acyclic, hydroxyl or
sulphur-containing, aromatic) and number of side-chain atoms. These factors are used as auxiliary information [37–40]. In case of glycine, only the backbone atoms are being considered as an exception.
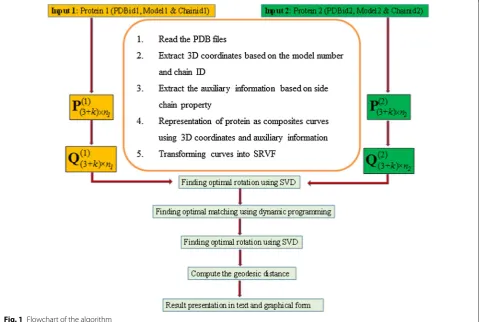
The steps involved in the proposed algorithm are given below and a flow chart represents the same as shown in Fig. 1.
Step 1
Extract 3D coordinates and auxiliary information to derive the initial input curve, P(j)(3 +k)×n
j as given below, for each protein j (PDB File j) of length nj:
Here, the superscript j, j = 1 and 2, refers to the protein 1 and protein 2, respectively. The subscript (3 + k) refers to the first 3 i.e. x, y, z coordinates of atoms and k coordi-nates are auxiliary information.
P((j3+) k)×n
j =
p1,1(j) p1,2(j) . . . p(1,j)n
j
p2,1(j) p2,2(j) . . . p(2,j)n
j
..
. ... . .. ...
p((j3+) k),1 p((3+j) k),2 . . . p((j3+) k),n
j
Step 2
Translate and scale by transforming the curves to their SRVFs, Q((j)3+k)n
j corresponding to their piecewise linear function Tj, respectively. This transformation for any given protein j (j = 1 or 2) is as follows:
Therefore, first and last terms for both T1 and T2 are 0 and
1, and all the intermediate values will lie between 0 and 1.
Step 3
Recalculate the SRVFs Q(11)andQ(11) corresponding to a new T (obtained by merging the unique values of param-eter values) for each of dimension (3 + k) × n. Calcula-tion is shown below:
These values are arranged in increasing order and then the unique values are merged. It may be noted that the value of n will lie between max(n1, n2) and n1 + n2 − 2. The recalculated SRVFs, Q((31+)k)×n and Q((32+)k)×n corre-sponding to new T can be conveniently represented by Q1 and Q2 for protein 1 and protein 2, respectively.
Step 4
Obtain optimal rotation using SVD by following points given below
4.1 SVD (A) = USVT, where A = Q 1Q2T 4.2 Optimal rotation matrix, R3×3 = USVT
4.3 The final optimal rotation matrix, RA with
(3 + k) × (3 + k) dimension:
t1(j)=0
ti(+1j) =t (j) i+1+
p(1,(j)i+1),p (j) 2,(i+1),p
(j) 3,(i+1)
−
p(1,ji),p
(j) 2,i,p
(j) 3,i for i=1, 2,. . . (nj−1)
Tj= 1 tn(jj)
t1(j)t2(j). . .tn(jj)
=
T1(j)T2(j). . .Tn(jj)
Q((j3)+k)Xn j =
dP((3j)+k)Xnj
dT(j)
dP((j3)+k)Xnj
dT(j)
T=unique
T1T2
=
0T2(1)T3(1)T4(1)Tn(11−)1. . .T2(2)T3(2)T4(2)Tn(2)
2−1
4.4 Rotate the second curve with respect to first curve, i.e., Q2R=Q2RA
Step 5
Achieve optimal matching by dynamic programming as follows
5.1 At first, compute the weights of all edges,
EW (r, s) = edge weight calculation between vertex for r = 1 to n vertices of Q1 and s = 1 to n vertices of Q2R
5.2 Find out the shortest path using Floyd–Warshall all-pairs shortest-path algorithm and matching of edge weights
5.3 Obtain G (gamma function values), Tg (gamma
change point parameter values) and the minimum
distance (squared L2 distance between matched
curves)
5.4 Obtained second curve (Q2R∗ ) after optimal re-parameterization.
Step 6
The same procedure as given in step 3 is used to calculate a new change point parameter Tr and the corresponding
SRVFs, Q1r and Q2r are recalculated. Finally, obtained
geodesic distance [θ = cos−1(d)] between the curves, where d=(Q1r.Q2r)TTr. The symbol ‘.’ represents the dot
product of the matrices.
b. Evaluation criteria
The proposed algorithm has been implemented in R soft-ware. In order to evaluate the performance of the pro-posed algorithm for protein 3D structure comparison with existing algorithms i.e., (1) CE, (2) jFATCAT and (3) ESA, the benchmark data was collected from the litera-ture [23]. Further, distance matrices based on all four 3D structure comparison algorithms mentioned above have been obtained for the benchmark data. The performance of the 3D structure protein comparison algorithms can be evaluated through cluster analysis using distance matrices. Different statistical performance measures such as rand index, precision, recall and F-measure were used for this evaluation.
R package development
www.backwin.cabgrid.res.in:8080/ProtSComp. In this web server, R package serves in back-end execution, Java Server Pages (JSP) as server side scripting language, and Cascading Style Sheets (CSS), HTML and Javascript as client side programming language.
Benchmark data
Two datasets of protein structures from structural clas-sification of proteins (SCOP) [6, 7] database have been taken as benchmark datasets. These datasets were also used by Liu et al. [23] for evaluation of algorithms for 3D structure comparison of proteins. First dataset comprises of 50 proteins from five important SCOP classes with 10 proteins from each class, i.e., class I [All α proteins], class II [All β proteins], class III [α and β proteins (α/β)], class IV [α and β proteins (α + β)] and class V
[Multi-domain proteins]. Second dataset consists of 100 proteins structures from three important classes, having 45 pro-teins from class I, 40 from class II and 15 from class III of SCOP database.
Computation of distance matrix
The distance matrix of size N×N for N protein
struc-tures were computed for all four algorithms i.e.,, (1) CE, (2) jFATCAT, (3) ESA and (4) proposed algorithm, The distance matrices for first three existing algorithms are based on 3D coordinates of backbone atoms, however the proposed method also incorporates auxiliary information
along with these 3D coordinates. In order to make this distance matrix uniform, a sigmoid function has been used for conversion of values of geodesic distance and RMSD to common similarity measures between 0 and 1.
Performance measures
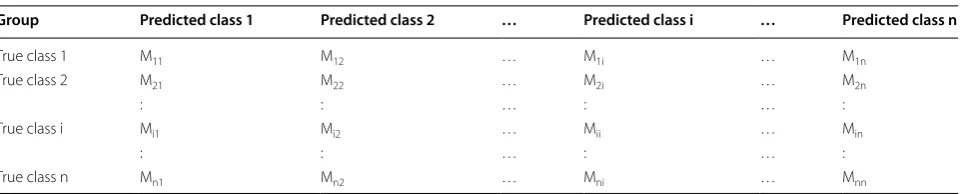
In order to compare the proposed algorithm with com-monly used existing algorithms for 3D protein struc-tures, number of clustering techniques such as K-Means, C-Means, Spectral K-Means clustering techniques have been used. It is noted that the results of clustering is not unique as it depends on clustering algorithms used for the analysis. In case of large datasets having known number of classes, the non-hierarchical clustering per-forms better than the hierarchical clustering. Therefore, the above clustering techniques are likely to perform best in a given situation. The performance of these algorithms for each of these clustering techniques was evaluated based on rand index (RI), recall, precision and F-meas-ure. These evaluation measures have been calculated based on confusion matrix (Table 1). The performance measure for each of the algorithms for a given clustering technique is an indicative measure to evaluate the per-formance of the respective algorithm, as the clustering is applied on the distance metric generated from the cor-responding algorithm.
correctly as per the SCOP database classes; Mji where
i�=j is the number of false positives, i.e., pair of proteins that are classified incorrectly as correctly identified but rejected. Mij where i�=j is the number of false nega-tives, i.e., pair of proteins that are classified incorrectly as incorrectly identified but accepted; Mij where i = j is the number of true negatives for ith class, i.e., pair of proteins that are classified correctly as incorrect identified and also rejected. Based on these values, RI, recall, precision and f-measure are calculated as follows
Results and discussion
In earlier study for comparing two protein structures based on ESA using only backbone atoms resulted with classification accuracy of 80.73 and 92.10 % for the first and second dataset of proteins respectively [23]. The pro-posed algorithm is based on ESA using either centroid of backbone atoms (ESA-MC-BB) or Cα (ESA-CA) along
with dihedral angles as geometric property of molecu-lar structure. Further, in order to improve the alignment molecular auxiliary information such as hydrophobicity (ESA-MC-BB + HP or ESA-CA + HP), polarity (ESA-MC-BB + POL or ESA-CA + POL), mass of residues, functional group type and number of side-chain atoms along with back bone atoms have been considered. In order to compare the effect of auxiliary information on classification accuracy and computational time, differ-ent combinations of molecular auxiliary information has
RIi=
iMii
ijMji
where j�=i,
Precisioni=
Mii
jMji
where j�=i,
Recalli =
Mii
jMij
where j�=i
F−Measure= 2∗(Precision∗Recall) (Precision+Recall)
been included through the proposed algorithm and anal-ysis was done on the first and second datasets using dif-ferent clustering techniques. It was observed that either the classification accuracy has increased or there is sub-stantial reduction in computational time of comparison of two protein structures through proposed algorithm. The performance measures such as RI, precision, recall and f-measure are shown in Table 2.
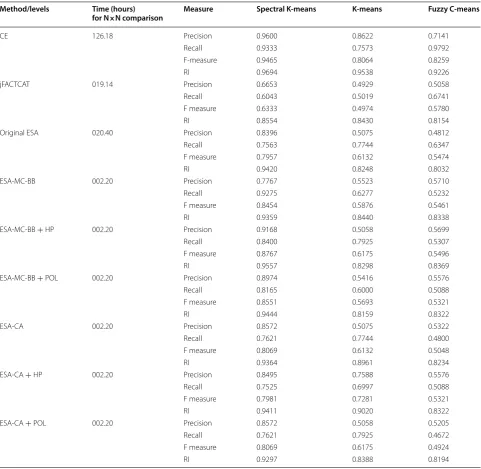
The proposed algorithm was evaluated with exist-ing algorithms based on computational time (Table 2). It is observed from the table that the computational time required for comparison of 100 proteins dataset for CE, jFATCAT and Original ESA are more i.e., 126.18, 19.14, 20.40 h respectively. However, our proposed algorithm takes considerably less time i.e., 2.20 h. Therefore, our algorithm is quite efficient in terms of computational time.
It has been reported earlier [23] that original ESA, which is based on all backbone atoms of the protein structures, time consumed to perform the experiment of 100 protein structures comparison was recorded on a desktop computer (8 GB RAM; 64-bit Windows 7 OS; MATLAB version 7.9.0) was 59 h but when it is imple-mented in R, it took 20.40 h. Under the same setup, the proposed algorithm implemented using R (version 3.1.3), the computing time varied from 2.80 to 3.00 h. As per algorithm, we employed three different criterion to evaluate variation in the results based on various geo-metric properties such as (1) backbone atoms, (2) c-alpha and (3) centroid of backbone atoms along with orienta-tion (dihedral angles). In addiorienta-tion to this, the auxiliary information i.e., hydrophobicity and polarity for each amino acid in a protein are considered. In view of time complexity, the earlier ESA method used 3D coordinates of all backbone atoms (N, Cα and C) [23]. In this case, if there are n number of amino acids (or residues) then the length of curve will be 3n as each amino acid is being represented by three atoms. The rest of the criterion i.e., (2) and (3) are based on n number of centroid 3D coor-dinates, five molecular properties and three geometric properties as dihedral angles. These dihedral angles are
Table 1 Confusion matrix
Group Predicted class 1 Predicted class 2 … Predicted class i … Predicted class n
True class 1 M11 M12 … M1i … M1n
True class 2 M21 M22 … M2i … M2n
: : : … : … :
True class i Mi1 Mi2 … Mii … Min
: : : … : … :
phi, psi and omega for each amino acid, and five molecu-lar properties as mentioned above. Hence, the proposed algorithm is faster than the existing ESA [23] as the pro-posed algorithm is based on n number of data and ear-lier ESA is 3n in data size that reduces the one-third of the computational time without much compromising on performance.
The performance of Spectral K-Means clustering is bet-ter for comparison of various algorithms in bet-terms of pre-cision followed by Fuzzy C-Means clustering. However, results obtained by K-Means clustering techniques are not satisfactorily in terms of precision.
The performance of CE in terms of recall, F-meas-ure and RI is much better in comparison to all existing
Table 2 Performance measures of 100 proteins dataset from ESA, CE and jFATCAT methods at class level with computa-tional time
Method/levels Time (hours)
for N×N comparison Measure Spectral K-means K-means Fuzzy C-means
CE 126.18 Precision 0.9600 0.8622 0.7141
Recall 0.9333 0.7573 0.9792
F-measure 0.9465 0.8064 0.8259
RI 0.9694 0.9538 0.9226
jFACTCAT 019.14 Precision 0.6653 0.4929 0.5058
Recall 0.6043 0.5019 0.6741
F measure 0.6333 0.4974 0.5780
RI 0.8554 0.8430 0.8154
Original ESA 020.40 Precision 0.8396 0.5075 0.4812
Recall 0.7563 0.7744 0.6347
F measure 0.7957 0.6132 0.5474
RI 0.9420 0.8248 0.8032
ESA-MC-BB 002.20 Precision 0.7767 0.5523 0.5710
Recall 0.9275 0.6277 0.5232
F measure 0.8454 0.5876 0.5461
RI 0.9359 0.8440 0.8338
ESA-MC-BB + HP 002.20 Precision 0.9168 0.5058 0.5699
Recall 0.8400 0.7925 0.5307
F measure 0.8767 0.6175 0.5496
RI 0.9557 0.8298 0.8369
ESA-MC-BB + POL 002.20 Precision 0.8974 0.5416 0.5576
Recall 0.8165 0.6000 0.5088
F measure 0.8551 0.5693 0.5321
RI 0.9444 0.8159 0.8322
ESA-CA 002.20 Precision 0.8572 0.5075 0.5322
Recall 0.7621 0.7744 0.4800
F measure 0.8069 0.6132 0.5048
RI 0.9364 0.8961 0.8234
ESA-CA + HP 002.20 Precision 0.8495 0.7588 0.5576
Recall 0.7525 0.6997 0.5088
F measure 0.7981 0.7281 0.5321
RI 0.9411 0.9020 0.8322
ESA-CA + POL 002.20 Precision 0.8572 0.5058 0.5205
Recall 0.7621 0.7925 0.4672
F measure 0.8069 0.6175 0.4924
methods i.e. jFATCAT, original ESA etc. However, in case of proposed algorithm (ESA-MC-BB), recall and RI are comparable with CE through Spectral K-Mean clus-tering. It may be noted that computational time for CE is 126.18 h whereas proposed algorithm takes around 2.20 h for same task.
In terms of RI, the accuracy for the first and second set of proteins increased up to 88.72 and 95.57 %, respec-tively when hydrophobicity was included as auxiliary information. It was also observed that the RI of the pro-tein structures of second set shows 94.11 % accuracy when distance was calculated using 3D coordinates of Cα
atoms and hydrophobicity as the auxiliary information. This may be due to the fact that the proposed algorithm used only single coordinate for each residue as centroid of backbone atoms or Cα with dihedral angles (phi, psi
and omega). These dihedral angles are indirectly using all coordinates by single data point with three more addi-tional parameters. The proposed algorithm also included molecular properties of each residue and hence the results of proposed algorithm are comparable with ESA of all backbone atoms.
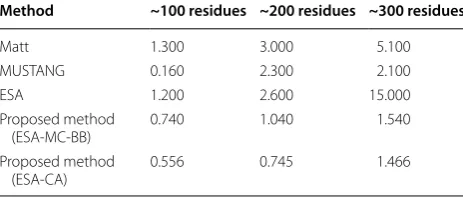
In another experiment, the computing time of the dif-ferent methods of protein structure comparison [22], viz., combinatorial extension (CE) [30], Matt [32], MUS-TANG [33] and ESA [22, 23] have been recorded for varying number of residues along with the proposed algorithm. The computing time of the existing and pro-posed algorithm are given in Table 3. In case of 100 resi-dues, MUSTANG required slightly less time as compared to proposed methods. The computational running time of the proposed methods are significantly smaller than the existing algorithm in case of protein containing larger than 100 residues.
The proposed method performed better in terms of classification accuracy due to the inclusion of side chain/ amino acid properties. This is due to the fact that inclu-sion side chain/amino acid properties provides more appropriate representations of protein structures as
per elastic shape analysis. Further, hydrophobicity plays important role in the folding of protein structures as the hydrophobic residues tend to moves towards inner struc-ture of the protein whereas, hydrophilic atoms moves towards the protein surface during protein folding [37]. Therefore, incorporation of this feature as auxiliary information led to the improvement in classification of proteins.
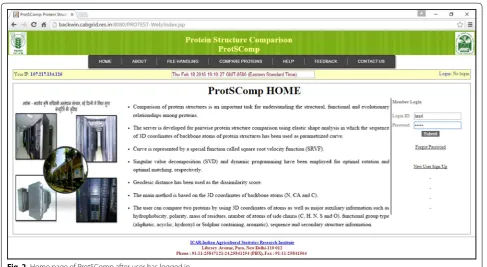
Web server implementation
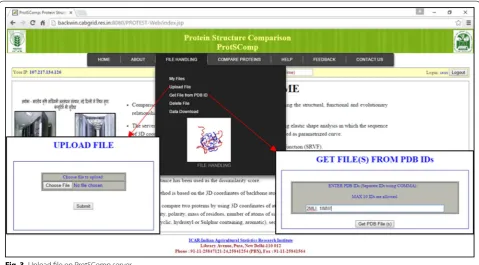
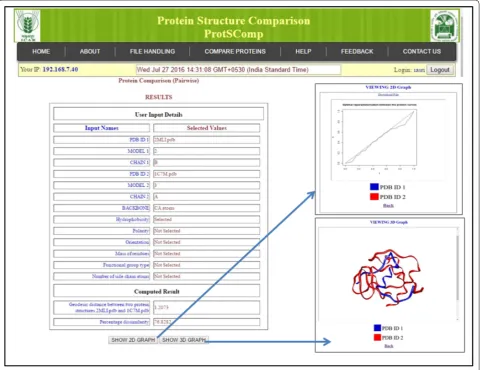
In order to use the proposed algorithm, a web based tool (ProtSComp) has been developed. In this tool, two pro-teins can be compared. The number of residues for the comparison is based on selection of model and chain. The user can upload PDB file(s) or give the PDB ID(s) (Fig. 3), select a model, a chain for each protein under consideration (Fig. 4). Protein structures can be com-pared using different criteria based on geometric and auxiliary information as discussed above (Fig. 4). As an example, for comparing two protein structures with PDB Ids i.e. “2MLI.pdb” (Model 2 and Chain B) and “1IMW. pdb” (Model 3 and Chain A) have been illustrated (Fig. 4). Finally, result outputs can be seen in terms of geodesic distance along with selected optional criterion, model and chain for both proteins. Also, optimal match-ing superimposed structure of both can be visualized in separate window (Fig. 5).
Conclusions
With the advent of high-throughput methods, the avail-ability of structural information of proteins is increas-ing at a much accelerated pace. There is a requirement of automatic annotation and classification of proteins in order to save resources in terms of time. Therefore, the fast and efficient algorithm is developed that will find the best alignment between two protein structures.
In this study, a computationally efficient algorithm has been developed in terms of run time for comparing pro-tein structures based on ESA approach. The 3D coordi-nates of protein backbone atoms using different criteria have been used including the auxiliary information based on side-chain properties residue wise. The proposed algorithm has been developed using R.
The proposed algorithm performed equally well in terms of accuracy with respect to existing techniques due to the inclusion of side chain and amino acid proper-ties. Inclusion of hydrophobicity as auxiliary information shows better result since it plays important role in the folding of protein structures. Incorporation of molecular properties as auxiliary information led to the improve-ment in comparison of two protein 3D structures. The
Table 3 Computational time (in seconds) required in com-paring two protein structures using different methods
Method ~100 residues ~200 residues ~300 residues
Matt 1.300 3.000 5.100
MUSTANG 0.160 2.300 2.100
ESA 1.200 2.600 15.000
Proposed method
(ESA-MC-BB) 0.740 1.040 1.540
Proposed method
Fig. 3 Upload file on ProtSComp server
proposed algorithm is faster in terms of computational time than the existing algorithm since it is based on n number of data instead of 3n in data size employed by existing algorithms.
Abbreviations
RMSD: root mean square deviation; DALI: Distance mAtrix aLIgnment; SRVF: square root velocity function; SVD: singular value decomposition; GUI: graphi-cal user interface; UPGMA: unweighted pair group method with arithmetic mean; RI: rand index; CE: combinatorial extension; ESA: elastic shape analysis; SCOP: structural classification of proteins.
Authors’ contributions
Conceptualization of research work by SS, DCM and AR. Coding and imple-mentation by SS, UBA and SBL. Analysis of algorithm and writing of the manu-script by SS, UBA and KKC. Valuable suggestions to improve the manumanu-script by AR and SNR. SNR was supported partially by Dr. Miller, Director James Graham Brown Cancer Center and Wendell Cherry Chair in Clinical Trial Research. All authors read and approved the final manuscript.
Author details
1 ICAR-Indian Agricultural Statistics Research Institute, New Delhi, India. 2 Biostatistics Shared Facility, James Graham Brown Cancer Center, University of Louisville, Louisville, USA. 3 Department of Bioinformatics and Biostatistics, University of Louisville, Louisville, USA. 4 Centre for Agricultural Bioinformat-ics, ICAR-Indian Agricultural Statistics Research Institute, Library Avenue, New Delhi 110012, India.
Acknowledgements
Authors wish to acknowledge the Indian Council of Agricultural Research (ICAR) for providing ASHOKA (Advanced Supercomputing Hub for Omics Knowledge in Agriculture) to conduct the study.
Competing interests
The authors declare that they have no competing interests.
Availability
The web-based application is accessible from http://www.backwin.cabgrid. res.in:8080/ProtSComp.
Received: 9 March 2016 Accepted: 21 September 2016
• We accept pre-submission inquiries
• Our selector tool helps you to find the most relevant journal
• We provide round the clock customer support
• Convenient online submission
• Thorough peer review
• Inclusion in PubMed and all major indexing services
• Maximum visibility for your research
Submit your manuscript at www.biomedcentral.com/submit
Submit your next manuscript to BioMed Central
and we will help you at every step:
References
1. Kolodny R, Koehl P, Levitt M. Comprehensive evaluation of protein structure alignment methods: scoring by geometric measures. J Mol Biol. 2005;346(4):1173–88.
2. Thompson JD, Plewniak F, Poch O. BAliBASE: a benchmark alignment database for the evaluation of multiple alignment programs. Bioinformat-ics. 1999;15:87–8.
3. Sauder JM, Arthur JW, Dunbrack RL. Large scale comparison of protein sequence alignment algorithms with structure alignments. Proteins Struct Func Genet. 2000;40:6–22.
4. Novotny M, Madsen D, Kleywegt GJ. Evaluation of protein-fold-compari-son servers. Proteins Struct Funct Genet. 2004;54:260–70.
5. Holm L, Ouzounis C, Sander C, Tuparev G, Vriend G. A database of protein structure families with common folding motifs. Protein Sci. 1992;1(12):1691–8.
6. Murzin AG, Brenner SE, Hubbard T, Chothia C. SCOP: a structural clas-sification of proteins database for the investigation of sequences and structures. J Mol Biol. 1995;247:536–40.
7. Lo Conte L, Ailey B, Hubbard TJ, Brenner SE, Murzin AG, et al. SCOP: a structural classification of proteins database. Nucl Acids Res. 2000;28:257–9.
8. Orengo CA, Michie AD, Jones S, Jones DT, Swindells MB, et al. CATH—a hierarchic classification of protein domain structures. Structure. 1997;5:1093–108.
9. Orengo CA, Pearl FM, Thornton JM. The CATH domain structure database. Methods Biochem Anal. 2003;44:249–71.
10. Shindyalov IN, Bourne PE. An alternative view of protein fold space. Proteins Struct Funct Genet. 2000;38:247–60.
11. Perutz MF, Rossmann MG, Cullis AF, Muirhead H, Will G, North ACT. Struc-ture of myoglobin: a three-dimensional Fourier synthesis at 5.5 Angstrom resolution, obtained by X-ray analysis. Nature. 1960;185:416–22. 12. Domingues F, Lackner P, Andreeva A, Sippl M. Structure-based evaluation
of sequence comparison and fold recognition alignment accuracy. J Mol Biol. 2000;297:1003–13.
13. Friedberg I, Kaplan T, Margalit H. Evaluation of PSI-BLAST alignment: accu-racy in comparison to structural alignments. Protein Sci. 2000;9:2278–84. 14. Mayr G, Domingues FS, Lackner P. Comparative analysis of protein
struc-ture alignments. BMC Struct Biol. 2007;7:50.
15. Hasegawa H, Holm L. Advances and pitfalls of protein structural align-ment. Curr Opin Struct Biol. 2009;19:341–8.
16. Wohlers I, Malod-Dognin N, Andonov R, Klau GW. CSA: comprehensive comparison of pairwise protein structure alignments. Nucl Acids Res. 2012;40:W303–9.
17. Levitt M, Gerstein M. A unified statistical framework for sequence comparison and structure comparison. Proc Natl Acad Sci USA. 1998;95:5913–20.
18. Eidhammer I, Jonassen I, Taylor WR. Protein bioinformatics: an algorithmic approach to sequence and structure analysis. New York: Wiley; 2004. ISBN 0-470-84839-1.
19. Salem S, Zaki MJ, Bystroff C. FlexSnap: Flexible Non-sequential Protein Structure Alignment. Algorithms Mol Biol. 2010;5:12. doi:10.1186/1748-7188-5-12.
20. Holm L, Sander C. Protein structure comparison by alignment of distance matrices. J Mol Biol. 1993;233(1):123–38.
21. Li SC. The difficulty of protein structure alignment under the RMSD. Algorithms Mol Biol. 2013;8:1.
22. Liu W, Srivastava A, Zhang J. A mathematical framework for protein struc-ture comparison. PLoS Comput Biol. 2011;7(2):e1001075. doi:10.1371/ journal.pcbi.1001075.
23. Liu W, Srivastava A, and Zheng J. Protein structure alignment using elastic shape analysis. In: Proceedings of the first ACM international conference on bioinformatics and computational biology (BCB ’10). New York: ACM; 2010. p. 62–70. doi:10.1145/1854776.1854790.
24. Schenk GF, Margraf T, Torda AE. Protein sequence and structure alignments within one framework. Algorithms Mol Biol. 2008;3:4. doi:10.1186/1748-7188-3-4.
25. Gajula, MNVP: Computer simulation meets experiment: molecular dynamics simulations of spin labeled proteins. PhD Thesis, Osnabrueck: University of Osnabrueck; 2008.
26. Klassen E, Srivastava A, Mio W, Joshi SH. Analysis of planar shapes using geodesic paths on shape spaces. IEEE Trans Pattern Anal. 2004;26:372–83. 27. Joshi SH, Srivastava A, Klassen E and Jermyn I. A novel representation for
computing geodesics between n-dimensional elastic curves. IEEE Confer-ence on Computer Vision and Pattern Recognition (CVPR) June 2007, Minneapolis.
28. Mio W, Srivastava A, Joshi S. On shape of plane elastic curves. Int J Com-put Vision. 2007;73:307–24.
29. Srivastava A, Klassen E, Joshi SH, Jermyn IH. Shape analysis of elas-tic curves in euclidean spaces. IEEE Trans Pattern Anal Mach Intell. 2011;33:1415–28.
30. Shindyalov IN, Bourne PE. Protein structure alignment by incremen-tal combinatorial extension (CE) of the optimal path. Protein Eng. 1998;11:739–47.
31. Ye Y, Godzik A. FATCAT: a web server for flexible structure comparison and structure similarity searching. Nucl Acids Res. 2004;32(Web Server issue):W582–5. doi:10.1093/nar/gkh430.
32. Menke M, Berger B, Cowen L. Matt: local flexibility aids protein multiple structure alignment. PLoS Comput Biol. 2008;4:e10.
33. Konagurthu AS, Whisstock JC, Stuckey PJ, Lesk AM. MUSTANG: a multiple structural alignment algorithm. Proteins. 2006;64:559–74.
34. Kendall DG. Shape manifolds, procrustean metrics and complex projec-tive spaces. Bull London Math Soc. 1984;16(2):81–121.
35. Laborde J, Robinson D, Srivastava A, Klassen E, Zhang J. RNA global align-ment in the joint sequence-structure space using elastic shape analysis. Nucl Acids Res. 2013;41(11):e114. doi:10.1093/nar/gkt187.
36. Berman HM, Westbrook J, Feng Z, Gilliland G, Bhat TN, et al. The protein data bank. Nucl Acids Res. 2000;28:235–42.
37. Kyte J, Doolittle RF. A simple method for displaying the hydropathic character of a protein. J Mol Biol. 1983;157(1):105–32 (PMID 7108955). 38. Zimmerman JM, Eliezer N, Simha R. The characterization of amino acid
sequences in proteins by statistical methods. J Theor Biol. 1968;21:170– 201 (PMID: 5700434).
39. Grantham R. Amino acid difference formula to help explain protein evolution. Science. 1974;185:862–4 (PMID: 4843792).
40. Morris AL, MacArthur MW, Hutchinson EG, Thornton JM. Stereochemical quality of protein structure coordinates. Proteins. 1992;12(4):345–64. 41. R Core Team: R: a language and environment for statistical computing. R
Foundation for Statistical Computing 2014, Vienna. http://www.R-project. org/.
42. Grant BJ, Rodrigues APC, ElSawy KM, McCammon JA, Caves LSD. Bio3D: an R package for the comparative analysis of protein structures. Bioinfor-matics. 2006;22:2695–6.
43. Idé J. Rpdb: Read, write, visualize and manipulate PDB files. R package version 2.2. 2014. http://www.CRAN.R-project.org/package=Rpdb. 44. Adler D, Murdoch D, et al. rgl: 3D visualization device system (OpenGL).