O R I G I N A L A R T I C L E
Open Access
Exploring the link between energy security
and subjective well-being: a study of 22
nations
Adam Mayer
1*and E. Keith Smith
2Abstract
Background:Energy has long been recognized as foundational for well-being, and recent work, has documented a link between access to energy services and health. In this analysis, we ask how worries about the energy system— in the form of access, cost, reliability, and sustainability—influence self-rated health.
Results:Using data from 22 nations and some 30,000 respondents, we find that worries about energy security reduce rated health. Partial proportional odds models suggest that this effect varies across thresholds of self-rated health, wherein individuals highly worried about energy security are significantly less likely to report“Very Good”self-rated health.
Conclusions:Worries about energy security reduce subjective well-being, suggesting another avenue through which energy relates to human health.
Keywords:Energy security, Subjective well-being, Cross-national, Self-rated health
Introduction
The development of modern energy systems has led to marked improvements in the standard of living
for large portions of the world’s population [43]. In
an oft-cited quote, E.F. Schumacher remarked that
energy systems are “not just another commodity, but
the precondition of all commodities, a basic factor
equal with air, water, and earth” [42]. On a
macro-historical scale, energy is recognized as a prerequisite
to prosperity and flourishing humanity [35, 41, 49].
Energy, especially that produced via combustible fuels like wood and fossil fuels, is also associated with a range of public health and environmental problems [17, 33]. Further, well-being could probably be maxi-mized at levels of energy consumption much lower than that found in wealthy nations like the USA and
Western Europe [9, 20, 47, 48]. Increasingly, research
is pointing to energy security as a key variable in the
relationship between energy and well-being [24, 25].
In this paper, we ask how worries about energy
security influence self-rated health. To do so, we lever-age representative cross-national data for 22 nations and a novel partial proportional odds modelling strat-egy. In the next section, we describe the ongoing de-bates about how to define energy security.
What is energy security?
Energy security is widely understood as a complex, multi-dimensional phenomenon that defies a simple definition with definitions of energy security growing in scope over time [2]. Chester [4] critiques early definitions of energy security as often relying upon on a relatively simplistic logic wherein energy secur-ity was primarily understood in terms of
affordabil-ity. Sovacool and Mukherjee [45] conducted
qualitative elicitation interviews with energy policy experts. The authors observed that energy security is
“a synergistic concept that rests on multiple
inter-connected dimensions, akin to a complex ecosystem that is comprised of comprised of individual species
and their interaction” (pg. 5436). The authors
advance a framework identifying multiple dimensions of energy security: availability, affordability, techno-logical development (i.e., the ability of technology to
© The Author(s). 2019Open AccessThis article is distributed under the terms of the Creative Commons Attribution 4.0 International License (http://creativecommons.org/licenses/by/4.0/), which permits unrestricted use, distribution, and reproduction in any medium, provided you give appropriate credit to the original author(s) and the source, provide a link to the Creative Commons license, and indicate if changes were made.
* Correspondence:[email protected]
1Human Dimensions of Natural Resources, Colorado School of Public Health, Colorado State University, Fort Collins, USA
adapt to changes), sustainability, and regulatory schemes. Hernández [24] identifies three dimensions of energy security that are highly consequential for
human health—economic energy security refers to
the affordability of energy relative to household income, physical energy security (i.e., the quality of energy infrastructure, housing, and the like), and be-havioral energy security. The latter refers to behav-ioral modifications made to adapt to energy security in the first two domains. Hughes [26] argues that energy conservation is a key component of energy security.
Although the specifics of these definitions vary, there are some commonalities between the divergent conceptualizations of energy security. Each definition implicitly recognizes that reliable, affordable energy services are necessary to promote human well-being. Yet a secure energy system secure does more than simply provide affordable and reliable energy. Rather, a truly secure energy system is adaptive and able to quickly deal with external changes, such as supply chain interruptions created by natural disasters, geo-political events, or terrorist attack. Thus, a secure energy system is arguably not overdependent upon energy imports or is at least able to rapidly adjust to reductions in energy imports.
A small body of literature has tracked cross-na-tional individual perceptions of energy security. In a series of related papers, Sovacool and collaborators have worked to describe perceptions of energy and energy security. Sovacool [44] leveraged survey data from a diverse set of 12 countries, noting that pref-erences for a sustainable, efficient, and democratic energy system cut across cultures and nations with remarkable consistency. In a related study, Sovacool and Tambo [46] report that female respondents report more concern about the sustainability dimen-sions of energy security, but residents of affluent nations were no more apt to emphasize the link be-tween climate change and energy production. Thus, there is a small body of literature that tracks percep-tions of energy security across napercep-tions but more research in this area is needed. In the next section, we review the small body of research on the inter-section between energy security and well-being.
Energy security and health
Energy is broadly recognized as a prerequisite to progress and well-being, although current levels of energy consumption in developed nations exceed
that necessary to maximize well-being [9, 20, 47, 48].
Increasingly, research identifies a connection be-tween energy security and well-being.
Hernández [24] provides a comprehensive concep-tual model that maps the linkages between energy security and health, broadly construed. Their frame-work suggests that energy security has three distinct dimensions: economic, physical, and behavioral. Eco-nomic insecurity refers in general terms to a
house-holds’ ability to pay for energy services; physical
infrastructure refers to the quality of the built envir-onment in terms of energy efficiency, thermal com-fort, and air quality exposures. Behavioral energy security is conceptualized as adaptive household be-haviors as a result of burdensome energy costs or poor built environmental quality. Hernández [24]
proposed an “energy insecurity pathway to disease
and disadvantage” that portrayed energy security as a
mediating mechanism between social disadvantage and poor health. For Hernandez [24], energy inse-curity erodes health status via several causal path-ways related to indoor environmental quality (e.g., thermal comfort, mold, gas leaks).
Some literature links energy security to human
health in the USA. The literature identifies a “heat
or eat” trade-off faced by low-income households
where some necessities (e.g., food) are prioritized over others like thermal comfort and adequate heat
[14, 39]. Cook et al. [5] considered the connection
between energy security and childhood health in several US cities. Net of controls, energy insecurity
was associated with an increased likelihood of
hospitalization, lower self-rated health, and develop-mental problems among children. In a study of urban US residents, Hernández and Siegel [25] found that controlling for race and income, energy insecur-ity—measured as inability to pay utility bills and
ser-vice interruptions—was associated with increased
asthma, pneumonia (within the past 12 months), depression, and poor sleep quality. However, the ef-fect of energy security on self-rated health was not statistically significant. Fernández et al. [13] finds a relationship between hardship (measured as inability to pay a utility bill), food insecurity, and behavioral problems in children in 20 US cities. This relation-ship between food security and energy security has similarly been observed in Canada [10].
Research in this area has also emerged from Europe. Using a large French sample, LaCroix and collabora-tors report an association between energy security and
self-rated health [31, 32]. Disabled persons may be
cold, damp home is associated with feelings of depression in the northern UK. Healy (2003) used na-tional-level data for EU nations and reports that excess winter deaths in EU nations may be a result of insufficient heating. Demski et al. [7] is one of the few comparative studies of perceptions of energy
secur-ity—the authors find that national-level factors like
energy prices, electricity consumption, and GDP per capita explain perceptions of energy security across nations.
Thus, prior research indicates that energy security is linked to health across various domains, but several questions remain. To the best of our knowledge, most of the research has been conducted with major metro-politan areas of a few counties, with a handful of inter-national comparative studies that employ contextual data. Thus, there is a need for cross-national compara-tive perspeccompara-tives in this area. Further, prior research has focused primarily on how affordability or the experience of a loss of energy services impacts health, especially among children. However, another possible pathway that connects energy security to health is rooted in anxiety and worry about energy access, affordability, dependability, and sustainability—all as-pects of energy security. Similar to worries about fi-nancial security, worries about energy security could induce stress, causing a loss of well-being.
In the next section, we describe the data we use to examine this hypothesis cross-nationally.
Methods and data
Survey data is provided by the of the 2016 European Social Survey (ESS), Wave 8 [12]. There is a paucity of cross-national data on perceptions of energy security, but the 2016 ESS includes a special module with several items addressing energy security and indicators of subjective well-being. Data was collected in the latter half of 2016, primarily using CAPI and face-to-face interviews. The in-strument underwent exhaustive pre-testing in each nation and was conducted in the languages appropriate for a given nation. The 2016 ESS covers the following 22 na-tions: Austria, Belgium, Czech Republic, Estonia, Finland, France, Germany, Hungary, Iceland, Ireland, Israel, Italy,
Lithuania, Netherlands, Norway, Poland, Portugal,
Romania, Russia, Slovenia, Spain, Sweden, Switzerland, and the UK. Within-country response rates ranged from 42.8 (UK) to 69.6% (Poland). The smallest number of completions was 880, in Iceland, while for most nations, over 1500 respondents completed the survey.
Outcome: self-rated health
Our dependent variable is a measure of self-rated health (SRH). SRH is a popular indicator, particularly
in cross-national research, because of its strong
pre-dictive validity—that is, individuals who rate their
health as poor are more likely to be in poor health as measured by more objective indicators [55]. Poor self-rated health is also associated with all-cause
mortality [8, 28, 38], a relationship that persists
cross-nationally [3, 23]. People tend to report
im-provements in self-rated health when their actual health status changes, such as after significant volun-tary weight loss [40]. Thus, SRH provides a useful, externally valid snapshot of well-being, particularly useful for cross-national studies, where collecting data about objective health status would be
cumber-some and resource-intensive. Figure 1 provides the
distribution of SRH. Most respondents reported
“Good” or “Very Good” health, with relatively few
(1.4%) indicating “Very Bad” health.
Predictor: energy security worries
The 2016 ESS contains a special module, “Public
Attitudes to Climate Change, Energy Security, and
Energy Preferences” including questions assessing
worries about energy systems. Respondents were asked to report (i) how worried they were that en-ergy was too expensive for many people, (ii) that their nation was too dependent upon energy imports, (iii) that natural disasters might disrupt energy deliv-ery, (iv) that the energy system might produce insuf-ficient power, (v) that technical failures might lead to disruptions, and (vi) that terrorist attacks might cause disruptions in energy delivery. Each item is
scaled from “not at all worried” to “extremely
wor-ried,” with higher scores indicating more worry. We
combined these items into an additive scale with a Cronbach’s alpha of 0.85, where the lowest score “1”
represents a lack of energy security and a “5”
repre-sents the maximum amount of worry.
Control variables
Prior research has identified several correlates of self-rated health, and we accordingly include appropriate control vari-ables. First, self-rated health is associated with social capital ([30,34,36,50]; 34. Although we cannot include predictors for every aspect of social capital, the ESS does include sev-eral indicators for trust—trust is often conceptualized as a component of social capital. Thus, we create scales for
Gen-eralized Trust (i.e., the belief that most people are
trust-worthy, Cronbach’s alpha = 0.762) and Institutional Trust (i.e., trust in major social institutions, such as the state, legal system, or law enforcement, Cronbach’s alpha = 0.901).1 More details about the specific survey items constituting these scales can be found inAppendix 1.
We also control for current health with a question that asked if respondents were limited by sickness or injury (1 = no, 2 = to some extent, 3 = a great deal), and we control for disability status (0 = not disabled, 1 = disabled). Several studies link unemployment to a loss of well-being, an effect that seems to endure even after new employment is found [1, 21, 56]. To capture unemployment, respondents were asked if they have experienced unemployment in the past 3 months or in the past 12 months in two distinct questions (0 = no, 1 = yes). Sex was captured with a binary variable (0 = female, 1 = male), age is measured in years, education has seven categories (following ISCED classification), and respondents were also classified by income decile for their nation. Table1displays descriptive statistics for the control variables.
Modelling approach
A standard approach to modelling ordinal outcomes like SRH is the ordinal logistic regression model, also known as the proportional odds model. This model rests upon the assumption that the regression coefficients do not vary across categories of the out-come variable (or, more formally, the cutpoint equa-tions)—this assumption is typically called the parallel
lines or proportional odds assumption [18, 19]. In
our application, an ordinal logistic regression model would assume that worry about energy security would have the same effect on the probability of
“Very Good” self-rated health as it would on the
probability of any other category of self-rated health. This proportional odds assumption is often violated because the effect of a predictor often varies across categories of the outcome variable. Prior research has shown that the proportional odds assumption is
often violated in the case of subjective well-being data (e.g., Authors; 2015; [6]).
There are several courses of action in the face of a pro-portional odds assumption violation. Researchers could rely on theory to determine when to relax the assumption. However, most social science theories offer little specifics on when a theoretically salient predictor should vary across categories of an outcome. At times, researchers may ignore this violation for the sake of parsimony and es-timate an ordinal logistic regression model. Alternatively, some might implement a multinomial logistic regression model, which estimates a unique coefficient for each vari-able for each category of the outcome varivari-able, not just those that have violated the proportional odds assump-tion. The obvious drawback of the multinomial approach is that the analyst must interpret very complex model out-put, with a unique coefficient (and associatedpvalue) for each category of the outcome variable for every predictor, all in relation to a base outcome.
In this analysis, we implement the generalized ordinal logistic regression model, also known as the partial
pro-portional odds (PPO) model [52,53]. The PPO model
per-forms a series of Wald tests to determine if each predictor has violated the proportional odds assumption across all outcome categories. When the assumption is violated, the PPO model relaxes the effect of that specific predictor, allowing it to vary across categories of the outcome vari-able. However, if the proportional odds assumption is not violated, the effect of that predictor remains fixed across the outcome (identical to an ordered logistic regression). In this way, the PPO model provides key advantages over the restrictive ordinal logistic regression model and the more cumbersome multinomial regression approach.
Non-linear models can be notoriously difficult to interpret [37], and the PPO model is more complex than a simple binary or ordinal logistic regression. To complement our regression tables, we also pro-vide predicted probabilities derived from our models. These probabilities are calculated by manipulating the scores of our energy worry scale within different categories of self-rated health, holding all other vari-ables at their observed scores. Our models include fixed effects for each country to control for
unob-served heterogeneity across nations. We don’t report
the fixed effects in our tables below, but provide full
results in Appendix 2 and Appendix 3.
Before estimating our PPO model, we present some simpler models to understand the relationship between our predictors and outcome. Following
related analyses (e.g., [27, 29]), we begin with an
OLS regression, where SRH is treated as a continu-ous outcome. We then proceed with a binary logistic
regression model, where “Very Good” self-rated
health is compared to all other categories. Lastly, we
1
then estimate the full PPO model. All models in-clude appropriate weighting as described the ESS technical documentation [11].
Results
Preliminary models: OLS regression and binary logistic regression
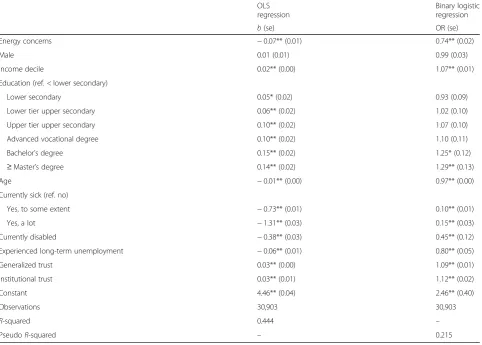
Table 2 displays the results of our OLS regression
model. Consistent with our expectations, worries about energy security reduce SRH (b=−0.07, p< .01). Among our controls, relationships are largely consist-ent with prior literature, wherein income, education, and trust all improve SRH. The OLS model explains
44% (R2= 0.444) of the variation in SRH. In Table 2,
we also provide odds ratios and standard errors for
the binary logistic regression model for “Very Good”
self-rated health. The estimated direction of the rela-tionships is consistent with those from the OLS
model—worries about energy security reduce SRH
(OR = 0.74, p< 0.01). Again, those with higher socio-economic status and trust tend to report better health.
Partial proportional odds model
The proportional odds assumption was violated for several variables. These include our focal predictor,
Energy Security Worry, the dummy variables for
education, age, sickness, and many of the country fixed effects. Thus, we relax the proportional odds assumption for these variables. In practical terms, this means that the odds ratios for these predictors vary
across categories of SRH, as shown in Table 3. If the
proportional odds assumption was not violated, we
omit the odds ratios at categories below “Good” SRH
to improve the presentation of our regression table because these odds ratios are stable across categories of SRH. Further, coefficients are presented for all but
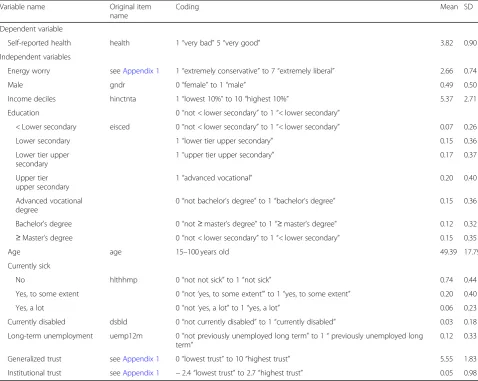
Table 1Descriptive statistics for all variables
Variable name Original item name
Coding Mean SD
Dependent variable
Self-reported health health 1“very bad”5“very good” 3.82 0.90
Independent variables
Energy worry seeAppendix 1 1“extremely conservative”to 7“extremely liberal” 2.66 0.74
Male gndr 0“female”to 1“male” 0.49 0.50
Income deciles hinctnta 1“lowest 10%”to 10“highest 10%” 5.37 2.71
Education 0“not < lower secondary”to 1“< lower secondary”
< Lower secondary eisced 0“not < lower secondary”to 1“< lower secondary” 0.07 0.26
Lower secondary 1“lower tier upper secondary” 0.15 0.36
Lower tier upper secondary
1“upper tier upper secondary” 0.17 0.37
Upper tier upper secondary
1“advanced vocational” 0.20 0.40
Advanced vocational degree
0“not bachelor’s degree”to 1“bachelor’s degree” 0.15 0.36
Bachelor’s degree 0“not≥master’s degree”to 1“≥master’s degree” 0.12 0.32
≥Master’s degree 0“not < lower secondary”to 1“< lower secondary” 0.15 0.35
Age age 15–100 years old 49.39 17.79
Currently sick
No hlthhmp 0“not not sick”to 1“not sick” 0.74 0.44
Yes, to some extent 0“not‘yes, to some extent’”to 1“yes, to some extent” 0.20 0.40
Yes, a lot 0“not‘yes, a lot”to 1“yes, a lot” 0.06 0.23
Currently disabled dsbld 0“not currently disabled”to 1“currently disabled” 0.03 0.18
Long-term unemployment uemp12m 0“not previously unemployed long term”to 1“previously unemployed long term”
0.12 0.33
Generalized trust seeAppendix 1 0“lowest trust”to 10“highest trust” 5.55 1.83
Institutional trust seeAppendix 1 −2.4“lowest trust”to 2.7“highest trust” 0.05 0.98
one of the response outcomes (“Very Good”), due to the estimation technique utilized.2
We focus our description of the results on the focal pre-dictor variable—Energy Security Worry—but also note other important relationships. Worry about energy security re-duces the probability of “Fair” (OR = 0.81, p< 0.01) and
“Good” (OR = 0.76,p< 0.001) SRH. However, the effect is not significant for the“Very Bad”and“Bad”categories.
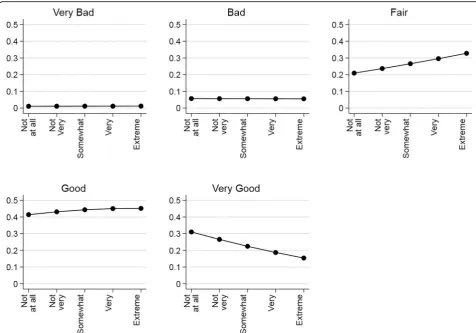
In Fig.2, we present the predicted probabilities of energy security worries across each outcome of SRH. The probabil-ities underscore the results reported in Table3but provide important clarifications. Energy security worries do not
change the likelihood of reporting“Very Bad”health to any practically significant degree—indeed, the probability of
“Very Bad”health is barely above 0.0, even for respondents with a great deal of worry about energy security. Similarly, panel 2 of Fig.2also implies that worries about energy se-curity do not enhance or erode the probability of “Bad” health. However, worries about energy security become more consequential for the higher categories of SRH. People who are extremely worried are some 0.12morelikely to re-port“Fair”health than those who report little worry about the energy system (i.e., a probability of 0.20 vs 0.32, respect-ively). Worries about energy security slightly increase the probability of“Good”SRH, but the size of this effect is min-iscule in practical terms. Importantly, energy security wor-ries appear to most substantially effect the likelihood of reporting“Very Good” SRH. People with no worries about energy security have a probability of 0.31, but decreases to 0.15 for those with a high degree of worry. Hence, Fig. 2 suggests that primary effect of energy security is to signifi-cantly reduce to probability of people reporting“Very Good” health and increase the probability of “Fair” SRH. That is,
2Within partial proportional odds models, the models are separately
estimated for each outcome of the response variable, like estimating a series of logistic regressions. For the first outcome“Very bad,”models are estimated with response 1 = 0 and responses 2, 3, 4, and 5 = 1. For the second outcome“Bad,”models are estimated with responses 1 and 2 = 0 and 3, 4, and 5 = 1. This pattern continues with the further responses. No results are reported for the final outcome,“Very good,” as the model would be estimated with responses 1, 2, 3, 4, and 5 = 0, and therefore, nothing would equal 1 [51].
Table 2OLS and binary logistic regression models for self-rated health
OLS regression
Binary logistic regression
b(se) OR (se)
Energy concerns −0.07** (0.01) 0.74** (0.02)
Male 0.01 (0.01) 0.99 (0.03)
Income decile 0.02** (0.00) 1.07** (0.01)
Education (ref. < lower secondary)
Lower secondary 0.05* (0.02) 0.93 (0.09)
Lower tier upper secondary 0.06** (0.02) 1.02 (0.10)
Upper tier upper secondary 0.10** (0.02) 1.07 (0.10)
Advanced vocational degree 0.10** (0.02) 1.10 (0.11)
Bachelor’s degree 0.15** (0.02) 1.25* (0.12)
≥Master’s degree 0.14** (0.02) 1.29** (0.13)
Age −0.01** (0.00) 0.97** (0.00)
Currently sick (ref. no)
Yes, to some extent −0.73** (0.01) 0.10** (0.01)
Yes, a lot −1.31** (0.03) 0.15** (0.03)
Currently disabled −0.38** (0.03) 0.45** (0.12)
Experienced long-term unemployment −0.06** (0.01) 0.80** (0.05)
Generalized trust 0.03** (0.00) 1.09** (0.01)
Institutional trust 0.03** (0.01) 1.12** (0.02)
Constant 4.46** (0.04) 2.46** (0.40)
Observations 30,903 30,903
R-squared 0.444 –
PseudoR-squared – 0.215
Robust standard errors in parentheses *p< 0.05
worries about energy security do not appear to cause the people in our sample to report ill health as a result.
Robustness checks
The literature on SRH is vast, and prior studies have identi-fied a multitude of individual and contextual level factors that correlate with self-rated health. Because of this, we undertook robustness checks to determine under what con-ditions our inferences about self-rated health might not hold because of an omitted variable. We use thepkonfound user-written command in Stata 15/IC to estimate the cor-relation of an omitted variable with our focal predictor (en-ergy security worries) and SRH for each category of SRH [15,16]. We use this command to determine the number of cases that would have to be replaced with a case of zero ef-fect to make the relationship lose its statistical significance.
We found that, to render the“Good”coefficient statisti-cally non-significant, 80% of the cases would have to be replaced with a case of no effect. For the“Fair”coefficient, 75.2% of the cases would have to be measured with error to invalidate the inference. Thus, the ESS data would have to contain a great deal of measurement error to reverse
our core finding that energy security worries influence self-rated health. It is possible that an omitted variable could attenuate the relationship between energy worries and SRH. However, socioeconomic factors are the most likely correlates of both energy security and SRH, and our estimates already control for these variables. Hence, the effect ofEnergy Security Worrycould be attenuated by an unmeasured non-economic variable, but the literature does not point to an obvious candidate for this variable.
Discussion
The purpose of this paper was to understand the relation-ship between energy security and subjective well-being. To accomplish this aim, we used cross-national survey data and a novel set of indicators for worries about energy security, with self-rated health as the dependent variable, leveraging partial proportional odds models to understand the nuances of this relationship. This manuscript represents one of the few cross-national studies of energy security and well-being.
Results suggest that worries about energy security have a substantial association with SRH. Worries about energy se-curity do not appear to be associated with very bad health,
Table 3Partial proportional odds model for self-rated health
Very bad Bad Fair Good
OR (se) OR (se) OR (se) OR (se)
Energy concerns 0.97 (0.09) 1.00 (0.04) 0.81** (0.02) 0.76** (0.02)
Male – – – 1.05 (0.03)
Income decile – – – 1.08** (0.01)
Education (ref. < lower secondary)
Lower secondary 1.03 (0.23) 1.11 (0.13) 1.25** (0.09) 0.92 (0.09)
Lower tier upper secondary 0.96 (0.21) 1.08 (0.13) 1.39** (0.11) 0.99 (0.10)
Upper tier upper secondary 1.06 (0.24) 1.32* (0.16) 1.54** (0.11) 1.03 (0.10)
Advanced vocational degree 0.82 (0.21) 1.15 (0.15) 1.59** (0.12) 1.05 (0.10)
Bachelor’s degree 1.45 (0.46) 1.34* (0.19) 1.88** (0.16) 1.20 (0.12)
≥Master’s degree 0.74 (0.21) 0.99 (0.14) 1.90** (0.15) 1.23* (0.12)
Age 0.99* (0.00) 0.98** (0.00) 0.97** (0.00) 0.97** (0.00)
Currently Sick (ref. no)
Yes, to some extent 0.11** (0.03) 0.06** (0.01) 0.12** (0.00) 0.11** (0.01)
Yes, a lot 0.01** (0.00) 0.01** (0.00) 0.05** (0.00) 0.14** (0.02)
Currently disabled – – – 0.39** (0.03)
Experienced long-term unemployment 1.45 (0.29) 0.86 (0.07) 0.82** (0.04) 0.82** (0.05)
Generalized trust – – – 1.10** (0.01)
Institutional trust – – – 1.11** (0.02)
Constant 8.24 5.36 2.65 1.10
Observations 30,903
PseudoR-squared 0.236
Robust standard errors in parentheses.“Very good”is the reference category. Models includes country fixed effects. The proportional odds assumption was violated for Energy Security Worry, Education, Age, and Currently Sick
but they may lead some otherwise healthy individuals to re-port lower SRH. However, this effect is inconsistent across categories of SRH. Energy security worries reduce the likeli-hood of people reporting“Very Good”health. But, worries about energy security do not seem to drive people to report very poor self-rated health. We were able to reveal this im-portance nuance by implementing the partial proportional odds model. In addition to being statistically significant, our analysis of predicted probabilities indicates that this rela-tionship is important in practical terms as well. Thus, worry about energy security has a practically relevant impact on self-rated health, suggesting that improving energy security could enhance self-rated health. This finding is especially significant because SRH is positively associated with a range of health problems, implying that the effect of energy inse-curity on health might be broad.
Conclusion
We view this manuscript as an initial effort to understand the link between self-rated health and energy security, but far more research is needed in this area. The bulk of the re-search on energy security and health has been conducted in developed nations in urban settings. Greater attention is
needed to non-urban places, developing countries, and even developed nations that might have certain spatially and eco-nomically marginalized populations outside of metropolitan areas. Studying these populations is increasingly important as they may face unique problems of access and reliability of energy services. Although our study is cross-national, we note that most of the countries under study have relatively advanced economies and energy systems. Future research should develop an understanding the relationship between energy security and well-being in a developing nation setting given that these populations are the most energy insecure. As is common in many areas of the social sciences, there is a marked lack of longitudinal research in this area—this ana-lysis suffers from this same limitation. Moving forward, we suggest that future researchers gather panel data to establish causal connections between improvements in energy secur-ity and enhanced well-being. Further, most of the literature on energy security and health has focused primarily on ob-jective, physical health maladies [24], but this analysis sug-gests that energy security might also have non-trivial impacts on subjective well-being and more general quality of life. There are multiple promising strains of research on the intersection of well-being and energy security.
Appendix 1
Table 4Item information for energy concern and institutional trust scales
Energy concern Mean Cronbach’sαif deleted
How worried are you…
That there may be power cuts in my country? 2.24 0.838
That energy may be too expensive for many people in (country)? 3.10 0.850
About (country) being too dependent on energy imports from other countries? 2.87 0.850
How worried are you that energy supplies could be interrupted by…
Natural disasters or extreme weather 2.66 0.827
Insufficient power being generated? 2.48 0.824
Technical failures? 2.53 0.828
Terrorist attacks? 2.63 0.840
Overall Cronbach’sα 0.857
N 41,728
Institutional trust Mean Cronbach’sαif deleted
How much you personally trust each of the institutions
Country’s parliament? 4.59 0.879
Legal system 5.42 0.886
The police 6.40 0.901
Politicians 3.65 0.877
Political parties 3.63 0.879
The European Parliament 4.27 0.887
The United Nations 5.01 0.893
Overall Cronbach’sα 0.901
N 38,849
Generalized trust
Most people…
Can be trusted (low to high) 5.27 0.669
Try to be fair (low to high) 5.81 0.663
Try to be helpful (low to high) 5.24 0.712
Overall Cronbach’sα 0.762
Appendix 2
Table 5OLS and binary logistic regression models for self-rated health
OLS regression Binary logistic regression
b(se) OR (se)
Energy concerns −0.07** (0.01) 0.74** (0.02)
Male 0.01 (0.01) 0.99 (0.03)
Income decile 0.02** (0.00) 1.07** (0.01)
Education (ref. < lower secondary)
Lower secondary 0.05* (0.02) 0.93 (0.09)
Lower tier upper secondary 0.06** (0.02) 1.02 (0.10)
Upper tier upper secondary 0.10** (0.02) 1.07 (0.10)
Advanced vocational degree 0.10** (0.02) 1.10 (0.11)
Bachelor’s degree 0.15** (0.02) 1.25* (0.12)
≥Master’s degree 0.14** (0.02) 1.29** (0.13)
Age −0.01** (0.00) 0.97** (0.00)
Currently sick (ref. no)
Yes, to some extent −0.73** (0.01) 0.10** (0.01)
Yes, a lot −1.31** (0.03) 0.15** (0.03)
Currently disabled −0.38** (0.03) 0.45** (0.12)
Experienced long-term unemployment −0.06** (0.01) 0.80** (0.05)
Generalized trust 0.03** (0.00) 1.09** (0.01)
Institutional trust 0.03** (0.01) 1.12** (0.02)
Country (ref. Austria)
Belgium −0.02 (0.03) 0.61** (0.06)
Switzerland 0.08** (0.03) 1.09 (0.11)
Czech Republic −0.12** (0.03) 0.73** (0.08)
Germany −0.25** (0.03) 0.40** (0.04)
Estonia −0.40** (0.03) 0.27** (0.03)
Spain −0.25** (0.03) 0.54** (0.06)
France −0.10** (0.03) 0.54** (0.06)
Finland −0.17** (0.03) 0.57** (0.07)
Great Britain 0.01 (0.03) 0.99 (0.11)
Hungary −0.30** (0.03) 0.42** (0.05)
Ireland 0.10** (0.03) 1.23* (0.13)
Israel 0.21** (0.03) 3.22** (0.36)
Italy 0.00 (0.04) 0.99 (0.13)
Iceland −0.14** (0.03) 0.69** (0.07)
Lithuania −0.29** (0.03) 0.29** (0.04)
Netherlands −0.16** (0.03) 0.35** (0.04)
Norway −0.04 (0.03) 0.85 (0.09)
Poland −0.16** (0.03) 0.52** (0.06)
Portugal −0.34** (0.04) 0.35** (0.05)
Russia −0.62** (0.03) 0.10** (0.02)
Sweden 0.03 (0.03) 0.91 (0.11)
Slovenia −0.13** (0.03) 0.61** (0.07)
Constant 4.46** (0.04) 2.46** (0.40)
Observations 30,903 30,903
R-squared 0.444 –
PseudoR-squared – 0.215
Robust standard errors in parentheses *p< 0.05
Appendix 3
Table 6Partial proportional odds model for self-rated health
Very bad Bad Fair Good
OR (se) OR (se) OR (se) OR (se)
Energy concerns 0.97 (0.09) 1.00 (0.04) 0.81** (0.02) 0.76** (0.02)
Male – – – 1.05 (0.03)
Income decile – – – 1.08** (0.01)
Education (ref. < lower secondary)
Lower secondary 1.03 (0.23) 1.11 (0.13) 1.25** (0.09) 0.92 (0.09)
Lower tier upper secondary 0.96 (0.21) 1.08 (0.13) 1.39** (0.11) 0.99 (0.10)
Upper tier upper secondary 1.06 (0.24) 1.32* (0.16) 0 1.03 (0.10)
Advanced vocational degree 0.82 (0.21) 1.15 (0.15) 1.59** (0.12) 1.05 (0.10)
Bachelor’s degree 1.45 (0.46) 1.34* (0.19) 1.88** (0.16) 1.20(0.12)
≥Master’s degree 0.74 (0.21) 0.99 (0.14) 1.90** (0.15) 1.23* (0.12)
Age 0.99* (0.00) 0.98** (0.00) 0.97** (0.00) 0.97** (0.00)
Currently sick (ref. no)
Yes, to some extent 0.11** (0.03) 0.06** (0.01) 0.12** (0.00) 0.11** (0.01)
Yes, a lot 0.01** (0.00) 0.01** (0.00) 0.05** (0.00) 0.14** (0.02)
Currently disabled – – – –
Experienced long-term unemployment 1.45 (0.29) 0.86 (0.07) 0.82** (0.04) 0.82** (0.05)
Generalized trust – – – 1.10** (0.01)
Institutional trust – – – 1.11** (0.02)
Country (ref. Austria)
Belgium 0.82 (0.25) 1.24 (0.21) 1.36** (0.14) 0.65** (0.06)
Switzerland 0.53 (0.25) 0.95 (0.21) 1.61**(0.19) 1.15 (0.11)
Czech Republic 3.66 (2.50) 0.55** (0.08) 0.66** (0.07) 0.75** (0.07)
Germany – – – 0.48** (0.04)
Estonia 0.52** (0.13) 0.42** (0.06) 0.29**(0.03) 0.28** (0.03)
Spain 0.59 (0.24) 0.22** (0.04) 0.49** (0.05) 0.58** (0.06)
France 1.51 (0.53) 1.40* (0.22) 0.78*(0.08) 0.57** (0.05)
Finland – – – 0.61** (0.05)
Great Britain – – – 1.03 (0.09)
Hungary 0.10** (0.02) 0.29** (0.04) 0.53** (0.06) 0.42** (0.05)
Ireland – – – 1.33** (0.12)
Israel 0.23** (0.07) 0.39** (0.06) 1.17 (0.14) 3.29** (0.34)
Italy – – – 0.97 (0.10)
Iceland 0.20** (0.06) 0.49** (0.09) 0.66** (0.07) 0.71** (0.07)
Lithuania 1.65 (0.61) 0.63** (0.09) 0.42** (0.04) 0.28** (0.03)
Netherlands 1.13 (0.66) 1.02 (0.20) 0.90 (0.10) 0.37** (0.04)
Norway 0.62 (0.21) 0.62** (0.11) 1.03 (0.12) 0.90 (0.09)
Poland – – – 0.61** (0.05)
Portugal – – – 0.35** (0.04)
Russia 0.48* (0.17) 0.31** (0.06) 0.14** (0.02) 0.10** (0.02)
Sweden 0.38** (0.13) 1.23 (0.24) 1.31* (0.18) 0.97 (0.11)
Slovenia 0.65** (0.06) 0.65** (0.06) 0.65** (0.06) 0.65** (0.06)
Constant 8.24 5.36 2.65 1.10
Observations 30,903
PseudoR-squared 0.236
Robust standard errors in parentheses.“Very good”is the reference category. The proportional odds assumption was violated for Energy Security Worry, Education, Age, and Currently Sick
Abbreviations
PPO:Partial proportional odds; SRH: Self-rated health
Acknowledgements Not applicable.
Authors’contributions
Both authors made equal contributions to the conceptualization, writing, and data analysis. Both authors read and approved the final manuscript.
Funding
The project was partly financially supported by the Leibniz Association (SAW-2017-PIK-4).
Availability of data and materials
Data is available freely from the European Social Survey via the links provided in the references.
Ethics approval and consent to participate Not Applicable
Consent for publication Not Applicable.
Competing interests
The authors declare that they have no competing interests.
Author details
1Human Dimensions of Natural Resources, Colorado School of Public Health, Colorado State University, Fort Collins, USA.2GESIS–Leibniz Institute for the Social Sciences, Cologne, Germany.
Received: 12 December 2018 Accepted: 18 July 2019
References
1. Åhs A, Westerling R (2006) Self-rated health in relation to employment status during periods of high and of low levels of unemployment. Eur J Public Health 16(3):294–304.https://doi.org/10.1093/eurpub/cki165 2. Ang BW, Choong WL, Ng TS (2015) Energy security: definitions, dimensions
and indexes. Renew Sustain Energy Rev 42(February):1077–1093.https://doi. org/10.1016/j.rser.2014.10.064
3. Appels A, Bosma H, Grabauskas V, Gostautas A, Sturmans F (1996) Self-rated health and mortality in a Lithuanian and a Dutch population. Soc Sci Med 42(5):681–689.https://doi.org/10.1016/0277-9536(95)00195-6
4. Chester L (2010) Conceptualising energy security and making explicit its polysemic nature. Energy Policy 38(2):887–895.https://doi.org/10.1016/j. enpol.2009.10.039
5. Cook JT, Frank DA, Casey PH, Rose-Jacobs R, Black MM, Chilton M, deCuba SE et al (2008) A brief indicator of household energy security: associations with food security, child health, and child development in US infants and toddlers. Pediatrics 122(4):e867–e875.https://doi.org/1 0.1542/peds.2008-0286
6. Cracolici MF, Giambona F, Cuffaro M (2014) Family structure and subjective economic well-being: some new evidence. Soc Indic Res 118(1):433–456. https://doi.org/10.1007/s11205-013-0425-5
7. Demski, C., Poortinga, W., Whitmarsh, L., Böhm, G., Fisher, S., Steg, L., & Pohjolainen, P. (2018). National context is a key determinant of energy security concerns across Europe. Nature Energy, 3(10), 882.
8. DeSalvo KB, Bloser N, Reynolds K, He J, Muntner P (2006) Mortality prediction with a single general self-rated health question. J Gen Intern Med 21(3):267.https://doi.org/10.1111/j.1525-1497.2005.00291.x 9. Dietz T, Rosa EA, York R (2009) Environmentally efficient well-being:
rethinking sustainability as the relationship between human well-being and environmental impacts. Hum Ecol Rev 16(1):114–123
10. Emery J, Herbert C, Bartoo AC, Matheson J, Ferrer A, Kirkpatrick SI, Tarasuk V, McIntyre L (2012) Evidence of the association between household food insecurity and heating cost inflation in Canada, 1998–2001. Canadian Public Policy, January.https://doi.org/10.3138/cpp.38.2.181
11. European Social Survey (2016a) ESS8 - 2016 Documentation Report. Norwegian Centre for Research Data, Norway
12. European Social Survey (2016b) European Social Survey Round 8 Data: Edition 2.0. Norwegian Centre for Research Data, Norway
13. Fernández CR, Yomogida M, Aratani Y, Hernández D (2018) Dual food and energy hardship and associated child behavior problems. Acad Pediatr 18(8):889–896.https://doi.org/10.1016/j.acap.2018.07.002
14. Frank DA, Neault NB, Skalicky A, Cook JT, Wilson JD, Levenson S, Meyers AF et al (2006) Heat or eat: the low income home energy assistance program and nutritional and health risks among children less than 3 years of age. Pediatrics 118(5):e1293–e1302.https://doi.org/10.1542/peds.2005-2943 15. Frank KA (2000) Impact of a confounding variable on a regression
coefficient. Sociol Methods Res 29(2):147–194.https://doi.org/10.1177/004 9124100029002001
16. Frank KA, Maroulis SJ, Duong MQ, Kelcey BM (2013) What would it take to change an inference? Using Rubin’s causal model to interpret the robustness of causal inferences. Educ Evalv Policy Anal 35(4):437–460. https://doi.org/10.3102/0162373713493129
17. Fritzsche AF (1989) The health risks of energy production. Risk Anal 9(4): 565–577.https://doi.org/10.1111/j.1539-6924.1989.tb01267.x
18. Fullerton AS (2009) A conceptual framework for ordered logistic regression models. Sociol Methods Res 38(2):306–347.https://doi.org/1 0.1177/0049124109346162
19. Fullerton AS, Xu J (2016) Ordered Regression Models: Parallel, Partial, and Non-Parallel Alternatives. Chapman and Hall/CRC, New York
20. Goldemberg J, Johansson TB, Reddy AKN, Williams RH (1985) Basic needs and much more with one kilowatt per capita. Ambio 14(4/5):190–200 21. Griep Y, Kinnunen U, Nätti J, De Cuyper N, Mauno S, Mäkikangas A, De
Witte H (2016) The effects of unemployment and perceived job insecurity: a comparison of their association with psychological and somatic complaints, self-rated health and life satisfaction. Int Arch Occup Environ Health 89(1): 147–162.https://doi.org/10.1007/s00420-015-1059-5
22. Harrington, B. E., Heyman, B., Merleau‐Ponty, N., Stockton, H., Ritchie, N., & Heyman, A. (2005). Keeping warm and staying well: findings from the qualitative arm of the Warm Homes Project. Health & social care in the community, 13(3), 259–267.
23. Heistaro S, Jousilahti P, Lahelma E, Vartiainen E, Puska P (2001) Self rated health and mortality: a long term prospective study in eastern Finland. J Epidemiol Community Health 55(4):227–232.https://doi.org/10.1136/jech.55.4.227 24. Hernández D (2016) Understanding‘energy insecurity’and why it matters
to health. Soc Sci Med 167(October):1–10.https://doi.org/10.1016/j. socscimed.2016.08.029
25. Hernández D, Siegel E (2019) Energy insecurity and its ill health effects: a community perspective on the energy-health nexus in New York City. Energy Res Soc Sci 47(January):78–83.https://doi.org/10.1016/j.erss.2018.08.011 26. Hughes L (2009) The four‘R’s of energy security. Energy Policy 37(6):2459–
2461.https://doi.org/10.1016/j.enpol.2009.02.038
27. Ichida Y, Hirai H, Kondo K, Kawachi I, Takeda T, Endo H (2013) Does social participation improve self-rated health in the older population? A quasi-experimental intervention study. Soc Sci Med 94(October):83–90.https://doi. org/10.1016/j.socscimed.2013.05.006
28. Idler EL, Benyamini Y (1997) Self-rated health and mortality: a review of twenty-seven community studies. J Health Soc Behav 38(1):21–37.https:// doi.org/10.2307/2955359
29. Idler EL, Cartwright K (2018) What do we rate when we rate our health? Decomposing age-related contributions to self-rated health. J Health Soc Behav 59(1):74–93
30. Kawachi I, Kennedy BP, Glass R (1999) Social capital and self-rated health: a contextual analysis. Am J Public Health 89(8):1187–1193.https://doi.org/1 0.2105/AJPH.89.8.1187
31. Lacroix E, Chaton C (2015) Fuel poverty as a major determinant of perceived health: the case of france. Public Health 129(5):517–524.https:// doi.org/10.1016/j.puhe.2015.02.007
32. Lacroix, Elie, and Florence Jusot. 2014.“Fuel poverty is it harmful for health? Evidence from French health survey data.”In Journées Des Économistes de La Santé Français (JESF), 19. Bordeaux, France.https:// hal.archives-ouvertes.fr/hal-01523725.
33. Lavaine E, Neidell M (2017) Energy production and health externalities: evidence from oil refinery strikes in France. J Assoc Environ Resour Econ 4(2):447–477.https://doi.org/10.1086/691554
35. Mazur, A., & Rosa, E. (1974). Energy and life-style. Science, 186(4164), 607– 610.
36. Meng T, Chen H (2014) A multilevel analysis of social capital and self-rated health: evidence from China. Health Place 27(May):38–44.https://doi.org/1 0.1016/j.healthplace.2014.01.009
37. Mood C (2010) Logistic regression: why we cannot do what we think we can do, and what we can do about it. Eur Sociol Rev 26(1):67–82.https:// doi.org/10.1093/esr/jcp006
38. Mossey JM, Shapiro E (1982) Self-rated health: a predictor of mortality among the elderly. Am J Public Health 72(8):800–808.https://doi.org/1 0.2105/AJPH.72.8.800
39. Nord M, Kantor LS (2006) Seasonal variation in food insecurity is associated with heating and cooling costs among low-income elderly Americans. J Nutr 136(11):2939–2944.https://doi.org/10.1093/jn/136.11.2939 40. Okosun IS, Choi S, Matamoros T, Dever GEA (2001) Obesity is associated
with reduced self-rated general health status: evidence from a representative sample of White, Black, and Hispanic Americans. Prev Med 32(5):429–436.https://doi.org/10.1006/pmed.2001.0840
41. Rao, N. D., & Min, J. (2018). Decent living standards: material prerequisites for human wellbeing. Social indicators research, 138(1), 225–244. 42. Schumacher, E. F., edited by Geoffrey Kirk (1977). Schumacher on energy:
speeches and writings of EF Schumacher. London: Cape.
43. Smil V (2008) Energy in Nature and Society: General Energetics of Complex Systems. MIT Press, Cambridge, MA
44. Sovacool BK (2016) Differing cultures of energy security: an international comparison of public perceptions. Renew Sustain Energy Rev 55(March): 811–822.https://doi.org/10.1016/j.rser.2015.10.144
45. Sovacool BK, Mukherjee I (2010) Conceptualizing and measuring energy security: a synthesized approach. Energy 36(8):5343–5355.https://doi.org/1 0.1016/j.energy.2011.06.043
46. Sovacool BK, Tambo T (2016) Comparing consumer perceptions of energy security, policy, and low-carbon technology: insights from Denmark. Energy Res Soc Sci 11(January):79–91.https://doi.org/10.1016/j.erss.2015.08.010 47. Spreng D (2005) Distribution of energy consumption and the 2000 w/capita target.
Energy Policy 33(15):1905–1911.https://doi.org/10.1016/j.enpol.2004.03.023 48. Steinberger JK, Roberts JT (2010) From constraint to sufficiency: the
decoupling of energy and carbon from human needs, 1975–2005. Ecol Econ 70(2):425–433. Special Section: Ecological Distribution Conflicts. https://doi.org/10.1016/j.ecolecon.2010.09.014
49. Stern, D. (2011). Energy and Economic Growth: The Stylized Facts. Retrieved 7/23/2019 fromhttps://asiaandthepacificpolicystudies.crawford.anu.edu.au/ pdf/seminars/2011/20111101_presentation_stern.pdf
50. Subramanian SV, Kim DJ, Kawachi I (2002) Social trust and self-rated health in US communities: a multilevel analysis. J Urban Health 79(1):S21–S34. https://doi.org/10.1093/jurban/79.suppl_1.S21
51. Thomson, H., & Snell, C. (2013). Quantifying the prevalence of fuel poverty across the European Union. Energy Policy, 52, 563–572.
52. Williams R (2006) Generalized ordered logit/partial proportional odds models for ordinal dependent variables. Stata J 6(1):58–82
53. Williams R (2016) Understanding and interpreting generalized ordered logit models. J Math Sociol 40(1):7–20.https://doi.org/10.1080/002225 0X.2015.1112384
54. Wolbring, G., & Leopatra, V. (2012). Climate change, water, sanitation and energy insecurity: Invisibility of people with disabilities. Canadian Journal of Disability Studies, 1(3), 66–90.
55. Wu S, Wang R, Zhao Y, Ma X, Wu M, Yan X, He J (2013) The relationship between self-rated health and objective health status: a population-based study. BMC Public Health 13(1):320.https://doi.org/1 0.1186/1471-2458-13-320
56. Zavras D, Tsiantou V, Pavi E, Mylona K, Kyriopoulos J (2013) Impact of economic crisis and other demographic and socio-economic factors on self-rated health in Greece. Eur J Public Health 23(2):206–210.https://doi.org/1 0.1093/eurpub/cks143
Publisher’s Note