Synthetic semi-supervised learning in imbalanced domains:
Constructing a model for donor-recipient matching in liver transplantation
M. P´erez-Ortiza,∗, P.A. Guti´errezb, M. D. Ayll´on-Ter´anc, N. Heatond, R. Ciriac, J. Brice˜noc, C. Herv´as-Mart´ınezb
aDepartment of Quantitative Methods, Universidad Loyola Andalu´ıa, C´ordoba, Spain bDepartment of Computer Science and Numerical Analysis, University of C´ordoba, C´ordoba, Spain
cLiver Transplantation Unit, Reina Sof´ıa Hospital, C´ordoba, Spain dLiver Transplantation Unit, King’s College, London, United Kingdom
Abstract
Liver transplantation is a promising and widely-accepted treatment for patients with terminal liver disease. However, transplantation is restricted by the lack of suitable donors, resulting in significant waiting list deaths. This paper proposes a novel donor-recipient allocation system that uses machine learning to predict graft survival after transplantation using a dataset comprised of donor-recipient pairs from the King’s College Hospital (United Kingdom). The main novelty of the system is that it tackles the imbalanced nature of the dataset by considering semi-supervised learning, analysing its potential for obtaining more robust and equitable models in liver transplantation. We propose two different sources of unsupervised data for this specific problem (recent transplants and virtual donor-recipient pairs) and two methods for using these data during model construction (a semi-supervised algorithm and a label propagation scheme). The virtual pairs and the label propagation method are shown to alleviate the imbalanced distribution. The results of our experiments show that the use of synthetic and real unsupervised information helps to improve and stabilise the performance of the model and leads to fairer decisions with respect to the use of only supervised data. Moreover, the best model is combined with the Model for End-stage Liver Disease score (MELD), which is at the moment the most popular assignation methodology worldwide. By doing this, our decision-support system considers both the compatibility of the donor and the recipient (by our prediction system) and the recipient severity (via the MELD score), supporting then the principles of fairness and benefit.
Keywords:
Liver transplantation, Transplant recipient, Survival analysis, Machine learning, Support vector machines, Semi-supervised learning, Imbalanced classification
1. Introduction
In the last decades, new trends in biomedicine have used ma-chine learning as a useful tool for a wide range of problems, re-sulting in remarkable applications for science (Tseng and Liao, 2009; Su and Wu, 2011). Nowadays, liver transplantation rep-resents a promising and accepted treatment for patients with end-stage liver disease. Nevertheless, transplantation is greatly hampered by the unavailability of suitable liver donors. Several methods have been developed and applied to find a better allo-cation system, able to prioritise recipients on the waiting list.
The first developed system for this purpose is the Donor Risk Index (DRI) (Feng et al., 2006), that establishes the quantitative risk of the transplant considering only donor information. On the other hand, the Model for End-stage Liver Disease (MELD) (Kamath and Kim, 2007) is a widely validated methodology, globally considered as the cornerstone of the current policy for transplant allocation. This index is based on the “sickest-first” principle and uses only information of the recipient. Figure 1
∗Corresponding author at: Department of Quantitative Methods,
Uni-versidad Loyola Andalu´ıa, Third Building, C/ Escritor Castilla Aguayo 4, 14004 C´ordoba, Spain. E-mail addresses: mariaperez@uloyola.es, pagutier-rez@uco.es, chervas@uco.es
graphically represents the current process for organ allocation (figure restructured from (Schaubel et al., 2009)). Note that computational models are used for this purpose as a decision support system. As previously mentioned, donors are gener-ally assigned to the candidates at greatest-risk (computed by the MELD score), a policy that does not allow the transplant team to do the matching according to the principles of fairness and survival benefit (i.e. pre-transplant and post-transplant mortal-ity), which could lead to a risk of unconscious gaming when try-ing to match marginal donors to urgent candidates (P´erez-Ortiz et al., 2014). The method proposed here for organ allocation seeks to minimize futile liver transplantation, giving primary attention to patients with the best predicted lifetime gained due to transplantation. Under a survival benefit model, an allocated graft goes to the patient with the greatest difference between the predicted post-transplant life-time and the predicted waiting list lifetime for this specific donor.
As shown in previous research, there are different donor char-acteristics which result in an increased risk and/or graft losses (Busuttil and Tanaka, 2003). These risks and characteristics should be carefully considered and included in the decision support system, since the combination of several of these risk factors can result in graft loss (Brice˜no et al., 2000).
More-Figure 1: Graphic representing the organ allocation process.
over, it has been noted that there are some factors (concerning both the donor and the recipient) that influence the outcome of transplantation to a great extent (P´erez-Ortiz et al., 2014). Be-cause of this, these first approaches cannot be considered good predictors of graft failure after transplantation, since they only take into consideration either characteristics of donors or recip-ients (but not both). New methods have emerged in the last years to deal with these issues. Rana et al. (2008) devised a scoring system (named SOFT) that predicts survival 3 months after liver transplantation, to complement MELD waiting list mortality by making use of both donor and recipient charac-teristics. Dutkowski et al. (2011) recently proposed a balance of risk (BAR) score based on donor and recipient character-istics. Finally, in (Cruz-Ram´ırez et al., 2012; Brice˜no et al., 2014), a rule-based system was developed to determine graft survival one year after the transplant using data from diff er-ent Spanish liver transplantation units, showing that the use of machine learning substantially improves the prediction capa-bilities of all previous approaches. In this case, the input of this rule-based system was the response of two artificial neu-ral networks trained with donor, recipient and transplant organ characteristics (all of these sources of information being used in this paper) and using evolutionary computation. One of the main limitations of the approaches developed in (Cruz-Ram´ırez et al., 2012; Brice˜no et al., 2014) is that, in order to approach the imbalanced nature of the data, specific fitness functions are applied for tuning the neural network weights and structure through the use of multi-objective evolutionary algorithms, thus the corresponding computational cost is very high.
Although the good performance of machine learning meth-ods has been assessed for donor-recipient matching, the imbal-anced nature of the data is still a handicap, as the results for the minority class tend to be worse (with respect to the major-ity one). Class imbalance is indeed one of the most common problems found in medical applications (and also in machine learning in general (Maalouf and Siddiqi, 2014; He and Garc´ıa, 2009)), where one or several classes have a much lower prior probability in the training set (in the context of this paper the less frequent class is graft loss, although correctly predicting a failure is the main objective). This fact needs to be taken into account in the model construction phase, because, otherwise, one could obtain accurate but trivial models (i.e. that always
predict the majority class). The approaches developed over the years for tackling the class imbalance problem can be cate-gorised in two groups: sampling (He and Garc´ıa, 2009; Chawla et al., 2002) and algorithmic approaches (Chang and Lin, 2011). Sampling concerns those methods that rely on a modification of the dataset (e.g. by over-sampling new data or by under-sampling) and algorithmic approaches modify the classifier (e.g. using a cost-sensitive method). Although both over-sampling and under-over-sampling approaches have been shown to improve classifier performance over imbalanced datasets, it has been shown in different studies that over-sampling is more useful than under-sampling (Japkowicz and Stephen, 2002a), specially for highly imbalanced and small datasets. Concern-ing cost-sensitive approaches, several works have shown that a replication of data or an imposition of higher weights for some patterns could result in over-fitting (Galar et al., 2012; P´erez-Ortiz et al., 2016).
In this paper, our main focus is to develop different strate-gies to improve the classification of the minority class, based on simpler implementations than the ones used in previous re-search (Cruz-Ram´ırez et al., 2012; Brice˜no et al., 2014). At the same time, we evaluate the applicability of this strategy to other transplant units, by considering a liver transplant dataset obtained from the King’s College Hospital in the United King-dom. Specifically, we tackle the imbalanced nature of the dataset by taking advantage of virtual donor-recipient pairs to improve the accuracy on the minority class. This new per-spective for alleviating the imbalance problem in transplanta-tion datasets is based on the use of semi-supervised learning. Important unsupervised information is available at the hospital and can be introduced during model construction by two ideas: exploiting very recent transplants (those whose follow-up time is not completed) and generating non-real or virtual matchings from other pairs that have been already transplanted (i.e. using potential organ transplantations that could have occurred in the past but did not). Most existing semi-supervised learning meth-ods assume a balance between negative and positive samples in both the labelled and unlabelled data (Li et al., 2011). Unfor-tunately, the issue of semi-supervised learning with imbalanced data has been barely studied in the literature (Li et al., 2011; Ma et al., 2011; Huang and Kecman, 2004), only mainly from the under-sampling and ensemble points of view. The proposed
un-supervised data generation (virtual or real) can reduce the bias of the obtained classifiers towards the majority class. Although the number of successful techniques to approach class imbal-ance is large, we compare our proposals to two well-known ideas: over-sampling and cost-sensitive learning (Chawla et al., 2002; Zhou, 2013), which are also the techniques that have been seen to perform better with Support Vector Machines (L´opez et al., 2013) (the classification paradigm used in this paper).
In summary, this paper studies different hypotheses concern-ing imbalanced data in semi-supervised scenarios: 1) whether a large amount of unlabelled data could help tackling the im-balanced classification problem, 2) whether the ratio of posi-tive/negative unlabelled patterns affects the results of the semi-supervised method, and 3) whether it is possible to successfully label unlabelled data and balance the class distribution. There-fore, apart from considering two sources of unlabelled data, this paper also explores two approaches for using these data during model construction (a semi-supervised algorithm and a label propagation scheme). Concerning the application to transplan-tation data, our contributions are also noteworthy: 1) The anal-ysis of our results with a new set of data obtained from the King’s College hospital, 2) the inclusion of expert knowledge in the system (e.g. using extended donors), 3) a thorough anal-ysis of the best model, including a study of the most important variables and a simulation of the system in a controlled envi-ronment. The performance reported in this paper shows that the use of unsupervised data (both synthetic and real) generally results in a significant improvement of the models and leads to very promising performance when predicting survival after 3 and 12 months post-transplant.
The paper is organised as follows: Section II shows a descrip-tion of the semi-supervised methodology used in this work; Section III thoroughly explains the constructed dataset and the experiments to be performed; Section IV presents and analyses the results of the above-mentioned experiments; in Section V, a simulation of the proposal is performed; and finally, Section VI outlines some conclusions and future work.
2. Methodology
The recently coined term weak supervision (Hern´andez-Gonz´alez et al., 2016) refers to those machine learning prob-lems where the labelling information is not as accessible as in the fully-supervised problem (where, in the case of classifica-tion, a label is associated to each pattern). Semi-supervised learning (i.e. learning from both labelled and unlabelled ob-servations) is an example that has been the focus of many ma-chine learning researchers in the past years. This is because, in many real-world applications, obtaining labelled patterns can be a challenging task, while unlabelled examples might be available with little or no cost. The main idea behind semi-supervised learning is to take advantage from unlabelled data when constructing a classifier. These learning approaches have been empirically and theoretically studied in the literature and represent a suitable solution for such circumstances. Semi-supervised learning has being studied mainly for binary clas-sification (Cai et al., 2007; Cohen et al., 2004) and regression
(Zhu, 2005). This paper tackles the use of semi-supervised data for constructing a donor-recipient matching in liver transplan-tation, where the data distribution is highly imbalanced.
This section establishes the terminology and notation that will be used throughout the entire work, as well as the classifi-cation methodologies considered. The goal in classificlassifi-cation is to assign an input vectorxto a discrete labely=Ck, wherek∈ {1, . . . ,K}. All the experiments in this paper cover the binary classification case, where k ∈ {+,−}, “−” representing graft failure and “+” a successful transplant. A formal framework for the semi-supervised learning problem could be introduced by considering a set ofllabelled pointsL=(x1,y1), . . . ,(xl,yl) anduunlabelled pointsU =xl+1, . . . ,xl+u, where the labels in
Lare known and the ones inUare unknown. Typically,lu. Letn=l+ube the total number of data points.
In the next subsections, we describe different proposals for exploiting unsupervised information when predicting transplant failure. Firstly, two strategies for generating unsupervised data are introduced (which in most applications would be not nec-essary, given that unsupervised data would be already avail-able). Although our study is focused on liver transplantation, the scheme for generating unsupervised information (using vir-tual pairs) can be applicable to other types of transplants, or even applications where the aim is to compute the long-term compatibility of two or more individual and separate entities (e.g. when trying to compute the response that a patient will have to different treatments, where the first entity would be the information of the patient and the second one the characteris-tics of the treatment). Then, two approaches are considered to exploit this unsupervised data: 1) the most common one where available unlabelled patterns are included in the classifier con-struction step, and 2) a new proposal where the aim is to la-bel unlala-belled patterns and complement the dataset with the data that belong to the minority class. Note that this second approach can be used in any semi-supervised and imbalanced environment to label minority class patterns and create a fully supervised dataset. All the methods take into account the im-balance nature of the dataset, where the number of failures is considerably lower than the number of successful transplants.
2.1. Strategies to capture unsupervised data
Two sources of unsupervised data are used in this paper. The former considers available transplants with an unknown out-come. The latter exploits transplants which have not been per-formed (i.e. what is called virtual donor-recipient pairs). The main hypothesis of this paper is that both sources of informa-tion help to improve the performance of standard supervised algorithms and lead to more robust models for imbalanced data (specially in the case of virtual pairs, where the number of unla-belled data would be much higher than for recent transplants). Finally, we also propose to exploit the severity information of the donors (for more details see Section 2.1.3) to obtain virtual pairs that better represent the minority class (taking therefore advantage of expert knowledge).
2.1.1. Recent transplants
Unsupervised data correspond in this case to those match-ings whose follow-up time post-transplant is not completed, because the outcome is costly in terms of time (i.e. we could exploit those transplants before including them as supervised knowledge, since we do not know the output of the trans-plant). Note also that it is generally easier to gather informa-tion about past transplants (donor and recipient characteristics) than to gather information about the post-transplant follow-up, because follow-up information differs from country to country, while donor and recipient information is stored similarly in all countries. Nonetheless, the number of transplants for which the outcome is still unknown is generally low. Therefore, the idea would be to combine this approach with other of the methods tested in this paper.
2.1.2. Virtual donor-recipient pairs
Apart from the traditional semi-supervised approach, where unlabelled data is usually available, we consider that there are other applications where semi-supervised knowledge can be ex-tracted from what we denominate as “potential” or “virtual” patterns. These patterns represent potential situations that have not occurred. In this case, unsupervised data makes use of non-real transplants (based however, on non-real individuals). This is, we take into account potential organ transplantations that could have occurred in the past (but have not). To do so, if a given donor Di was originally assigned to recipientRi we consider all the patterns (or potential transplantations) joining Di and {R1, . . . ,Ri−1,Ri+1, . . . ,Rl}. Note that this idea is applicable to other fields in which each pattern is composed of a set of indi-vidual units.
In other words, unlabelled dataUis extracted from different donor-recipient combinations from L. For example, consider the situation in which the transplant unit had to evaluate two recipients R1 andR2 for a given donorD1. For some reason, the unit transplant decided thatR1was more suitable for the or-gan (and this was the pair registered in the dataset). However, there exists a potential allocation (D1,R2), which was not per-formed and for which we cannot possibly know the outcome of the procedure. This potential assignment can be used to com-plement the model in a semi-supervised manner (since it is not totally synthetic, but based on individual and real-world enti-ties). Summarising, the unlabelled set of data is formed of vir-tual patterns, which we obtain by rotating donors and recipients. For the ease of understanding, see Figure 2, where this idea is represented. The original matchings are used as supervised knowledge and the synthetic or virtual ones as unsupervised data to complement the dataset. Our hypothesis is that this in-formation would not only help to improve the general perfor-mance of the base supervised classifier, but also the classifica-tion of minority classes, whose low representability results in a low classification rate (sometimes leading to a trivial classifier). Note that the number of generated unsupervised pairs depends on the number of labelled ones (if lis the number of labelled patterns, we would havel·(l−1) unlabelled pairs). This makes necessary the use of large-scale and linear algorithms or meth-ods for pattern selection. In our opinion, the inclusion of these
virtual pairs should not introduce noise into the model, given that they represent an allocation that could have taken place (all of their values being real). These virtual allocations were not performed by the transplant team. This could be because, ac-cording to the different scores or their medical expertise they were not appropriate (meaning that they could have resulted in graft loss). However, they could have been very helpful to bet-ter represent the minority class, improving its separation.
Figure 2: Graphical representation of the matching performed: original matches (obtained from the dataset) and virtual ones (generated rotating donors and re-cipients). Two main ideas are explored: whether donor-recipient compatibility can be predicted by machine learning and whether semi-supervised learning can help to improve this compatibility model.
We have compared three versions of this idea. The first one uses only 10% of the possible virtual pairs as unsupervised knowledge, the second one uses 50% of the data, while the last one uses all the data (100%). This comparison intends to anal-yse the influence of the quantity of unsupervised information in the classifier performance.
2.1.3. Use of extended donors
The previous section is based on the idea that virtual semi-supervised learning could contribute not only to the global cor-rect classification rate but also to the discrimination of minority classes. However, it is clear that the discrimination of these minority classes would improve depending on the quality and quantity of unlabelled patterns that hypothetically belong to those classes. Because of this, we also propose the use of expert knowledge (in this case in the form of extended donors) as part of all virtual unlabelled patterns. Extended donors present at least two characteristics that are considered of risk and usually lead to a higher probability of graft failure. These characteris-tics are: extreme values of age, high number of days in the in-tensive care unit or ICU, inotropic drug usage, high body mass index or BMI and high cold ischemia time. Thus, in this case, the number of generated virtual patterns would be much lower (as we only use the combination of extended donors with the rest of recipients), but, theoretically, the ratio of patterns from the non-survival class would be higher. Large scale methods are also preferred, given that the number of virtual patterns would also significant.
This experiment analyses the influence of the ratio of patterns belonging to the minority class with respect to the majority one in a semi-supervised and highly imbalanced classification prob-lem.
2.2. Approaches to incorporate unsupervised data
The unsupervised data generated with the strategies in Sec-tion 2.1 are now considered during the classifier construcSec-tion to obtain more reliable models. Two different approaches are used for this purpose.
2.2.1. Standard semi-supervised method
First of all, we consider the common semi-supervised learn-ing settlearn-ing, where unsupervised data are incorporated into the learning process, without assuming labels for these data. As it is common in this paradigm, and given the large-scale nature of the experiments performed, a light reformulation of Sup-port Vector Machines (SVMs), which is specially designed for large-scale semi-supervised learning, has been chosen (Sind-hwani and Keerthi, 2006) for all the experiments. The reason for this is that SVMs have been tested to a great extent in the case of semi-supervised learning and that the large number of data generated by our proposals makes impossible the applica-tion of any method that has not been specifically designed for large-scale problems. Note that large scale learning is often re-alistic only in a semi-supervised setting where a small set of labelled examples is available together with a large collection of unlabelled data. Because of this, in many applications, linear classifiers are preferred, given their easy implementation and interpretability and their empirical performance.
Some details are now given about the SVM version consid-ered (Sindhwani et al., 2006; Sindhwani and Keerthi, 2006). An intuitive approach for using unlabelled data is to treat unknown labels as additional optimisation variables. For margin-based loss functions, this can be done by attempting to learn low-density separators. However, this results in a hard optimisation problem when unlabelled data is abundant (transductive SVMs have been used for this purpose, although they are susceptible to local minima). Because of this, a previously proposed global optimisation framework is considered, which handles these is-sues. Deterministic annealing is used to simplify the problem which is parametrically deformed to the original hard formu-lation and where the minimisers are smoothly tracked (Sind-hwani et al., 2006). This method has been also successfully reformulated for large-scale and sparse scenarios (Sindhwani and Keerthi, 2006).
For appropriate comparisons, in the experiments of this pa-per, we compare this semi-supervised and linear SVM approach (which we will refer as SS-LSVC) with the original supervised and linear version of SVM.
2.2.2. Label propagation for minority-class over-sampling
Label propagation is one of the most widely used methods in semi-supervised applications (Zhou et al., 2004). Labels are propagated from the labelled patterns to the unlabelled ones making use of a neighbourhood graph. Note that, this approach
presents three advantages: 1) a semi-supervised classification strategy is not needed, since the main idea is that the labelled set is augmented using unlabelled data, 2) non-linear classifi-cation methods can be used (as the number of training patterns does not grow to such an extent) and 3) this technique is appli-cable to all imbalanced semi-supervised scenarios in which we can label data for the minority class and include it as supervised knowledge.
Usually, a label propagation method present two problems in an application like the one considered. Firstly, when the class distribution is skewed, propagated labels would perpetuate this imbalance. Secondly, since the label propagation step involves an iterative process (or matrix operations including an inver-sion), its cost can be very high when a large number of pat-terns is available. These two issues make the application of the original label propagation scheme impossible. To solve this, we propose a two-step technique, that first selects potential pat-terns for the minority class using a neighbourhood analysis and afterwards applies the label propagation scheme. By doing this, we solve the high computational cost and minimize the bias to-wards the majority class (i.e. we select those patterns with the highest probability of belonging to the minority class).
We propose a new method based on label propagation. The strategy involves two steps, in order to alleviate the computa-tional cost of the procedure and to ensure that selected patterns are from the minority class:
1. Selection of potential patterns for the minority class:
Given the high computational cost of the label propaga-tion method when a large number of patterns is available, the well-knownk-nearest neighbour (k-nn) method is cho-sen for performing a pre-selection of the patterns. In this sense, the patterns inL (set of labelled data) are used to classify the patterns inU (set of unlabelled data) using a
k-nn approach, and those classified as minority class ones are selected for the next step of the procedure (represented byP). This step facilitates the computation of the label propagation method.
2. Label propagation step: The method in (Zhou et al., 2004)
is used to propagate the labels of labelled patterns L to the pre-selected unlabelled onesP. From this step, a ma-trix containing the probability that each pattern has of be-longing to each class is obtained. The patterns inPwith the highest probability of belonging to the minority class are chosen and included as supervised data in the minority class (i.e. included in the setL as new labelled data). In this case, the final number of patterns chosen is the one needed to balance the pattern distribution.
This method can be seen as a similar approach to over-sampling and sample selection techniques, since new data are obtained and labelled by studying the neighbourhood of super-vised data, which is common in both settings. In this case, in-stead of generating new synthetic data from a combination of patterns, we select those unlabelled patterns with a high prob-ability of belonging to the minority class (or we under-sample potential data from the majority class). The most widely used over-sampling approach has been included in the experiments
for comparison purposes. Linear and non-linear SVM methods are tested, in this case, using the new augmented labelled set.
3. Experimental study and results
In this section, the experiments are described and the results are discussed. A complete description of the liver transplanta-tion dataset is firstly given, followed by a presentatransplanta-tion of the relation of the methods to be compared, the measures evaluated and the experimental design. Finally, two different experiments are conducted to analyse the goodness of the proposed semi-supervised approaches. The first experiment considers the ap-plication of semi-supervised learning using recent transplants as unsupervised information. The second experiment considers the use of virtual donor-recipient pairs, where new unlabelled data are generated, mixing donor and recipient pairs and creat-ing new matches not present in the original dataset.
3.1. Dataset description
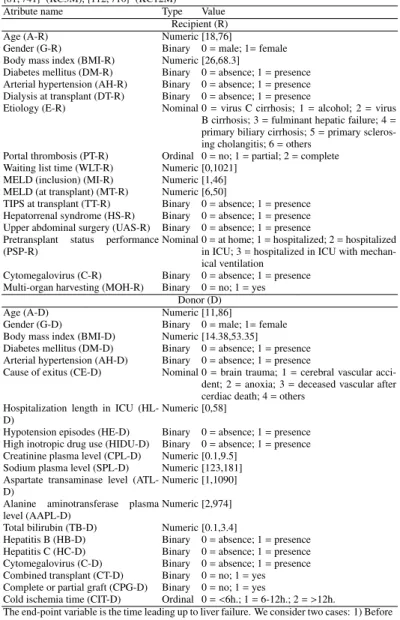
A retrospective analysis of an English liver transplant unit (King’s College Hospital, in the United Kingdom) was made. Recipient and donor characteristics were reported at the time of transplant. Patients undergoing partial, split or living-donor liver transplantation and those undergoing combined or multi-visceral transplants were excluded from the study. All patients were followed from the date of transplant until either death, or graft loss prior to one year after transplantation. Only those pairs with recipients over eighteen years of age between Jan-uary 2002 and December 2010 were included. Thus, a dataset containing 822 donor-recipient pairs was collected. Several variables were selected: 16 recipient variables, 17 donor vari-ables and 4 surgically related varivari-ables (which, for convenience, will be included in the donor and recipient groups depending on their meaning). The variables selected for the dataset can be seen in Table 1.
Every procedure, including obtaining informed consent, was conducted in accordance with the ethical standards of the local Human Research Ethics Committee and in accordance with the ethical standards of the 1975 Declaration of Helsinki.
Note that 3 of the transplant variables were included in the donor set of characteristics (combined transplant, complete or partial graft and cold ischemia time) because they are related to and depend primarily on the donor. The same applies to the multi-organ harvesting variable, which is included in the recip-ient set of features.
For our study, we consider two datasets (each one represent-ing a different period of time to control graft failure). More specifically, we consider graft failure before 3 months (KC3M dataset) and before 12 months (KC12M). The choice of class limits for the dataset (3 and 12 months) has been made by ex-perts as the most pertinent (being these considered for previous studies in Cruz-Ram´ırez et al. (2012); Brice˜no et al. (2014); P´erez-Ortiz et al. (2014)).
Note that, even under the case that the model derived would be successful, it would not be universal, but rather a
demonstra-Table 1: Principal characteristics of the dataset: features considered, number of patterns and classes, etc.
Number of patterns: 822, number of classes: 2, number of features: 37, class distribution:
{81,741} (KC3M),{112,710} (KC12M)
Atribute name Type Value
Recipient (R)
Age (A-R) Numeric [18,76]
Gender (G-R) Binary 0=male; 1=female Body mass index (BMI-R) Numeric [26,68.3]
Diabetes mellitus (DM-R) Binary 0=absence; 1=presence Arterial hypertension (AH-R) Binary 0=absence; 1=presence Dialysis at transplant (DT-R) Binary 0=absence; 1=presence
Etiology (E-R) Nominal 0=virus C cirrhosis; 1=alcohol; 2=virus B cirrhosis; 3=fulminant hepatic failure; 4= primary biliary cirrhosis; 5=primary scleros-ing cholangitis; 6=others
Portal thrombosis (PT-R) Ordinal 0=no; 1=partial; 2=complete Waiting list time (WLT-R) Numeric [0,1021]
MELD (inclusion) (MI-R) Numeric [1,46] MELD (at transplant) (MT-R) Numeric [6,50]
TIPS at transplant (TT-R) Binary 0=absence; 1=presence Hepatorrenal syndrome (HS-R) Binary 0=absence; 1=presence Upper abdominal surgery (UAS-R) Binary 0=absence; 1=presence Pretransplant status performance
(PSP-R)
Nominal 0=at home; 1=hospitalized; 2=hospitalized in ICU; 3=hospitalized in ICU with mechan-ical ventilation
Cytomegalovirus (C-R) Binary 0=absence; 1=presence Multi-organ harvesting (MOH-R) Binary 0=no; 1=yes
Donor (D)
Age (A-D) Numeric [11,86]
Gender (G-D) Binary 0=male; 1=female Body mass index (BMI-D) Numeric [14.38,53.35]
Diabetes mellitus (DM-D) Binary 0=absence; 1=presence Arterial hypertension (AH-D) Binary 0=absence; 1=presence
Cause of exitus (CE-D) Nominal 0=brain trauma; 1=cerebral vascular acci-dent; 2=anoxia; 3=deceased vascular after cerdiac death; 4=others
Hospitalization length in ICU (HL-D)
Numeric [0,58]
Hypotension episodes (HE-D) Binary 0=absence; 1=presence High inotropic drug use (HIDU-D) Binary 0=absence; 1=presence Creatinine plasma level (CPL-D) Numeric [0.1,9.5]
Sodium plasma level (SPL-D) Numeric [123,181] Aspartate transaminase level
(ATL-D)
Numeric [1,1090] Alanine aminotransferase plasma
level (AAPL-D)
Numeric [2,974] Total bilirubin (TB-D) Numeric [0.1,3.4]
Hepatitis B (HB-D) Binary 0=absence; 1=presence Hepatitis C (HC-D) Binary 0=absence; 1=presence Cytomegalovirus (C-D) Binary 0=absence; 1=presence Combined transplant (CT-D) Binary 0=no; 1=yes Complete or partial graft (CPG-D) Binary 0=no; 1=yes
Cold ischemia time (CIT-D) Ordinal 0=<6h.; 1=6-12h.; 2=>12h.
The end-point variable is the time leading up to liver failure. We consider two cases: 1) Before and after 3 months (dataset KC3M) and 2) before and after 12 months (dataset KC12M).
All nominal and ordinal variables are transformed into binary ones.
tion that machine learning techniques can be used to derive a donor-recipient matching model1.
3.2. Methods compared
Different methods have been compared for this study, some of them specially indicated for imbalanced classification. On the one hand, the following supervised methods are used, based only on the original supervised information:
1The next issue being how to create a supranational model or how to train
• SVC and LSVC: Non-linear and linear versions of the well-known Support Vector Classifier (SVC) (Cortes and Vapnik, 1995; Chang and Lin, 2011).
• CS-SVC and CS-LSVC: Non-linear and linear versions of the cost-sensitive SVC (Chang and Lin, 2011), where dif-ferent class-weights are used for imbalanced classification (i.e. a higher cost is set for minority classes based on the imbalance ratio). In this way, the weights are set accord-ing to the ratio of minority class patterns with respect to the majority class ones.
• SVC+SMOTE and LSVC+SMOTE: Non linear and linear versions of SVC combined with a standard over-sampling approach (Chawla et al., 2002), which is one of the most popular techniques for approaching imbalanced classifica-tion. The number of synthetic patterns to be generated is that needed to balance the class distribution.
• MPENSGA2-E and MPENSGA2-MS: Neural network
models obtained from the Pareto front built by a multi-objective evolutionary algorithm (MPENSGA2). The first model is the extreme corresponding to maximum entropy (obtaining optimal values in Accuracy), while the second model is the extreme corresponding to maximum mini-mum sensitivity. Both models are used in Cruz-Ram´ırez et al. (2012) as a decision support system for donor-recipient matching in liver transplantation, in such a way that the probability of belonging to the survival class is maximised and the probability of belonging to the non-survival class is minimised.
On the other hand, the following semi-supervised methods are used, based on both the original supervised data and unsu-pervised sources of information:
• SS-LSVC: Semi-supervised linear version of SVC (pre-sented in Section 2.2.1) using unsupervised patterns. For the first experiment, unsupervised patterns come from un-labelled data (as explained in Section 2.1.1, typically, be-cause the transplant is very recent, and the outcome is yet unknown), while, for the second experiment, the unsu-pervised data is synthetically generated as virtual donor-recipient pairs (as explained in Section 2.1.2).
• SS-LSVC-Ext: Semi-supervised linear version of SVC us-ing only extended donors for the computation of the syn-thetic unsupervised data (see Section 2.1.3). As stated be-fore, these donors present a series of characteristics that are considered of risk and usually lead to a higher prob-ability of graft failure, which makes it interesting for im-proving the classification of the minority class. Extended criteria donors are those that present at least two of the fol-lowing restrictions: age>75 years; hospitalisation length in ICU>4 days; high inotropic drug use=1; BMI>30; Cold Ischemia Time=2 (>12 hours).
• SVC-LP and LSVC-LP: Non-linear and linear versions of SVC using the label propagation strategy for labelling un-supervised synthetic patterns and use them as un-supervised
ones (Section 2.2.2). More specifically, the label from su-pervised patterns is propagated to unsusu-pervised patterns. Then, those examples with a higher probability of belong-ing to the minority class are chosen and labelled (with the label of the minority class). After the pattern selection pro-cess, the standard SVC strategy is considered, but, in this case, the class distribution is balanced. Note that, from all possible unsupervised virtual pairs, as many patterns as needed to balance the distribution are labelled.
3.3. Evaluation metrics
Several metrics can be considered for evaluating classifiers. The most common one in machine learning is the Accuracy (Acc) or correct classification rate. However, this measure is not the best option for some classification scenarios (e.g. in the presence of class imbalance). Because of this, we comple-ment accuracy (Acc) with the geometric mean of the sensitivi-ties (GM), which is specially designed for imbalanced classifi-cation (L´opez et al., 2013). The metrics used can be defined as follows:
• Acc: The correct classification rate or accuracy is the ratio of correctly classified patterns:
Acc= 1 N N X i=1 (I(y∗i =yi)),
whereI(·) is the zero-one loss function,yi is the desired output for patterni,y∗
i is the prediction of the model, and
N is the total number of patterns in the dataset. Acc val-ues vary from 0 to 1, and it represents the global perfor-mance in the classification task. This metric has many dis-advantages, specially when imbalanced problems are con-sidered.
• GM: The geometric mean of the sensitivities is an average of the percentage of the correct classification of each of the classes: GM=K v u t K Y k=1 Sk,
whereSk= Nk1 PNki=1(I(y∗i =yi)) is the sensitivity of thek-th class, i.e. the percentage of patterns correctly predicted as belonging to thek-th class with respect to the total number of examples in this class. For all the datasets considered in this paper, we haveK =2, i.e. two classes, graft survival and failure.
The joint use of theAccandGMmetrics is difficult, because
Accis usually opposite to any metric designed for imbalanced learning (Fern´andez-Caballero et al., 2010; Soda, 2011). De-tecting the minority class often comes at the expense of a de-crease in global accuracy, which is the price to pay for a non-trivial classifier. The combination of both metrics helps then to detect trivial classifiers (i.e. where the same label is pre-dicted for all inputs) and supports the individual classification rate of both classes, as well as the global accuracy. A balance
between these two metrics means that 1) the classifier is accu-rate on the whole and 2) it distinguishes successfully between the classes of the problem. If we exclusively focus on the mi-nority class, we could introduce other type of error (the one where a safe transplant is classified as problematic). Because of this, we consider the use of theGMmetric, that takes all the classes in the problem into account, aiming at a good result on the whole. However, this error is still possible, and because of this, the allocation system should take into account other fac-tors, e.g. that no recipient remains indefinitely in the waiting list.
3.4. Experiment configuration
For the evaluation of the results, a stratified 10-fold technique has been applied to divide the data. The results are taken as the mean and standard deviation of the two metrics for the 10 test sets.
The parameters of each algorithm were chosen using a 5-fold nested validation with each of the 10 training sets. Al-though GM seems to be the most appropiate metric for this problem, both options were considered. In this way, the final parameter combination was the one resulting in the highestAcc
or GM in the validation set (as can be checked in Table 3), so that the importance of considering theGM in this applica-tion can be analysed. The kernel selected for all the non-linear kernel methods is the Gaussian one, K(x,y) = exp
−kx−σy2k2
, where σis the kernel width. The kernel width was selected within the values{10−3,10−2, . . . ,103}, as was the cost param-eter C associated to all supervised SVM methods (linear and non-linear versions). The kparameter associated to thek-nn (for SVC+SMOTE, LSVC+SMOTE, SVC-LP and LSVC-LP) was also cross-validated in the range{1,3,5}. For all the meth-ods using large-scale semi-supervised SVMs Sindhwani and Keerthi (2006), the regularisation parameterswanduwere op-timised within the values{10−4,10−3,10−2,10−1,100}.
The same parameter configuration as in Cruz-Ram´ırez et al. (2012) has been used for the multi-objective evolutionary meth-ods MPENSGA2-E and MPENSGA2-MS.
3.5. Experimental results
Finally, the experiments are presented and discussed in this section. Statistical tests are performed to determine the signifi-cance of the differences observed.
3.5.1. First experiment
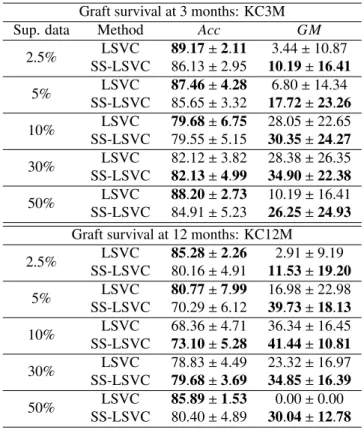
In order to check whether real unlabelled data (coming from, for example, recent transplants) can be beneficial for model construction, the first experiment considers the labels of a given percentage of training data, using the rest as unsupervised in-formation. The results are included in Table 2, where the effect of the amount of supervised information is studied. Both su-pervised and semi-susu-pervised approaches are compared using a linear model (LSVC and SS-LSVC). The percentage of super-vised data varies from 2.5% to 50%. The first method (LSVC) is the linear version of SVM using the specified percentage of supervised patterns. The second method (SS-LSVC) is also a linear version of the semi-supervised approach of SVM and
Table 2: Results of the first experiment: Mean±Standard deviation results obtained (AccandGMfor the test sets) for LSVC and SS-LSVC.
Graft survival at 3 months: KC3M
Sup. data Method Acc GM
2.5% LSVC 89.17±2.11 3.44±10.87 SS-LSVC 86.13±2.95 10.19±16.41 5% LSVC 87.46±4.28 6.80±14.34 SS-LSVC 85.65±3.32 17.72±23.26 10% LSVC 79.68±6.75 28.05±22.65 SS-LSVC 79.55±5.15 30.35±24.27 30% LSVC 82.12±3.82 28.38±26.35 SS-LSVC 82.13±4.99 34.90±22.38 50% LSVC 88.20±2.73 10.19±16.41 SS-LSVC 84.91±5.23 26.25±24.93 Graft survival at 12 months: KC12M
2.5% LSVC 85.28±2.26 2.91±9.19 SS-LSVC 80.16±4.91 11.53±19.20 5% LSVC 80.77±7.99 16.98±22.98 SS-LSVC 70.29±6.12 39.73±18.13 10% LSVC 68.36±4.71 36.34±16.45 SS-LSVC 73.10±5.28 41.44±10.81 30% LSVC 78.83±4.49 23.32±16.97 SS-LSVC 79.68±3.69 34.85±16.39 50% LSVC 85.89±1.53 0.00±0.00 SS-LSVC 80.40±4.89 30.04±12.78 The best result is inboldface.
uses the remaining data as unsupervised information to com-plement the learning.
As can be seen in Table 2 even when very few labelled pat-terns are used (e.g. consider the case of 10% of supervised data), the semi-supervised methodology obtains better results in terms ofGM, aiming at a more balanced classification. More-over, it generally maintains a relatively competitiveAcc. These results highlight the importance of using all available infor-mation about transplants even when the label is unknown, i.e. when the follow-up time post-transplant has not been com-pleted. The variances are, in general, very high, which is a common case when using theGM metric, because of its defi-nition. One of the conclusions that can be extracted from this is that the quantity of unlabelled patterns is not as important as the quality of those (which also justifies the high variance of the results and the difference between the percentages).
3.5.2. Second experiment
The second experiment complements the available super-vised information with the construction of virtual pairs. In this case, the number of unlabelled patterns to include in the model for SS-LSVC is set to 10%, 50% and 100% of all possible pairs2, in order to analyse the effect of this number in the per-2Note that the number of virtual pairs isl·(l−1) (i.e. in this case using the
formance of the method. The results of all the methods for this experiment are included in Table 3. From these results, some conclusions can be drawn, but in order to do so, the imbalanced nature of the dataset must be taken into account (i.e. the need to correctly classify the minority class). It is well-known thatAcc
presents some problems when dealing with imbalanced data, thus theGMmetric (or a balance between both of them) should be the priority.
From the results of this second experiment (Table 3), it can be seen that the models with the highest accuracy are trivial mod-els (i.e., they ignore the classification of the minority class, i.e.
GM =0%). As seen, this metric is also essential in the cross-validation process, leading to more fair models. As stated be-fore, to represent successfully the good performance of a classi-fier, we need, in this case, a balance betweenAccandGM. Note that two classifiers could have the same value onGM but very differentAcc, and the sameAccbut differentGM.GMdoes not take the number of patterns that compose each class into ac-count, whereasAccdoes. For example, we could have a classi-fier that classifies correctly a 75% of the minority class and only 15% of the majority one. In this case, these measures would be approximatelyGM =33.5% andAcc=20%. However, if we switch the class percentages, we would haveGM=33.5% and
Acc=69%. Different errors are committed in each case. How-ever, in abscence of specific costs for the problem considered in this paper, we set the same costs for each type of errors: 1) type I error, where a safe transplant is said to be problematic, and 2) type II error, where a problematic transplant is predicted to be safe. Both cases could be said to be equally important, be-cause a type I error may result in deaths in the waiting list, while type II errors may end with graft loss. It can be seen that using this measure, the non-linear SVC model is capable of achieving more balanced classifiers (reaching results ofGM of 11% and 13% for KC3M and KC12M respectively). Nonetheless, the linear version (LSVC) does not distinguish both classes suc-cessfully.
Concerning cost-sensitive approaches (SVC and CS-LSVC), these models show a better performance in the mi-nority class, at the cost, however, of sacrificing Acc (obtain-ing in some cases results of Accaround or lower than 50%, a result similar to that of a random classifier). The models based on over-sampling (SVC+SMOTE and LSVC+SMOTE) present better performance in general, which is consistent with the find-ings of the literature (Galar et al., 2012), where it is shown that over-sampling is generally preferred to non sampling strategies. However, again, the linear version does not present satisfactory results.
Comparing semi-supervised approaches to supervised ones, one can observe that the virtual simulation of patterns is a help-ful tool for stabilizing the model and for the correct classifica-tion of the minority class. A reason for this could be that this technique generates more incompatible donor-recipient pairs that would not be considered in real life when using the MELD score or the knowledge of the medical community, and this helps the classification of the minority class (in a similar man-ner to over-sampling).
Moreover, the use of additional data (even when it is
unsuper-vised) simplifies the classification task and alleviates the imbal-ance problem (which, as seen in previous works, does not only depends on the imbalance ratio but also on the number of pat-terns, Barandela et al. (2004); Japkowicz and Stephen (2002b)). Therefore, it could be said that the use of this virtual informa-tion (without any restricinforma-tion, i.e. the methods SS-LSVC-10%, SS-LSVC-50% and SS-LSVC-100%) results generally in more robust and accurate models, at both KC3M and KC12M.
The number of semi-supervised data (i.e. SS-LSVC-10%, SS-LSVC-50% and SS-LSVC-100%) is a significant parame-ter, leading to different results in each case. In particular, it seems that the choices of the patterns to be included are in some cases more important than the number of patterns itself (at least to improve the classification of the minority class), al-though a more stable solution is obtained when using all data (a better trade-offbetweenAcc andGM). Recall that the semi-supervised models used in this case are all linear (given the large amount of unsupervised patterns used). However, these models obtain better results that other non-linear models that only consider labelled data. Concerning the results of spe-cially designed methods for imbalanced learning (i.e. CS-SVC and SVC+SMOTE and their variants), these do not obtain a good balance between the two metrics, at opposed to our semi-supervised approaches. It can be inferred then that the used of virtual pairs (composed of real individual entities) is preferable than synthetic over-sampling.
The use of extended donors for generating the synthetic semi-supervised pairs (SS-LSVC-Ext method) also improves the sta-bility of the final model (achieving promising balance between the two metrics). This could mean that the ratio of unlabelled data from each class is also a determining factor when ap-proaching a problem with semi-supervised learning. In this case, the ratio could be more equitable, given the use of ex-tended donors, which have been linked in the literature to a higher probability of graft failure. Our last approaches (SVC-LP and LSVC-(SVC-LP) make use of a label propagation technique for obtaining a new set of supervised data (only for the mi-nority class) to complement the dataset. These methodologies obtain the models that could be consider as the best ones for this application. In this case, linear models obtain very similar performance to non-linear ones, which shows that the inclusion of semi-supervised information and unlabelled data can help to simplify the decision boundaries.
Finally, we compare our results to MPENSGA2-E and MPENSGA2-MS (Cruz-Ram´ırez et al., 2012), which are the ones previously used in the literature for solving the same prob-lem of donor-recipient matching. Two acceptable models are obtained for both methods, the former focusing on global accu-racy and the latter on the accuaccu-racy for all classes, which could be then jointly used as a decision support system. Comparing, for example, LSVC-LP and MPENSGA2-MS, it can be appre-ciated that a better trade-offcan be expected from our semi-supervised approach (i.e. better results in terms ofAccfor sim-ilarGM), even when the models are linear (such as LSVC-LP). This has to be taken into account together with the fact that our algorithms are simpler and can be applied to a wide range of semi-supervised and supervised algorithms.
Table 3: Results of the second experiment: Mean±Standard deviation re-sults obtained (AccandGMfor the test sets) for the different methodologies considered. The effect of the cross-validation metric used for optimising the parameters is also studied (C. Metric).
Graft survival at 3 months: KC3M
Method C. Metric Acc GM
SVC Acc 90.15±0.35 0.00±0.00 SVC GM 82.72±2.22 11.57±14.93 LSVC Acc 90.15±0.35 0.00±0.00 LSVC GM 90.15±0.35 0.00±0.00 CS-SVC Acc 86.38±0.44 0.00±0.00 CS-SVC GM 68.36±4.54 36.99±18.36 CS-LSVC Acc 30.63±28.61 19.56±18.38 CS-LSVC GM 48.43±11.65 49.57±8.19 SVC+SMOTE GM 81.63±3.00 34.83±28.88 LSVC+SMOTE GM 55.38±22.21 40.77±19.78 MPENSGA2-E - 89.29±1.76 7.02±14.81 MPENSGA2-MS - 59.26±6.65 47.79±20.86 Semi-supervised approaches SS-LSVC-10% GM 79.07±4.73 40.33±24.52 SS-LSVC-50% GM 69.59±5.92 52.41±16.88 SS-LSVC-100% GM 80.53±4.06 41.02±25.09 SS-LSVC-Ext GM 80.05±3.73 47.85±21.77 SVC-LP GM 76.16±3.02 50.35±15.04 LSVC-LP GM 78.47±2.90 49.99±21.26 Best Model LSVC-LP GM 76.83 76.01 Graft survival at 12 months: KC12M
Method C. Metric Acc GM
SVC Acc 86.25±0.53 0.00±0.00 SVC GM 86.99±2.28 13.65±17.64 LSVC Acc 86.38±0.44 0.00±0.00 LSVC GM 86.38±0.44 0.00±0.00 CS-SVC Acc 90.15±0.35 0.00±0.00 CS-SVC GM 56.82±6.88 55.09±9.10 CS-LSVC Acc 47.73±33.63 18.70±19.00 CS-LSVC GM 51.48±18.18 43.76±18.86 SVC+SMOTE GM 77.85±3.07 30.73±23.40 LSVC+SMOTE GM 51.73±14.00 48.28±11.66 MPENSGA2-E - 85.16±1.47 5.81±12.27 MPENSGA2-MS - 59.38±7.39 50.57±10.88 Semi-supervised approaches SS-LSVC-10% GM 68.02±6.87 45.94±13.57 SS-LSVC-50% GM 76.28±5.07 40.84±8.55 SS-LSVC-100% GM 77.49±4.50 39.52±7.96 SS-LSVC-Ext GM 77.00±4.30 44.59±12.39 SVC-LP GM 71.29±2.30 52.74±11.80 LSVC-LP GM 69.58±3.16 49.12±11.18 Best Model LSVC-LP GM 75.90 63.36 The best result is inboldface and the second best result is initalics.
Note that the best models for LSVC-LP have been also in-cluded in Table 3, both showing outstanding results. Since these models are linear, the weights can be used for interpretability purposes and will be later studied.
Now, we study whether the differences found in both ex-periments are significant. Each pair of algorithms has been compared by means of the non-parametric and signed-rank Wilcoxon test (Wilcoxon, 1945), using the 10 results of the 10-fold design. A popular way to compare the overall perfor-mances of algorithms is to count the number of cases on which an algorithm is the overall winner. Using this test, each pair of methods was compared for each dataset (KC3M and KC12M) and the total number of statistically significant wins or losses
was recorded, together with the number of draws (or absence of statistically significant differences). For the first experiment, the number of of wins, draws and losses is 10: we compare five versions of the dataset (2.5%, 5%, 10%, 30% and 50%) with two different configurations for the target variable (KC3M and KC12M). For the second experiment, 34 comparisons are in-cluded (2 configurations for the target variable and 17 methods to compare each method against). A level of significance of
α=0.10 has been considered. The results of these tests forAcc
andGMare shown in Table 4, where the number of wins (W), draws (D) and loses (L) is shown.
In relation to the first experiment, the best results inGMare obtained by the semi-supervised approach, while the supervised method shows improvements inAcc. However, these good re-sults inAccare obtained at the cost of performing trivial classi-fications in some cases, as shown in Table 2.
For the second experiment, semi-supervised approaches are the ones which obtain the best balance between wins in Acc
and wins inGM (e.g. analyse the results of SS-LSVC-100%, SS-LSVC-Ext and SVC-LP). Supervised standard SVM ap-proaches (e.g. SVC and LSVC) obtain the best results in term of Acc but the worst results for GM, which shows again the difficulty in optimising both metrics at the same time without specific methods. Cost-sensitive and over-sampling based tech-niques seem to perform better (specially in the case of CS-SVC and CS-LSVC cross-validated byGM). However, their number of wins forAccis still relatively low in comparison to the semi-supervised methods. A great difference can be observed be-tween cost-sensitive and over-sampling based approaches when cross-validated by the two metrics, which shows the need of properly tuning the parameters for the methods used. In re-lation with MPENSGA2-based methods, MPENSGA2-E does not obtain acceptable results in terms ofGM, as opposed to MPENSGA2-MS (which obtains comparable results inGMto our proposals SVC-LP and LSVC-LP, but with worse results for
Acc). Concerning the quantity of unlabelled data, it can be seen that more data results in a more robust model, without explic-itly harming any of the selected metrics. Finally, it can be seen that both linear and non-linear models based on label propaga-tion (i.e. SVC-LP and LSVC-LP) obtain similar performance in statistical terms, so that we can conclude that unlabelled data complements perfectly the supervised data and leads to more easily separable decision regions.
In general, the following ideas can be extracted from our ex-periments: 1) The quantity of unsupervised patterns is crucial, but the quality of those is also of vital importance. In the case of an imbalanced distribution, expert knowledge can make the difference. 2) When the set of data is large, non-linear methods do not show a great improvement over linear ones. 3) Virtual pairs (based on real data) help to improve the performance of machine learning methods in the detection of minority exam-ples to a greater extent than totally synthetic information. 4) Labelling unsupervised data to augment the proportion of su-pervised patterns is a simple and suitable strategy that shows very promising results, helping to achieve a trade-offbetween both metrics.
predict-Table 4: Wilcoxon statistical test results (W or wins, D or draws and L or loses) for the different experiments considered. Both datasets (KC3M and KC12M) are considered for these results.
Metric Acc GM Method C. Metric W/D/L W/D/L First experiment LSVC GM 5/4/1 0/7/3 SS-LSVC GM 1/4/5 3/7/0 Second experiment SVC Acc 27/6/1 0/10/24 SVC GM 24/0/10 0/12/22 LSVC Acc 27/6/1 0/10/24 LSVC GM 31/3/0 0/10/24 CS-SVC Acc 27/6/1 0/10/24 CS-SVC GM 4/3/27 19/11/4 CS-LSVC Acc 0/9/25 9/6/19 CS-LSVC GM 1/5/28 16/17/1 SVC+SMOTE GM 17/5/12 12/14/8 LSVC+SMOTE GM 1/6/27 15/17/2 MPENSGA2-E - 26/3/5 0/11/23 MPENSGA2-MS - 3/4/27 18/16/0 SS-LSVC-10% GM 11/5/18 14/17/3 SS-LSVC-50% GM 12/6/16 16/14/4 SS-LSVC-100% GM 15/7/12 15/15/4 SS-LSVC-Ext GM 15/6/13 16/17/1 SVC-LP GM 10/4/20 19/15/0 LSVC-LP GM 9/8/17 18/16/0
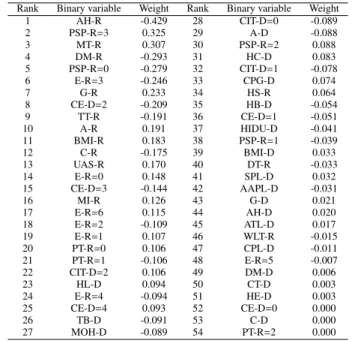
ing graft survival after transplantation we study the influence of each variable in the best model (using SVC-LP) in Table 3 at 3 months after transplantation (KC3M). The linear weights obtained are included in Table 5. Note that all the binary vari-ables are included in this case (54 varivari-ables that are the result of decomposing the original 37 ones). The variables have been ranked considering the absolute value of their weights. Note that the variables can have a positive or negative impact on the output (where the survival at 3 months represent the positive class). The bias of the model is -0.985. It can be seen that the most influential variables are mostly the ones related to the re-cipient, although there are some variables related to the donor that also have an impact on the model (thus justifying the need to use both sources of information). The most important vari-ables for the characterisation of the survival are: arterial hy-pertension (recipient), pretransplant status performance (ent), MELD (at transplant), diabetes mellitus (recipi(ent), recipi-ent etiology (virus), gender (recipirecipi-ent), cause of exitus of donor (anoxia), tips at transplant (recipient) and other factors such as age and body mass index (recipient). This shows that although the MELD variable has an influence in our model (being an im-portant factor) there are other variables with greater or similar impact. These findings are consistent with the results reported in literature where the age is an important factor contributing to the donor risk index. Similarly, prolonged ICU hospitalization is a strong predictor of early graft dysfunction and poor initial functioning that increased post-transplant hospital costs.
4. Discussion and proposed system for organ allocation Donor-recipient (D-R) matching is performed at the moment of organ procurement. However, since MELD does not con-sider donor characteristics, the organ is assigned to the patient listed first on the list of the most ill, a strategy that cannot be truly considered as a matching. Therefore, using MELD a
con-Table 5: Best model weights per variable (graft survival prediction at 3 months).
Rank Binary variable Weight Rank Binary variable Weight
1 AH-R -0.429 28 CIT-D=0 -0.089 2 PSP-R=3 0.325 29 A-D -0.088 3 MT-R 0.307 30 PSP-R=2 0.088 4 DM-R -0.293 31 HC-D 0.083 5 PSP-R=0 -0.279 32 CIT-D=1 -0.078 6 E-R=3 -0.246 33 CPG-D 0.074 7 G-R 0.233 34 HS-R 0.064 8 CE-D=2 -0.209 35 HB-D -0.054 9 TT-R -0.191 36 CE-D=1 -0.051 10 A-R 0.191 37 HIDU-D -0.041 11 BMI-R 0.183 38 PSP-R=1 -0.039 12 C-R -0.175 39 BMI-D 0.033 13 UAS-R 0.170 40 DT-R -0.033 14 E-R=0 0.148 41 SPL-D 0.032 15 CE-D=3 -0.144 42 AAPL-D -0.031 16 MI-R 0.126 43 G-D 0.021 17 E-R=6 0.115 44 AH-D 0.020 18 E-R=2 -0.109 45 ATL-D 0.017 19 E-R=1 0.107 46 WLT-R -0.015 20 PT-R=0 0.106 47 CPL-D -0.011 21 PT-R=1 -0.106 48 E-R=5 -0.007 22 CIT-D=2 0.106 49 DM-D 0.006 23 HL-D 0.094 50 CT-D 0.003 24 E-R=4 -0.094 51 HE-D 0.003 25 CE-D=4 0.093 52 CE-D=0 0.000 26 TB-D -0.091 53 C-D 0.000 27 MOH-D -0.089 54 PT-R=2 0.000
crete D-R combination does not necessarily result in the best combination in terms of utility. Because of this, and based on the best model obtained in the previous subsection, a novel liver allocation system is proposed. The first stage of the system is the selection of the firstk-recipients on the waiting list (i.e. the
ksickest patients, since patients on the waiting list are sorted according to the MELD score). In case of draws, the time spent on the waiting list is considered. After this, graft survival af-ter transplantation is predicted for thesekrecipients using the best model obtained in our experiments. Then, the organ is as-signed to the recipient whose predicted survival is the highest ( in this case, we only consider two classes, but the probability of belonging to the survival class could be considered for a finer grain discrimination). In case of draws between two or more recipients, the one with the highest MELD is selected. This new system complements the assignment of the MELD score, by taking into account donor and operative factors. Figure 3 un-derlines the general ideas of the proposed liver allocation sys-tem.
Input
Output Procedure
1. Initialise the number of patients to consider (k)
2. Sorted_List: Sort Waiting_List by MELD and waiting list time 3. Potential_recipients: Select first k recipients of Sorted_list
4. Survival_Response: Predict output for Potential_Recipients using Best_Model and Organ_Ch 5. Best_Recipients: Select recipients associated to the highest Survival_Response
6. MELD_List: Get MELD (from Waiting_List) for Best_Recipients
7. Final_Recipient: Select the patient from Best_Recipients with the highest MELD 1. Waiting_List: Characteristics of patients in waiting list
2. Organ_Ch: Characteristics of the organ to be allocated 3. Best_Model: Computed allocation model
1. Final_Recipient: Selected recipient for the organ allocation
A simulation of our proposed system (and of the two best models obtained in this paper) is included in Table 8 where the recipients listed in Table 6 and the donors in Table 7 are used. The result of each combination of pairs donor-recipient is evaluated with the best models and the output of the system is included in the Table (- if the matching belongs to the non-survival class and+otherwise). The number of times that each recipient and organ results in survival is also reported in the Ta-ble. Several conclusions can be extracted from these results. Firstly, it can be seen that both models (at 3 and 12 months) are robust and agree in the output of the transplant in most cases. Note that, the only incongruence that these two mod-els show is when the model at 3 months predict that the match will lead to graft failure but the model at 12 months predict that the match will be successful. This is because the rest of op-tions (e.g. that the model at 3 months predicts survival and the model at 12 months predicts non-survival) are viable options. Moreover, this incongruence only occurs in 6% of the matches. On the other hand, it can be seen that the MELD score is in some cases related to the output of the transplant, meaning this that recipients with a low MELD (as the situation 1 tested) have in general a satisfactory post-transplant output and potential in-compatibilities (i.e. the probability of graft failure) increases with the MELD range (e.g. compare the number of graft loses for recipients with MELD< 20 and MELD> 30). This fact motivates the use of an allocation system that predicts match compatibilities, which is vital to maximize the organ utility. As can be seen, our model will agree with the MELD score in the vast majority of situations, however, it will also help the medi-cal community to detect situations in which the allocation is not secure.
Concerning extended donors, the one that represents the most secure approach is D1 (resulting in graft loss only 2 times). It can be seen that this donor, compared to the rest, presents a low age and a normal BMI, it does not present diabetes mellitus, arterial hypertension or hepatitis and the cold ischemia time is medium. On the other hand, D3 is the one that results in non-survival more times. This donor presents diabetes mellitus, ar-terial hypertension, cytomegalovirus and a high cold ischemia time. Furthermore, comparing D2 and D4 it can be seen that D2 results in predicted survival more times than D4 (despite the age of the donors). D4 is only 26 years old but has a relatively low BMI and diabetes mellitus. This donor was also 7 days in the intensive care unit and the organ has a high cold ischemia time. In relation to non-extended donors, the one that present the highest survival rate are D7 and D8 (which have very low cold ischemia time and do not present diabetes, arterial hyper-tension or cytomegalovirus, variables that have been shown to be discriminative in the model interpretation phase). The one that has the lowest failing rate is D10.
Concerning the recipients, there are many of them that have a high survival rate. However, the one which could be most in-teresting is R13, which has a 100% survival rate but belongs to the group of recipients with MELD>30. The main difference with the rest of recipients of the group is the etiology, the lack of diabetes mellitus, cytomegalovirus, hepatorrenal syndrome and the pretransplant state (at home against at ICU with mechanical
ventilation).
Table 6: Characteristics of the recipients selected from the dataset used to test the allocation system.
Rec. A G BMI DM AH DT E PT WLT MI MT TT HS UAS PSP C MOH
R1 69 1 40.06 1 1 0 6 1 357 11 18 0 0 1 0 1 0 R2 51 0 29.86 1 0 0 0 0 48 15 15 0 0 0 0 1 0 R3 71 0 30.52 0 0 0 5 0 18 12 12 0 0 0 1 1 0 R4 18 1 38.10 0 0 0 6 0 344 6 8 0 0 0 0 0 1 R5 42 0 32.65 0 0 0 0 0 628 4 6 0 0 0 0 0 1 R6 37 1 35.43 0 0 0 3 0 3 25 29 0 0 0 3 1 0 R7 57 1 40.06 0 1 1 6 0 768 24 26 0 0 0 0 1 0 R8 27 0 37.18 0 0 0 6 0 84 25 24 0 0 1 0 1 0 R9 47 0 33.03 0 1 0 6 1 34 23 23 1 0 1 0 1 0 R10 50 1 47.56 1 0 0 4 1 477 13 22 0 0 0 0 1 0 R11 34 0 27.70 0 0 0 3 0 5 43 50 0 0 0 3 1 0 R12 39 1 32.65 1 0 0 3 1 1 34 40 0 0 0 3 1 0 R13 37 0 37.18 0 0 0 0 0 70 35 36 1 0 0 0 0 1 R14 22 1 44.44 0 0 0 3 0 1 30 33 0 0 0 3 0 1 R15 66 0 31.92 1 1 0 5 0 270 27 31 0 1 0 0 1 0 R16 19 1 34.60 0 0 0 3 0 2 25 27 0 0 0 3 0 1 R17 57 1 44.44 0 0 0 4 0 10 28 27 0 1 0 0 0 0 R18 68 0 31.92 0 0 0 6 0 297 8 27 0 0 0 0 1 0 R19 64 0 38.10 0 1 0 6 0 413 27 27 0 0 0 0 1 1 R20 46 0 30.86 1 0 0 3 0 3 24 27 0 0 0 3 1 0
Abbreviations: A: age; G: gender; BMI: body mass index; DM: diabetes mellitus; AH: arterial hypertension; DT: dialysis at transplant; E: etiology; PT: portal thrombosis; WLT: waiting list time; MI: MELD score at listing; MT: MELD score at transplant; TT: TIPS at transplant; HS: hepatorrenal syndrome; UAS: upper abdominal surgery; PSP: status
performance pretransplant; C: cytomegalovirus; MOH: Multi-organ harvesting.
Note that at the moment of the implementation of this allo-cation system more conservative factors can be introduced. For example, the probability of graft survival can be computed (e.g. in SVM using the distance of the projected pattern to the bias) and used for the system considering a statistical test that gives us information about significant differences in the probabilities. By doing this, the organ would be assigned to the recipient with the highest probability of survival (given that the difference in probability with respect to the rest of recipients is significantly higher). If this is not the case, the MELD score should be con-sidered. On the other hand, a constraint can be included in the system so that no recipient remains forever in the waiting list. To do so, a formulation that considers the number of times that the recipient was selected in thek first recipients but not se-lected (i.e. the times where the recipient was considerably ill but not allocated an organ) can be implemented. Finally, as a clinical test of our proposal is not feasible, we propose to anal-yse firstly our methodology in a more controlled environment comparing the choices of MELD and our system.
5. Conclusions
This paper studies different sources of unsupervised informa-tion to improve the performance of binary classificainforma-tion mod-els for the problem of liver transplantation outcome prediction. The two sources identified are those transplants whose follow-up process has not been completed and virtual transplants com-bining donor and recipients which were not matched during the allocation. Unsupervised data are introduced in the learning process by considering two methods: standard semi-supervised