UCLA Previously Published Works
Title
Enhancing knowledge discovery from cancer genomics data with Galaxy.
Permalink
https://escholarship.org/uc/item/7zc188q3
Journal
GigaScience, 6(5)
ISSN
2047-217X
Authors
Albuquerque, Marco A
Grande, Bruno M
Ritch, Elie J
et al.
Publication Date
2017-05-01
DOI
10.1093/gigascience/gix015
Peer reviewed
eScholarship.org
Powered by the California Digital Library
doi: 10.1093/gigascience/gix015
Advance Access Publication Date: 9 March 2017 Tech Note
TE C H N O T E
Enhancing knowledge discovery from cancer
genomics data with Galaxy
Marco A. Albuquerque
1
, Bruno M. Grande
1
, Elie J. Ritch
1
,
Prasath Pararajalingam
1
, Selin Jessa
1
, Martin Krzywinski
2
,
Jasleen K. Grewal
1
, Sohrab P. Shah
3
, Paul C. Boutros
4
and Ryan D. Morin
1
,
2
,
∗
1Department of Molecular Biology and Biochemistry, Simon Fraser University, Burnaby, BC, Canada,
2Canada’s
Michael Smith Genome Sciences Center, BC Cancer Agency, Vancouver, BC, Canada,
3Department of
Pathology, University of British Columbia, Vancouver, BC, Canada and
4Ontario Institute for Cancer Research,
Toronto, ON, Canada
∗Correspondence address. Tel: (778) 782-9581; Fax: (778) 782-5583; E-mail:[email protected]
Abstract
The field of cancer genomics has demonstrated the power of massively parallel sequencing techniques to inform on the genes and specific alterations that drive tumor onset and progression. Although large comprehensive sequence data sets continue to be made increasingly available, data analysis remains an ongoing challenge, particularly for laboratories lacking dedicated resources and bioinformatics expertise. To address this, we have produced a collection of Galaxy tools that represent many popular algorithms for detecting somatic genetic alterations from cancer genome and exome data. We developed new methods for parallelization of these tools within Galaxy to accelerate runtime and have demonstrated their usability and summarized their runtimes on multiple cloud service providers. Some tools represent extensions or
refinement of existing toolkits to yield visualizations suited to cohort-wide cancer genomic analysis. For example, we present Oncocircos and Oncoprintplus, which generate data-rich summaries of exome-derived somatic mutation. Workflows that integrate these to achieve data integration and visualizations are demonstrated on a cohort of 96 diffuse large B-cell lymphomas and enabled the discovery of multiple candidate lymphoma-related genes. Our toolkit is available from our GitHub repository as Galaxy tool and dependency definitions and has been deployed using virtualization on multiple platforms including Docker.
Keywords:Lymphoma; Driver; Cancer; Genome; Pipeline; Workflow; Tool; Cloud
Introduction
An inherent problem in the application of genomics to under-stand the molecular aetiology of cancer is the multi-disciplinary skillset required for researchers to draw meaningful inferences from high-throughput biological data. With the rise in
popu-larity of high-throughput DNA sequencing, the bottleneck for novel discovery has shifted from data generation to data analy-sis and interpretation. Although myriad algorithms have been developed to efficiently analyze large datasets, these are of-ten tailored for technically inclined users. Software for these
Received:4 December 2016;Revised:21 February 2017;Accepted:6 March 2017 C
The Author 2017. Published by Oxford University Press. This is an Open Access article distributed under the terms of the Creative Commons Attribution License (http://creativecommons.org/licenses/by/4.0/), which permits unrestricted reuse, distribution, and reproduction in any medium, provided the original work is properly cited.
analyses is typically run at the command line; operation re-quires the use of cryptic parameters; and installation is often burdensome. Achieving a flow of data between tools is also of-ten nontrivial and, owing to a paucity of data standards, can in-volve error-prone data manipulation and reformatting steps of-ten relying on a collection of custom scripts that are ofof-ten not released with publications. Combined with a necessity for high-performance computational hardware to run many such tools efficiently, these issues produce a tremendous barrier for new users.
There exist a handful of options that address this predica-ment in genomics as a whole. Tools that automate pipeline de-velopment such as Kronos [1], Nextflow [2], and Snakemake [3] can satisfy the needs of more technically savvy users. Al-ternatively, graphical user interfaces (GUIs)—which are gener-ally lacking in the field of bioinformatics—aid in users learning the utility of the associated with command-line interfaces but typically do not scale to large data sets. Examples of genomics tools offering web-accessible GUIs includeBLAST[4],VAGUE[5], andlimmaGUI[6]. However, beyond an inability to scale, web-based utilities pose several issues, including design inconsis-tency, redundant efforts in interface development, and the in-ability to automatically link individual tasks into pipelines or workflows. Ideally, any reduction in the barriers associated with running individual algorithms passing data between software tools should accelerate analytical tasks and reduce the risk of errors.
To overcome this, GUI-enabled software for automating pipeline development improves the reproducibility, accessi-bility, and transparency of running genomic analyses [7]. Examples include Galaxy [8], Taverna [9], Pegasus [10], and commercial software packages such as Geneious [11]. In par-ticular, the Galaxy project offers many attractive features for this goal while remaining open-source. Namely, Galaxy boasts extensive documentation, support for automatic tool instal-lation, and the ability to instantiate public or private “cloud clusters” by leveraging CloudMan [12] and is as a whole sup-ported by a vibrant community that provides ongoing develop-ment to the software and dedication to increasing the avail-ability of bioinformatics software. Although algorithms for han-dling high-throughput sequence data are steadily being added to Galaxy, there currently remains a lack of tools and work-flows tailored to perform common tasks involved in analyzing cancer genome and exome sequence data. Here, we have be-gun to address this issue by adapting many of the popular tools for analyzing cancer genome and exome data for Galaxy and made these publicly available as the Galaxy Cancer Genomics Toolkit.
Diffuse large B-cell lymphoma (DLBCL) is a common ag-gressive non-Hodgkin lymphoma that demonstrates extensive genetic heterogeneity with some genetic features found more common in only one of the two molecular subgroups, namely the ABC and GCB subgroups. Primary mediastinal B-cell lym-phoma is defined as a separate entity by the World Health Organization with distinct clinical and diagnostic features but shares some genetic features with DLBCL and other lymphomas. Herein, we demonstrate the utility of the Galaxy Cancer Ge-nomics Toolkit by applying the included workflows to a large cohort of DLBCL patients (n=96) and through a combination of analytical and exploratory approaches leveraging multiple vi-sualization tools implemented within the Toolkit, we uncover new candidate lymphoma-related genes and putative genetic features associated with each molecular subgroup.
Implementing cancer genomics
tools in Galaxy
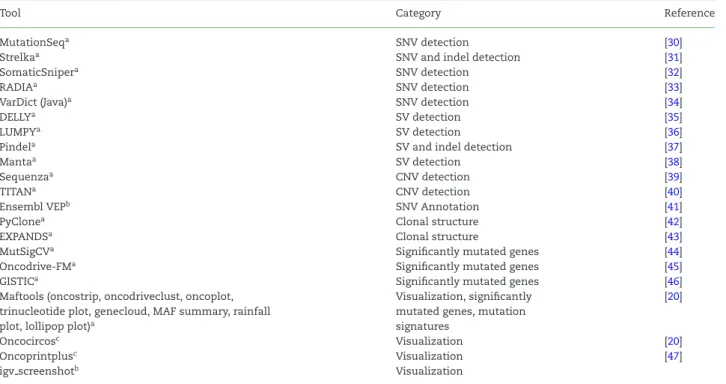
We produced a comprehensive toolkit comprising a suite of complementary tools and workflows that perform many of the routine analytical tasks in cancer genomics. These include sev-eral popular methods for detecting (“calling”) somatic single nu-cleotide variants (SNVs), copy number variations (CNVs) and structural variations (SVs) in tumor-normal pairs. We devel-oped additional tools to perform the many auxiliary steps helper functions that allow tools to be linked and applied generically, such as bam and text file pre- and postprocessing, manipu-lating, and converting file formats; variant annotation; identi-fication of significantly mutated genes; and visualizations for performing exploratory analysis and cohort-level data summa-rization. The tools and helper functions are briefly detailed in Table1and Table S1, respectively, and documented in our repository.
To integrate individual tools into Galaxy, we implemented XML-based configuration files, which dictate the available inputs and arguments and build the command based on user-specified parameters. We adhered to a consistent design across tools of similar types. Planemo, an integrated development environment for Galaxy tools, was used to assist with tool creation and ensure tool versions in a Github repository and Galaxy Toolshed were in sync [13]. All repositories are available on the public Galaxy test toolshed (https://testtoolshed.g2.bx.psu.edu/), which allows users to automatically install any tool [14]. Modular tool depen-dency repositories provide the step-by-step instructions for au-tomatic download and installation of dependencies. Previously defined repositories were recycled if available. Though we could not successfully produce tools that automatically install on all platforms, many of our tools successfully install (with depen-dencies) on the standard Galaxy Amazon Web Services (AWS) image and in a custom Ubuntu installation (v16.04). We also note that the Galaxy community is migrating towards utiliz-ing Conda for package management, which should ameliorate many of these issues moving forward. Synthetic alignment data containing artificial variants were generated and bundled with variant callers to enable automatic testing [15]. To handle ref-erence data, we have developed tools to use Galaxy data tables and, for simplicity, allow the option of user-provided reference data [16].
Support within Galaxy for processing large data sets is still being established and one remaining restriction has been the lack of methods for splitting and parallelizing large analyses. We invested substantial effort to ensure that tools that perform analyses suitable for input-splitting are parallelizable on cluster environments wherever it was deemed desirable and possible. Following the addition of new data types in the Galaxy codebase, this was subsequently reimplemented using the more transpar-ent and efficitranspar-ent method that exploits the more rectranspar-ent Galaxy feature known as “data collections.” Briefly, parallelization of a workflow is accomplished by a combination of tasks (Fig.1), beginning withfetch_interval. This obtains chromosome size information from each input read alignment file and creates a collection of BED files defining all complete chromosome inter-vals available to each tool. To balance the load across all con-currently spawned jobs, we automatically pair large and small chromosomes if their sum is less than or equal to the length of the largest chromosome and we avoid splitting chromosomes into smaller intervals. This mimics the assumed longest last-ing step for these algorithms while limitlast-ing the number of
Table 1:Main tools currently comprising the cancer genomics toolkit
Tool Category Reference
MutationSeqa SNV detection [30]
Strelkaa SNV and indel detection [31]
SomaticSnipera SNV detection [32]
RADIAa SNV detection [33]
VarDict (Java)a SNV detection [34]
DELLYa SV detection [35]
LUMPYa SV detection [36]
Pindela SV and indel detection [37]
Mantaa SV detection [38]
Sequenzaa CNV detection [39]
TITANa CNV detection [40]
Ensembl VEPb SNV Annotation [41]
PyClonea Clonal structure [42]
EXPANDSa Clonal structure [43]
MutSigCVa Significantly mutated genes [44]
Oncodrive-FMa Significantly mutated genes [45]
GISTICa Significantly mutated genes [46]
Maftools (oncostrip, oncodriveclust, oncoplot, Visualization, significantly [20] trinucleotide plot, genecloud, MAF summary, rainfall mutated genes, mutation
plot, lollipop plot)a signatures
Oncocircosc Visualization [20]
Oncoprintplusc Visualization [47]
igv screenshotb Visualization
Tools representing existing or extended analysis approaches are shown above. For a current list of tools available, refer to the repository. aNew implementation of tool for existing software.
bExisting Galaxy tool modified or extended for this project. cNew tool or visualization method created for this project.
Figure 1:Parallelization in variant calling and other CPU-intensive processes. An alignment file flows through tofetch interval, which fetches all contigs. If paral-lelization is requested, multiple files are generated for each interval, some of which may contain multiple intervals, otherwise a single file is created. Each dataset in the collection is treated as separate input to two instance ofpreprocess, which filters reads from both normal and tumor alignment files. These then pass to the variant caller. Apostprocesstool filters and annotates variant calls based on tool-specific parameters and all final variants are merged and sorted in a single variant file. We perform automatic interval pairing to roughly balance the load on each variant-calling task. The algorithm combines regions (e.g., chromosomes) if their total length is less than the largest. In cloud-based settings, this reduces overhead associated with creating multiple unnecessary parallelized jobs as well as reducing the number of short-lived automatically added nodes. Importantly, we chose not to implement a subchromosomal interval selection algorithm to maintain intrachromosomal dependence required by some of the variant calling algorithms. Such an extension could be implemented for tools that lack this restriction.
unnecessary concurrent jobs. The second, optional stage, is a
preprocesstool that defines all necessary preprocessing steps in a single tool and all will be executed together to reduce the numerous outputs associated with running multiple sep-arate preprocessing tools in Galaxy. This includes asamtools
flag and mapping quality filter,samtoolsremove duplicates, and
bamutils clipoverlap. The third stage launches the selected tool on each of the intervals, allowing Galaxy to spawn pro-cesses to available CPUs. The fourth stage ispostprocess, which follows similar methodology topreprocess. Example usage in-cludes further variant filtration and annotation steps. Finally all output files are merged, if necessary, so they may be supplied
to subsequent tools and workflows. For tools that can be multi-threaded, we instead leverage this capability rather than chro-mosomal splitting and note that certain tools, for example struc-tural variant callers, cannot be generally parallelized by input splitting.
The Galaxy toolkit has been thoroughly tested on multiple hardware configurations. Many of the analyses and workflows shown in detail here were performed on a local Galaxy instance on a Dell PowerEdge R430 Server with 2x Intel Xeon Proces-sors (32 threads total) and 384 Gb of RAM running Ubuntu linux, whereas benchmarking was performed separately on a Galaxy cluster on AWS Elastic Cloud Compute (Methods). For
computationally demanding tasks, we launched a Galaxy instance on AWS Elastic Cloud Compute using CloudMan and installed the workflow and tool dependencies. A cluster consisting of one r3.8xlarge master node and five r3.2xlarge worker nodes was selected. From our experience, we advise using any nodes from the r3 family when running several jobs concurrently (cohort) as NFS issues may arise when using purpose nodes. If a few samples are to be run, general-purpose nodes are recommended. Separately, we produced a Dockerfile that will install our tools and additional dependencies using the galaxy-stable Docker image (https://hub.docker.com/r/ bgruening/galaxy-stable/∼/dockerfile/). This is available in our GitHub repository, which also hosts the individual tools (https:// github.com/morinlab/tools-morinlab). This Docker image was successfully built with automatic installation of tools and de-pendencies on our local Linux server and on the Google Cloud. We are working with this service to release an instance with reference genomes preinstalled that can be directly launched with minimal knowledge of Docker.
Selecting high-value tools and developing
workflows for routine analytical tasks
There are numerous algorithms available to perform standard analytical tasks such as variant calling and CNV detection, each offering different balances of usability, computational efficiency, and accuracy. As such, selection of ideal tools and parameters is nontrivial. We implemented tools representing some of the more commonly cited options and include many that performed favorably in ICGC-The Cancer Genome Atlas (TCGA) DREAM challenges [17]. As each tool can be configured with a number of parameters, which can be tuned for accuracy, we leverage results from the DREAM challenge to assist in selecting the more accu-rate algorithms and in setting sensible default parameters [18]. As ensemble approaches tend to provide increased robustness, we developed a tool to integrate variant calls from multiple algo-rithms using a simple voting scheme (Additional Items: Fig. S1). We have also released numerous workflows that run some of the more complicated pieces of software that rely on many depen-dencies and that perform some routine analytical and visualiza-tion tasks as detailed and illustrated with the real-world worked examples below. Example workflows that demonstrate our new approach to perform parallelization in Galaxy are also included (Fig.1and Additional items: Fig. S2).
Benchmarking parallelized workflows
running on Amazon Web Services
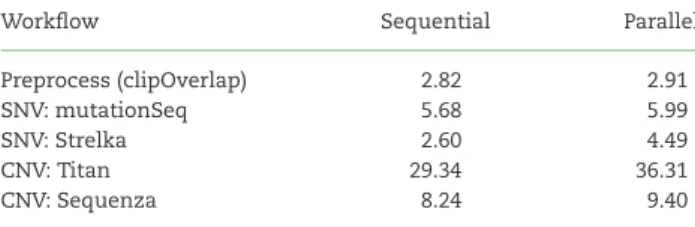
We uploaded 96 bam files representing the cohort of published DLBCL samples and ran all SNV and CNV workflows on this con-figuration for each tumor/normal pair and captured details on runtime and speedup associated with parallelization [19]. To as-sess the overhead potentially introduced when running tools in parallel, we ran the above cohort in both sequential and parallel modes across four different variant calling workflows. The run-time for each tool was collected from the local Galaxy database and summarized across the 48 pairs analyzed in the cloud. The average workflow runtime for an exome in parallel and sequen-tial modes is shown in Table2. The net change in estimated cost and speedup was averaged for each exome pair using the time taken to complete all stages of the workflow (Fig.2). In general, the overhead associated with preprocessing adds marginally to
Table 2:Average CPU usage in hours when applying variant calling workflows to exome pairs
Workflow Sequential Parallel
Preprocess (clipOverlap) 2.82 2.91
SNV: mutationSeq 5.68 5.99
SNV: Strelka 2.60 4.49
CNV: Titan 29.34 36.31
CNV: Sequenza 8.24 9.40
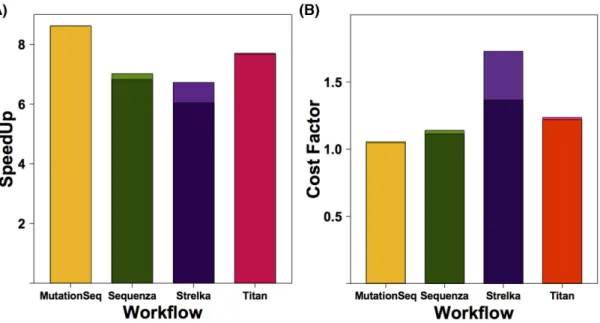
the cost and yielded gains in speed as high as 8.6x. By comparing the cost gain and speedup in Fig.2, it is evident that some tools, for example Strelka, do not benefit from this mode of paralleliza-tion and instead should be run using the native parallelizaparalleliza-tion on a node with more threads available. In the case of Strelka, there is a substantial preprocessing that occurs on each task to prepare the directory structure and configuration files, which is repeated several times using our parallelization method. Based on the current cost models, the approximate costs for running a single TN exome pair on all four workflows on AWS is $4.27 us-ing sequential and $5.15 usus-ing parallelization, not includus-ing the cost of uploading the files or storing these or the reference files.
Identifying novel candidate
lymphoma-related genes from exome data
An ultimate goal in cancer genome/exome analysis involves the identification of loci recurrently affected by copy number gain or loss and genes recurrently targeted by somatic mutations. There exist myriad tools to detect somatic SNVs and a growing number of options to derive high-quality copy number estimates from genome and exome data. We implemented workflows that per-form the required annotation and preprocessing of raw muta-tion and copy number outputs from tools such asStrelkaand
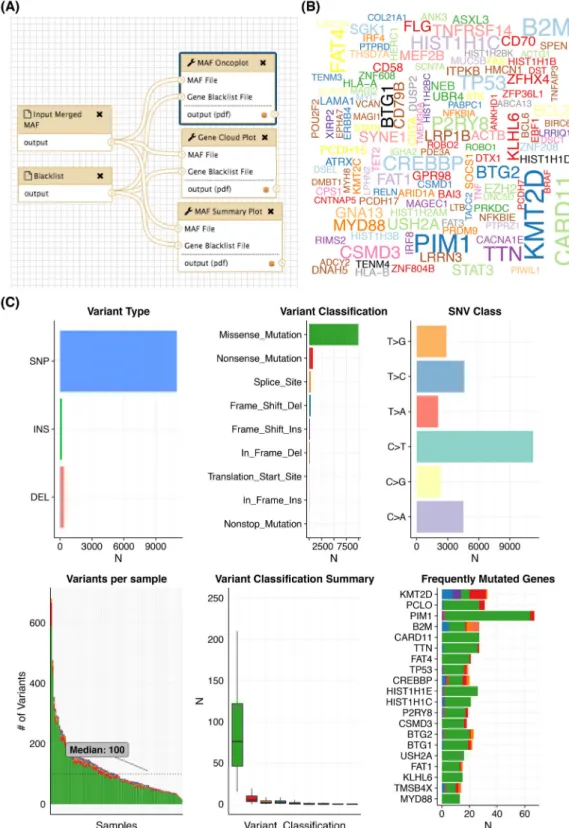
Sequenza, respectively. We ran these two workflows on 96 tu-mor/normal pairs representing DLBCL patients. The SNV and indel calls were annotated and converted to mutation annota-tion format (MAF) usingvcf2maf. A variety of convenient visu-alization methods are available in themaftoolsR package [20] and Fig.3shows the output of a workflow that employs some of these.
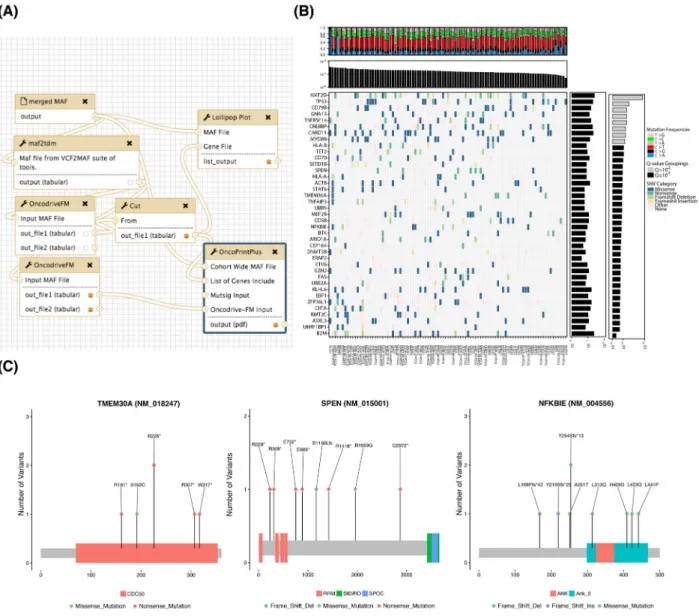
We next analyzed the pooled mutation calls from the meta-cohort for recurrently mutated genes usingOncodriveFM. Fig.4 shows the workflow that performs these tasks and produces var-ious visualizations of the resulting gene set. A batch tool built on
maftools[20] was used to generate protein-centric lollipop plots, which can facilitate visual recognition of patterns indicative of tumor suppressor genes and can also reveal mutation clustering and hot spots (e.g.,TMEM30AandNFKBIE).TMEM30Amutations have also been observed previously, although their role remains unclear [21], and based on these visualizations we note a pat-tern towards protein inactivation and a hot spot inNFKBIEthat induces a frameshift. The latter was recently observed in a sep-arate set of patients with relapsed DLBCL [22].SPEN, in contrast, has not been reported as recurrent target of somatic mutation in DLBCL but has been found mutated in other lymphoma types. The pattern of mutations suggests it may also act as a tumor suppressor gene in this cancer. We further notedTET2,SETD1B,
ARID1A, UBR5, DNMT3B, and BTKdemonstrate similar
muta-tion patterns (Fig.4B). Although these have been identified as relevant genes in other cancers [23,24], none of these have, to our knowledge, been previously ascribed to DLBCL.
Figure 2:Execution time and cost differences associated with parallelization. (A) The average reduction in execution time was determined for all exome pairs analyzed on AWS by comparing the runtime with and without parallelization and is shown as the speedup. The preprocessing involved in setting up parallel tasks results in a reduced speedup and depends on the tool. (B) The actual CPU usage and dedicated machine type used by parallel implementations of the tool is shown as an estimate of the cost. Idle instances were not considered in this calculation. The difference in speedup and cost when preprocessing, the optional bam filtering step, is considered is reflected in the upper region of each bar. Note, lighter shades show runtime statistics on workflows lacking any preprocessing step, limiting that steps ability to abstract poor performance.
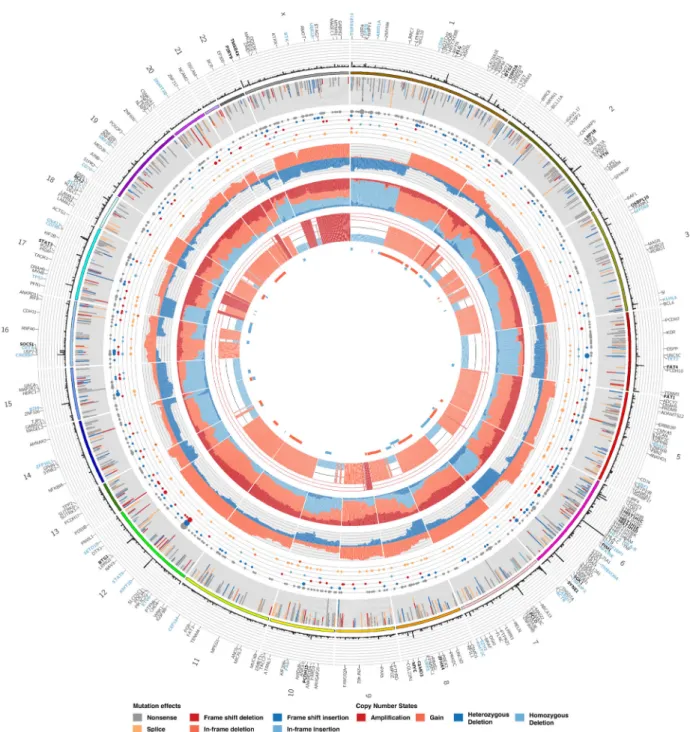
We next attempted to integrate exome-derived copy number information with mutation calls.Circosis a popular approach to generate visualizations of genome-wide mutation data, al-though it is generally better suited for genome-wide data and the representation of structural alterations and CNVs relative to genomic coordinates [25]. We extendedCircosto generate a gene-centric summarization of SNV and CNV data and produced theOncocircosGalaxy tool. Rather than plotting on a genomic coordinate scale, gene-level summaries of point mutations are mapped to their relative order on each chromosome and in-tergenic space (and genes with mutations below the threshold) are eliminated. To accomplish this, we implemented a parser that tabulates the data from MAF and segmented copy num-ber files, applying a threshold to restrict the display to genes with a greater number of mutations cohort-wide.Oncocircos
also accepts user-provided gene lists and regions of recurrent CNV (e.g. fromGISTIC) and highlights these in the resulting im-age (Additional Items: Fig. S3). Fig.6shows the result of a work-flow that runsGISTICon a merged set of segmented data (in this example, from theSequenzaworkflow) and integrates an-notated SNV and indel calls fromStrelka. In this visualization, several known DLBCL-associated recurrent events are observed including amplifications affectingREL,MYC, andBCL2, respec-tively, on 2p, 8q, and 18q. Recurrent deletions affecting the loci containing known tumor suppressor genes are also observable. A complementary visualization of these data is a gene by patient
Oncostripin which annotated copy number and point muta-tions can be represented (Fig.7and Additional Items: Fig. S4).
Enabling new insights into DLBCL biology
The combined workflows employed here leverage distinct as-pects of mutational information that can be individually lever-aged to identify candidate cancer drivers and further integrated to inform on disease biology. Using a combination of methods,
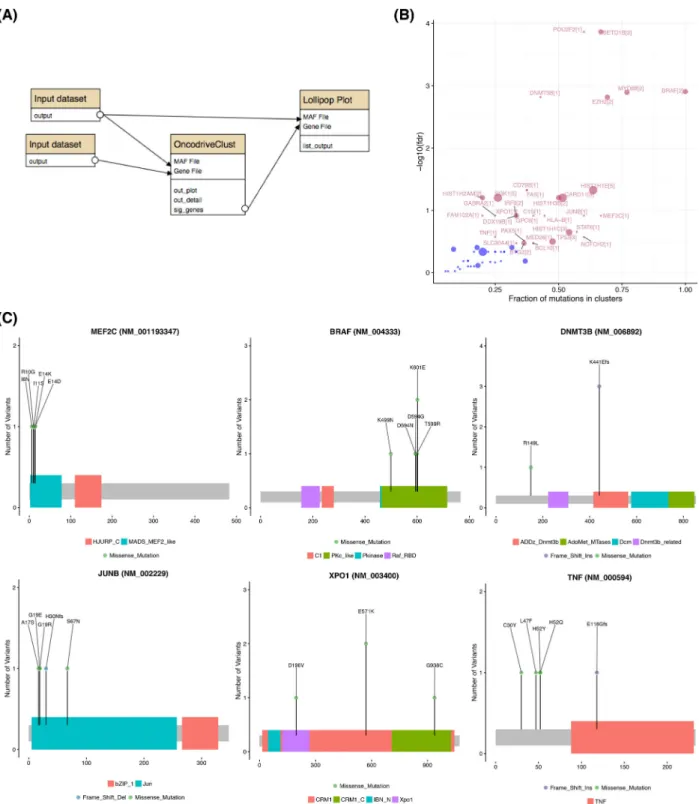
we provide additional evidence for the importance of several loci that have been attributed to DLBCL with weak support to date and those whose role as an oncogene or tumor suppressor has not been elucidated (Fig.5). By employingOncodriveClust, we identified genes with significant evidence for mutational recur-rence. Mutations around the V600E hot spot inBRAFand within
MEF2Chave previously been reported to be present, albeit rare, in DLBCL [19]. Another gene we found to harbor a hot spot was
STAT6, which, until recently, was thought to be mutated only in some less aggressive lymphomas such as FL and primary me-diastinal B-cell lymphoma (PMBCL) [17]. A hot spot mutation in
XPO1was also observed. This mutation has recently been sug-gested as a molecular marker of PMBCL distinguishes it from true DLBCLs [26]. One of the two cases bearing the canonical mutation (E571K) was among the few TCGA cases known to be PMBCLs and the other was from the second cohort for which clinical data was unavailable. These observations may further support the presence of mutations that will facilitate detection of PMBCL cases that can be difficult to distinguish from DLBCL by standard clinical criteria.
The integration of mutation with copy number data using our tools (Additional Items: Fig. S4) has further informed on the po-tential relevance of some candidate lymphoma-related genes.
TMEM30Ademonstrated a mutation pattern indicative of tumor
suppressor function (Fig.4C) and inspection of theOncocircos
image (Fig.6) suggests it resides within the commonly deleted region on 6q. Similarly,FAT1appears to have a strong signature towards inactivation and resides in a substantially smaller re-gion that is commonly lost. Such patterns can be more readily confirmed using a separate visualization tool, namelyOncostrip
(Additional Items: Figure S4). In contrast, some of the signifi-cantly amplified regions of the genome do not appear to harbor genes with significant evidence for recurrent mutations. Ampli-fications that includeJAK2are known to be relevant to PMBCL but are not typically considered a feature of DLBCL. Upon in-spection of the clinical data available for TCGA cases, we note
Figure 3:Producing cohort-wide summaries and visualizations. Following primary mutation detection across a large cohort and annotation (i.e., with VEP using
vcf2maf), it is useful to produce various summaries of the overall mutation burden and the types and classifications of mutations detected. ThemaftoolsR package
offers a multitude of visualizations, many of which we have adapted into Galaxy. (A) In this example workflow, a merged MAF file containing the variants for the entire cohort of DLBCLs is input alongside a black-list of genes to hide from the outputs. (B) This word cloud, generated by thegenecloudtool, provides a visually appealing summary of the frequency of mutations in genes above a user-specified threshold. (C) A genericmafsummaryplottool provided bymaftoolsgenerates six plots that represent descriptive features of the mutations and their annotations. It is evident that C>T is the predominant mutation type detected. A separate tool to perform refined mutation signature analysis is also available. Among the most commonly mutated genes are those previously attributed to DLBCL along withTTN, which encodes the largest human protein. With respect to the predicted effect, missense mutations are by far the dominant class of mutations. Despite this, tumor suppressors such asKMT2D,TP53, andB2Mshow an elevation of inactivating mutation classes.
Figure 4:Significance analysis for mutation recurrence. (A) Tools have been implemented to screen mutation data for patterns of recurrence and identify significantly mutated genes. Shown above is an example workflow that utilizes theOncodriveFMalgorithm and generates various visualizations for genes meeting a pre-specified Q-value cutoff. (B) A common approach to summarize mutation data is a two-dimensional matrix with covariates plotted along the side axes. We implemented a tool that leveragesmultiplotin our R package to generate such images for arbitrary gene lists using the outputs of variant calling workflows that have been annotated using thevcf2maftool. Mutations are colored based on the severity of mutations assigned automatically by the Ensembl Variant Effect Predictor (VEP) [48]. Genes with more severe mutations are more likely to be tumor suppressor genes (e.g.,B2Mat the bottom andTP53andKMT2Dat the top). Here, the total number of mutations detected in each patient is shown at the top and thePvalue reported byOncodriveFMis shown for each gene is shown on the right. The frequency of each of six possible mutation type can inform on mutational processes in individual samples. This is automatically determined from MAF files and is summarized at the top. (C) It is also often desirable to visualize the pattern of mutations within individual genes. The pattern is revealed using thelollipopplottool that is run on each gene passing the threshold in this workflow.
that each of the four PMBCLs in this cohort contain a mutation or deletion affecting FAT1 and a JAK2 amplification.POU2AF1, which resides on 11q23.1, is a candidate target for the amplifica-tion of this region despite a low number of nonsilent mutaamplifica-tions and has been reported as commonly amplified in treatment-refractory DLBCLs [27]. Further studies that include larger co-horts and possibly whole genome sequence data should help confirm the relevance of these observations.
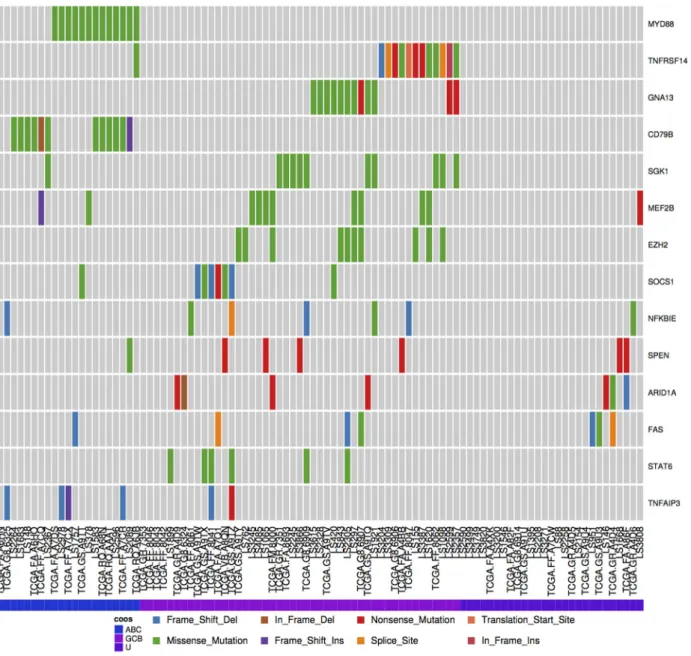
Many of the genes known to be relevant to DLBCL biology are more commonly mutated in only one of the two molecular sub-groups. Fig.7shows the mutation distribution across some of these genes in the meta-cohort analyzed here, which has been organized on the predicted subgroup of each patient. Using the
Oncostriptool to order patients on this designation uncovers
additional genes in which mutations may be more common in the GCB subgroup such asNFKBIE,ARID1A,FAS, andSTAT6 (Ad-ditional Items: Fig. S4).NFKBIEmutations have recently been re-ported to be particularly common among PMBCLs and a marker of poor prognosis in that disease [28]. One of theNFKBIE mu-tations detected herein was in a PMBCL case whereas the re-mainder were in nodal DLBCL cases and was almost exclusively seen in cases with other mutations suggestive of the GCB sub-group. This indicates a potential unappreciated role ofNFKBIE
in DLBCL, or, taken together with our observation of mutations inSTAT6andXPO1, may suggest that a significant subset of PM-BCL cases may masquerade as GCB DLPM-BCL. Further refinement of the mutation patterns of the two subgroups of DLBCL and PM-BCL using larger cohorts is clearly warranted.
Figure 5:Identifying genes containing clustered mutations and hot spots. With sufficiently large cohorts, the pattern of nonsilent mutations within the protein can inform on genes under specific selective pressure. A clear pattern seen in many dominantly acting cancer genes are mutation hot spots. TheOncodriveClustworkflow searches for genes with significant clustering of mutations that may represent hot spots or regions/sites whose mutation may produce a dominant effect. Application of this workflow (A) detected many lymphoma-related genes known to harbor mutation clusters (B). The workflow automatically generates lollipop plots for all genes above a user-specified FDR (in this example, 0.3) (C). Clear patterns of hot spots or mutation clusters are visible in each of these genes with onlyBRAFandMEF2C having been previously attributed to some DLBCLs [21].
Towards reproducible and distributable
workflows for cancer genome analysis
Large-scale efforts to understand the diversity of cancer-associated somatic alterations across common cancer types are
continually expanding in scope. Many such efforts release raw (or aligned) tumor and normal sequence data into controlled-access repositories such as Database of Genotypes and Phe-notypes and the European Genome-Phenome Archive. Owing to the many options and variations available in analytical
Figure 6:Visualization and data integration withOncocircos. The newOncocircostool allows visualization of segment data derived from the Titan andSequenza-based workflows we implemented. Genes exceeding a user-specified mutation frequency across the cohort are displayed and labels are automatically added for top genes. Those with at least twice the minimum mutation threshold are labeled in bold and those in an optional user-specified list can also be colored. A black-list file can be optionally provided to hide genes known to be enriched for artefacts. Stacked bar plots and circles provide summary of the annotated SNVs in each gene and a summary of the copy number state of each gene is provided in three inner tracks.
methods, the mutations and copy number results presented along with such data are not directly amenable to direct com-parisons between studies or pooled meta-analyses. Instead, the raw data must be obtained and processed uniformly alongside any new data sets. In light of the limited computational re-sources available to many research labs interested in incorpo-rating existing sequence data into their analyses, some con-senting processes and major data repositories are beginning to facilitate storage and processing of patient data using cloud resources.
Our Galaxy Cancer Genomics Toolkit provides a growing list of standard methods for cancer genomic analysis and facilitates their deployment in a simplified, reproducible, and accessible manner using Galaxy, which is amenable to deploying on stan-dalone servers or on a variety of cloud services. We have run our tools and workflows using AWS cloud computing (with Cloud-Man), which provides a cluster environment to any research lab and on Google Cloud, which facilitates cluster manage-ment of Docker-based instances using Kubernetes. We continue to provide new tools by extending functionality and releasing
Figure 7:Discerning mutation patterns and identifying subtype-associated genes. DLBCL cases were assigned to either the ABC or GCB molecular subgroups using the presence of mutations known to be significantly restricted to either. Cases with no mutations unique to either molecular subgroup were designated unclassifiable (U).
updates. We also note that many of our tools have been tested on whole genome sequence data and additional tools for perform-ing analytical tasks better suited to that data type have been implemented but were not described in detail here. To facilitate scaling of our applications to whole genome and exome data to the extent currently possible in this framework, and to accel-erate the analysis of exomes, we established new methods to accomplish parallelization in Galaxy. It is important to note that Galaxy is not particularly well suited to certain large-scale analy-ses due to how data transfer tasks are handled, the internaliza-tion of some processes (e.g., bam indexing) and centralizainternaliza-tion of intermediate files generated by tools. We hope that ongoing development of the Galaxy codebase will improve on these and suggest that command-line equivalents to our workflows such as those offered by the Kronos software are worthy of considera-tion in larger-scale projects. Ongoing development of the Galaxy application programming interface may also ameliorate some of these issues.
This toolkit and its ready-made workflows provide the meth-ods essential to drive discovery and eliminate the bottleneck in cancer genomic analysis and templates for creating sim-ilar analyses that leverage comparable software. Availability and usability of analytical software are both critical factors in driving their adoption and the ultimate discovery of novel can-cer drivers. Accordingly, we provide a series of solutions that should accelerate adoption of our toolkit. First, providing au-tomatic installation for tools wherever possible allow seamless integration into custom Galaxy instances. Second, many of the tools and workflows included here can be optionally config-ured to efficiently parallelize tasks on a cluster environment. Third, we show that our toolkit can be readily deployed onto a cloud-based Galaxy instance thereby eliminating the need for permanent access to commodity computing hardware or ded-icated systems administrators. Together, this offers the poten-tial to enable reproducible cancer research by empowering re-searchers to perform their own cancer genome analyses with
unprecedented accessibility and directly share their workflows such that other groups can reproduce these analyses on addi-tional datasets. We have provided the data files resulting from running each of the workflows described in this manuscript on the DLBCL cohort as examples for users wishing to test these tools.
As ownership of these tools migrates to the Intergalactic Utilities Commission along with transfer to the Main ToolShed, we encourage ongoing testing and parameter optimization and community-driven refinement and expansion of this toolkit. With sufficient adoption and ongoing support, this toolkit could empower numerous groups to explore the many available cancer data sets and their own experimental data using cloud infras-tructure thereby facilitating the broader scientific community to make use of the steadily growing genomic resources being pro-duced within this field.
Abbreviations
AWS Amazon Web Services CNV copy number variation
DLBCL Diffuse large B-cell lymphoma GUI graphical user interfaces
PMBCL Primary mediastinal B-cell lymphoma SNV somatic single nucleotide variant SV structural variation
TCGA The Cancer Genome Atlas Availability and requirements
r
Project Name: Cancer Genomics Toolkit for Galaxyr
Project Homepage:https://github.com/morinlab/tools-morinlab
r
Operation System: Linuxr
Programming language: Pythonr
Other requirements: Please refer to the source code and thetools-iuc repository.
r
License: GPLv3All tools described herein are available in the Galaxy Test Toolshed (https://testtoolshed.g2.bx.psu.edu/) and under the GPLv3 license via the project GitHub repository. The Dockerfile to automatically install these tools and a prebuilt Docker image are also provided. The dependencies of each tool are documented in the associated tool dependency description and the Docker-file and are too numerous to detail here. Instead, please refer to the source code:https://github.com/morinlab/tools-morinlab and the tools-iuc repository.
Availability of supporting data
Archived snapshots of the code and test data are available from theGigaScienceGigaDB repository [29].
Competing interests
The authors declare they have no competing interests. Author contributions
MAA, SJ, PP, and ER were responsible for deploying tools in Galaxy. MAA and BMG tested workflows on AWS. MAA and MK created figures. MAA, BMG, and RDM wrote the manuscript, which was reviewed and approved by all authors. RDM, PCB, and SPS led the study.
Additional files
Additional file Fig. S1An ensemble approach to detect somatic SNVs. The ensembl˙vcf tool receives the output of variant callers and selects variants detected by a user-specified number of tools. This example workflow runs four variant callers (strelka, mutationSeq, RADIA and SomaticSniper) and runs vcf2maf to annotate the resulting list of variants with support from a suffi-cient number of tools.
Additional file Fig. S2 Achieving parallelization in Galaxy. There are two ways to achieve parallelization in Galaxy. The first (A) employs the parallelism tag, which calls specific split and merge functions depending on the Galaxy input and out-put data type. These functions are predefined within galaxies codebase. The second (B) uses galaxy collections, which are es-sentially containers of input files. Inputs can be split into a col-lection of files and subsequently pipeline these through a series of tools. When complete, the individual outputs can be merged. Parallelizing using collections is far more transparent to the user and also limits that number of unnecessary split and merge functions.
Additional file Fig. S3A workflow to integrate SNV and CNV data and produce integrative visualizations. This workflow uses exome-derived CNV and SNV data to generate a list of recur-rently gained/lost genomic regions (using GISTIC) and displays these along with gene-centric summaries of segmented copy number and SNV data using Oncocircos. To generate Fig. 5, we included a blacklist containing all immunoglobulin genes and Mucin genes whereas the genes identified as significantly mutated by oncodriveFM were provided separately to enforce highlighting.
Additional file Fig. S4Using the Oncostrip tool to integrate copy number and mutation data. It can be desirable to visu-alize the complete set of mutational information cohort-wide without losing the patient-mutation relationships and poten-tial gene-gene interactions that are not retained in Oncocircos. For this application, the Oncostrip component ofmaftoolscan also accept raw outputs from GISTIC. Here, we have included the known gene targets of some recurrent amplifications and dele-tions detected in the cohort (REL, B2M, andTNFRSF14). Each of
FAT1andTMEM30Areside in significantly deleted regions and
bear a combined pattern of mutation and deletion consistent with tumor suppressor function.
Additional file Table S1Helper tools implemented to facili-tate tool linkage and parallelization.
Acknowledgements
The results published here are in whole or part based upon data generated by the TCGA Research Network: http://cancergenome.nih.gov/. We gratefully acknowledge TCGA and all providers of samples and resources for gen-erating this valuable resource. The TCGA exome data was obtained through Database of Genotypes and Phenotypes (phs000178.v9.p8 and phs000450.v2.p1) and the latter has been described previously [19]. Said data were produced as part of the Slim Initiative for Genomic Medicine (SIGMA), a joint US-Mexico project funded by the Carlos Slim Health Institute. This work was supported by a contract from Genome Canada and Genome British Columbia (173CIC), funding from Mitacs (awarded to Morin) and Amazon AWS research grant. Sequencing of the large DLBCL cohort was funded by an operating grant from CIHR (to RDM). RDM is supported by New Investigator Awards from the Canadian Institutes for Health Research and the Terry Fox
Research Institute. We thank all members of the Boutros, Shah and Morin research groups for feedback on this work. We also thank the Galaxy community for their ongoing support. We are particularly grateful to Enis Afgan, John Chilton, Nitesh Turaga, and Bj ¨orn Gruening for their gracious assistance. We also thank Marija Jovanovic for assisting in tool deployment.
References
1. Jafar Taghiyar M et al. Kronos: a workflow assembler for genome analytics and informatics. bioRxiv 2016:040352. doi:10.1101/040352.
2. Kurs JP, Simi M, Campagne F.,Nextflow Workbench Documenta-tion Booklet. Fabien Campagne, 2016.http://campagnelab.org/ download/nextflowworkbench-documentation-1-5-1/ ?wpdmdl=6826
3. K ¨oster J, Rahmann S, Snakemake–a scalable bioinformatics workflow engine. Bioinformatics 2012;28:2520–22.
4. Altschul SF et al. Gapped BLAST and PSI-BLAST: a new gen-eration of protein database search programs. Nucleic Acids Res.1997;25:3389–3402.
5. Powell DR, Seemann T. VAGUE: a graphical user interface for the Velvet assembler. Bioinformatics 2013;29:264–65. 6. Wettenhall JM, Smyth GK. limmaGUI: a graphical user
inter-face for linear modeling of microarray data. Bioinformatics 2004;20:3705–6.
7. Goecks J., Nekrutenko A, Taylor J, Galaxy: a comprehensive approach for supporting accessible, reproducible, and trans-parent computational research in the life sciences. Genome Biol. 2010;11:R86.
8. Blankenberg D, Kuster G V, Coraor N et al. Galaxy: A Web-Based Genome Analysis Tool for Experimentalists. Current Protocols in Molecular Biology. 2010;89:19.10.1–21.
9. Zhang H, Hyde Z, Stian S-R et al. Taverna Mobile: Taverna workflows on Android. EMBnet.journal 2013;19:43.
10. Deelman E et al. Pegasus, a workflow management sys-tem for science automation. Future Gener. Comput. Syst. 2015;46:17–35.
11. Kearse M et al. Geneious Basic: an integrated and extendable desktop software platform for the organization and analysis of sequence data. Bioinformatics 2012;28:1647–49.
12. Afgan E et al. Galaxy CloudMan: delivering cloud compute clusters. BMC Bioinformatics 2010;11(Suppl 12):S4.
13. galaxyproject. galaxyproject/planemo. GitHub https:// github.com/galaxyproject/planemo (23rd November 2015, date last accessed).
14. Blankenberg D et al. Dissemination of scientific software with Galaxy ToolShed. Genome Biol. 2014;15:403.
15. Ewing AD et al. Combining tumor genome simulation with crowdsourcing to benchmark somatic single-nucleotide-variant detection. Nat. Methods 2015;12:623–30.
16. Blankenberg D, Johnson J E, Galaxy Team, Taylor J et al. Wrangling Galaxy’s reference data. Bioinformatics 2014; 30:1917–19.
17. Boutros PC et al. Global optimization of somatic variant iden-tification in cancer genomes with a global community chal-lenge. Nat. Genet. 2014;46:318–19.
18. Ewing AD et al. Combining tumor genome simulation with crowdsourcing to benchmark somatic single-nucleotide-variant detection. Nat. Methods 2015;12:623–30.
19. Lohr JG et al. Discovery and prioritization of somatic mutations in diffuse large B-cell lymphoma (DLBCL) by whole-exome sequencing. Proc. Natl. Acad. Sci. U. S. A. 2012;109:3879–84.
20. Mayakonda A, Phillip Koeffler H. Maftools: efficient anal-ysis, visualization and summarization of MAF files from large-scale cohort based cancer studies. bioRxiv 2016:052662. doi:10.1101/052662.
21. Morin RD et al. Frequent mutation of histone-modifying genes in non-Hodgkin lymphoma. Nature 2011;476: 298–303.
22. Morin RD et al. Genetic landscapes of relapsed and re-fractory diffuse large B-cell lymphomas. Clin. Cancer Res. 2016;22:2290–300.
23. Meissner B et al. The E3 ubiquitin ligase UBR5 is recur-rently mutated in mantle cell lymphoma. Blood 2013;121: 3161–64.
24. Wiegand KC et al. ARID1A mutations in endometriosis-associated ovarian carcinomas. N. Engl. J. Med. 2010; 363:1532–43.
25. Krzywinski M et al. Circos: an information aesthetic for com-parative genomics. Genome Res. 2009;19:1639–45.
26. Jardin F, Pujals A, Pelletier I et al. Whole exome sequencing of refractory aggressive B-cell lymphomas identified recurrent mutations of the exportin 1 gene (XPO1) in primary mediasti-nal B-cell lymphoma subtype, a LYSA study. Hematol. Oncol. 2015;33:100–80.
27. Park HY et al. Whole-exome and transcriptome sequencing of refractory diffuse large B-cell lymphoma. Oncotarget 2016. doi:10.18632/oncotarget.13239.
28. Mansouri L et al. Frequent NFKBIE deletions are associated with poor outcome in primary mediastinal B-cell lymphoma. Blood 2016. doi:10.1182/blood-2016-03-704528.
29. Albuquerque MA, Grande BM, Ritch EJ et al. Supporting data for “Enhancing Knowledge Discovery from Cancer Genomics Data with Galaxy” GigaScience Database. 2017. http://dx.doi.org/10.5524/100289.
30. Ding J et al. Feature-based classifiers for somatic mutation detection in tumour-normal paired sequencing data. Bioin-formatics 2012;28:167–75.
31. Saunders CT et al. Strelka: accurate somatic small-variant calling from sequenced tumor-normal sample pairs. Bioin-formatics 2012;28:1811–17.
32. Larson DE et al. SomaticSniper: identification of somatic point mutations in whole genome sequencing data. Bioin-formatics 2012;28:311–17.
33. Radenbaugh AJ et al. RADIA: RNA and DNA integrated analysis for somatic mutation detection. PLoS One 2014;9: e111516.
34. Lai Z et al. VarDict: a novel and versatile variant caller for next-generation sequencing in cancer research. Nucleic Acids Res. 2016;44:e108.
35. Rausch T et al. DELLY: structural variant discovery by in-tegrated paired-end and split-read analysis. Bioinformatics 2012;28:i333–39.
36. Layer RM, Chiang C, Quinlan AR et al. LUMPY: A probabilis-tic framework for structural variant discovery. Genome Biol. 2014;15:R84.
37. Ye K, Schulz MH, Long Q et al. Pindel: a pattern growth ap-proach to detect break points of large deletions and medium sized insertions from paired-end short reads. Bioinformatics 2009;25:2865–71.
38. Chen X et al. Manta: rapid detection of structural vari-ants and indels for clinical sequencing applications. bioRxiv 2015:024232. doi:10.1101/024232.
39. Favero F et al. Sequenza: allele-specific copy number and mutation profiles from tumor sequencing data. Ann. Oncol. 2015;26:64–70.
40. Ha G et al. TITAN: inference of copy number architectures in clonal cell populations from tumor whole-genome sequence data. Genome Res. 2014;24:1881–1893.
41. McLaren W et al. The Ensembl Variant Effect Predictor. Genome Biol. 2016;17:122.
42. Roth A et al. PyClone: statistical inference of clonal popula-tion structure in cancer. Nat. Methods 2014;11:396–98. 43. Andor N, Harness JV, M ¨uller S et al. EXPANDS: expanding
ploidy and allele frequency on nested subpopulations. Bioin-formatics 2014;30:50–60.
44. Lawrence MS et al. Mutational heterogeneity in cancer and the search for new cancer-associated genes. Nature 2013;499:214–18.
45. Gonzalez-Perez A, Lopez-Bigas N. Functional impact bias reveals cancer drivers. Nucleic Acids Res. 2012;40: e169.
46. Mermel CH et al. GISTIC2.0 facilitates sensitive and con-fident localization of the targets of focal somatic copy-number alteration in human cancers. Genome Biol. 2011;12: R41.
47. P’ng C et al. BL.plotting.general: a package to visualize scientific data.https://labs.oicr.on.ca/boutros-lab/software/ bpg
48. McLaren W et al. Deriving the consequences of genomic vari-ants with the Ensembl API and SNP Effect Predictor. Bioinfor-matics 2010;26:2069–70.