Decomposing responses to mobile
notifications
A thesis submitted in partial fulfilment
of the requirement for the degree of Doctor of Philosophy
Liam D. Turner
2017
Cardiff University
iii
Declaration
This work has not been submitted in substance for any other degree or award at this or any other university or place of learning, nor is being submitted concurrently in candidature for any degree or other award.
Signed . . . (candidate) Date . . . .
Statement 1
This thesis is being submitted in partial fulfilment of the requirements for the degree of PhD.
Signed . . . (candidate) Date . . . .
Statement 2
This thesis is the result of my own independent work/investigation, except where otherwise stated, and the thesis has not been edited by a third party beyond what is permitted by Cardiff University’s Policy on the Use of Third Party Editors by Research Degree Students. Other sources are acknowledged by explicit references. The views expressed are my own.
Signed . . . (candidate) Date . . . .
Statement 3
I hereby give consent for my thesis, if accepted, to be available online in the University’s Open Access repository and for inter-library loan, and for the title and summary to be made available to outside organisations.
Dedication v
vii
Acknowledgements
I would like to thank my supervisors Professor Stuart Allen and Professor Roger Whitaker for their continued support and guidance. I would also like to thank the staff and PhD students of the School of Computer Science and Informatics, both past and present, for their support and feedback.
ix
Abstract
Notifications from mobile devices frequently prompt us with information, either to merely inform us or to elicit a reaction. This has led to increasing research interest in considering an individual’s interruptibility prior to issuing notifications, in order for them to be positively received. To achieve this, predictive models need to be built from previous response behaviour where the individual’s interruptibility is known. However, there are several degrees of freedom in achieving this, from different definitions in what it means to be interruptible and a notification to be successful, to various methods for collecting data, and building predictive models.
The primary focus of this thesis is to improve upon the typical convention used for labelling interruptibility, an area which has had limited direct attention. This includes the proposal of a flexible framework, called the decision-on-information-gain model, which passively observes response behaviour in order to support various interruptibility definitions. In contrast, previous studies have largely surrounded the investigation of influential contextual factors on predicting interruptibility, using a broad labelling convention that relies on notifications being responded to fully and potentially a survey needing to be completed.
The approach is supported through two in-the-wild studies of Android notifications, one with 11,000 notifications across 90 users, and another with 32,000,000 across 3000 users. Analysis of these datasets shows that: a) responses to notifications is a decision-making process, whereby individuals can be reachable but not receptive to their content,
x Abstract
supporting the premise of the approach; b) the approach is implementable on typical Android devices and capable of adapting to different notification designs and user preferences; and c) the different labels produced by the model are predictable using data sources that do not require invasive permissions or persistent background monitoring; however there are notable performance differences between different machine learning strategies for training and evaluation.
xi
Contents
Acknowledgements vii
Abstract ix
Contents xi
List of Publications xix
List of Figures xxi
List of Tables xxvii
1 Introduction 1
1.1 Mobile notifications . . . 2
1.1.1 Interacting with notifications . . . 3
1.1.2 Coexisting notifications . . . 4
1.2 Problem definition . . . 5
1.3 Contributions . . . 6
xii Contents
2 Background 11
2.1 Overarching themes in studying interruptibility . . . 12
2.2 Variability in the definitions of interruptibility used . . . 13
2.3 Scenarios and interruptibility . . . 18
2.3.1 Choice of interruption . . . 18
2.3.2 Choice of study environment . . . 19
2.3.3 Choice of study objective . . . 20
2.4 Data collection and labelling . . . 22
2.4.1 Strategies for labelling interruptibility . . . 22
2.4.2 Capturing contextual data . . . 25
2.4.2.1 Common contextual data traces collected . . . 25
2.4.2.2 Extracting feature variables from the raw traces . . 28
2.4.3 Datasets and participation . . . 30
2.4.3.1 Incentivising study participation . . . 32
2.5 Predicting interruptibility . . . 32
2.5.1 Finding influential features . . . 33
2.5.2 From datasets to training sets . . . 34
2.5.3 Training environment: offline vs online . . . 35
2.5.4 Training data: aggregate vs personal . . . 36
2.5.5 Classification and evaluation . . . 37
2.6 Conclusions . . . 40
Contents xiii
3 Interruptibility behaviour as a decision process 43
3.1 Decomposing response behaviour for labelling interruptibility . . . . 44
3.2 The Decision-On-Information-Gain (DOIG) model . . . 46
3.2.1 Abstract model . . . 47
3.2.2 Applying the DOIG model to Android notifications . . . 48
3.2.2.1 Flexibility and limitations in applying the model for Android and other notification systems . . . 50
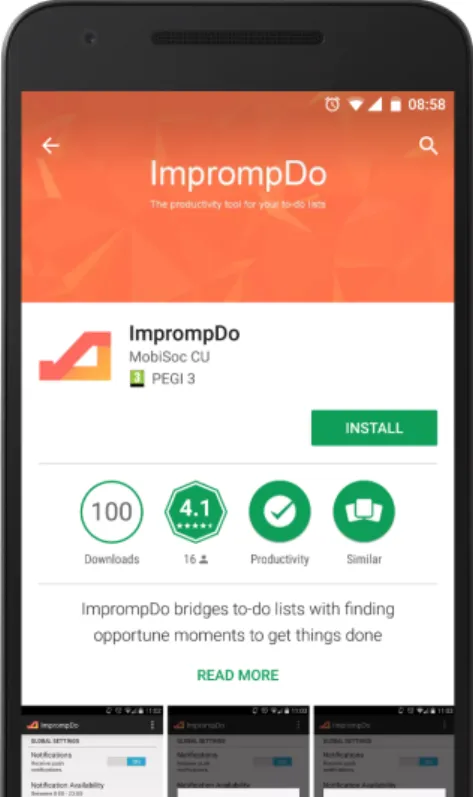
3.3 Applying the DOIG model: ImprompDo Android application . . . 52
3.3.1 Rationale for an in-the-wild application design . . . 52
3.3.2 Installation and setup . . . 54
3.3.3 Interruptions: Android notifications . . . 55
3.3.4 Data collection: response behaviour and contextual data . . . 56
3.3.4.1 Collecting response behaviour for labelling . . . 57
3.3.4.2 Collecting contextual data . . . 58
3.3.5 Dataset . . . 60
3.4 DOIG model versus black-box labelling . . . 61
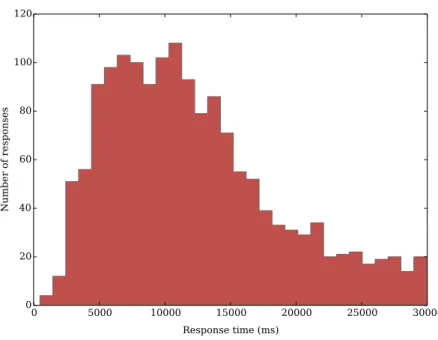
3.4.1 Exploring response time . . . 62
3.5 Conclusions . . . 64
4 Sampling context and decision data 67 4.1 Investigating sampling stability and usefulness . . . 68
4.2 Passively sampling data on Android devices with ImprompDo . . . . 69
xiv Contents
4.2.1.1 Data availability . . . 70
4.2.1.2 Sampling regularity . . . 71
4.3 Correlations between contextual data and DOIG labels . . . 74
4.3.1 Extracting features from the raw data traces . . . 74
4.3.2 Correlations between features and DOIG model labels . . . . 76
4.4 Conclusions . . . 79
5 Predicting decision making behaviour 81 5.1 Examining machine learning strategies . . . 82
5.1.1 Machine learning approach . . . 83
5.1.1.1 Pre-processing . . . 83
5.1.1.2 Classifier choice . . . 84
5.1.1.3 Training and testing models . . . 84
5.1.1.4 Evaluating model performance . . . 85
5.2 Performance of a typical user (AT-AT) . . . 87
5.2.1 Classifier performance . . . 87
5.2.1.1 Reducing classifier choice to decision-trees . . . 89
5.3 Comparing aggregate and personalised models (AT-PT and PT-PT) . 90 5.3.1 Training from aggregate data (AT-PT) . . . 92
5.3.2 Training from personal data (PT-PT) . . . 93
5.3.3 Comparison with common Android conventions . . . 96
Contents xv
5.3.3.2 Volume state baseline . . . 97
5.4 Predictive models in an online environment . . . 102
5.5 Conclusions . . . 105
6 Model robustness to variability 109 6.1 Boomerang Notifications Android application . . . 109
6.1.1 Installation and setup . . . 113
6.1.2 Data collection process . . . 115
6.1.3 Dataset . . . 117
6.2 Flexibility of the DOIG model . . . 119
6.2.1 Variability in notification properties . . . 120
6.2.1.1 Grouping and priority . . . 120
6.2.1.2 Actions and remove-ability . . . 121
6.2.1.3 Interruptive nature . . . 123
6.2.1.4 Impact on observable decisions in the DOIG Model 124 6.2.2 Variability in device preferences . . . 125
6.2.2.1 Notification display preferences . . . 126
6.2.2.2 Interruption policies . . . 127
6.2.2.3 Impact on observable decisions in the DOIG Model 128 6.3 Conclusions . . . 130
xvi Contents
7 Coexisting Notifications 133
7.1 Notification Stacks . . . 133
7.2 Notifications and usage sessions . . . 135
7.2.1 Notification stacks . . . 136
7.3 Selectivity when managing the notification stack . . . 138
7.3.1 Frequency of notification removals . . . 139
7.3.2 Stack removals and deferment . . . 139
7.3.3 When stack management occurs inside sessions . . . 142
7.4 Influence of wider usage on individual responses . . . 145
7.4.1 Notifications prompt responses to other notifications . . . 145
7.4.2 Interruption policies are not representative . . . 146
7.4.3 Impact from notification stack characteristics . . . 147
7.5 Implications and impact on the DOIG model . . . 149
7.6 Conclusions . . . 150
8 Conclusions and future work 153 8.1 Thesis summary . . . 154
8.1.1 Contributions, key observations, and limitations . . . 155
8.1.1.1 Current conventions in interruption research . . . . 155
8.1.1.2 The decision-on-information-gain model . . . 156
8.1.1.3 Robustness: DOIG model flexibility and position among wider behaviour . . . 158
Contents xvii
8.2.1 Maximisation of predictive indicators with the DOIG model . 160 8.2.2 Real world application and evolutionary learning . . . 160 8.2.3 Wider research questions . . . 161 8.3 Final remarks . . . 163
Bibliography 165
Appendices 177
Appendix A ImprompDo App Design & Dataset . . . 179 Appendix B Boomerang Notifications App Design . . . 189
xix
List of Publications
This thesis includes work introduced in the following publications:
Turner, L. D., Allen, S. M., and Whitaker, R. M. (2015a). Interruptibility prediction for ubiquitous systems: Conventions and new directions from a growing field. InProc. UbiComp’15, pages 801–812. ACM
Turner, L. D., Allen, S. M., and Whitaker, R. M. (2015b). Push or delay? decompos-ing smartphone notification response behaviour. InHuman Behavior Understanding, volume 9277 ofLecture Notes in Computer Science, pages 69–83. Springer International Publishing
Turner, L. D., Allen, S. M., and Whitaker, R. M. (2017b). Reachable but not recept-ive: Enhancing smartphone interruptibility prediction by modelling the extent of user engagement with notifications. Pervasive and Mobile Computing
Turner, L. D., Allen, S. M., and Whitaker, R. M. (2017a). Behaviour patterns in managing stacks of mobile notifications
xxi
List of Figures
1.1 An example Android notification. . . 2
1.2 Multiple notifications in a notification drawer. . . 3
1.3 An example notification icon shown on the Android top bar. . . 4
2.1 Definition groups over time. Figure extended from [121]. . . 15
2.2 Use of different experiment environments over time. Figure extended from [121] . . . 21
2.3 Use of different labelling strategies over time. Figure extended from [121] 24 2.4 Use of different data collection strategies over time. Figure extended from [121] . . . 27
3.1 An abstract representation of the common black-box convention for labelling interruptibility. After being interrupted (!), if a user chooses to respond and eventually reaches and consumes the content (e.g., by tapping on a mobile notification), a labelling task is then performed by the user (either explicitly through a survey or passively) . . . 45
xxii List of Figures
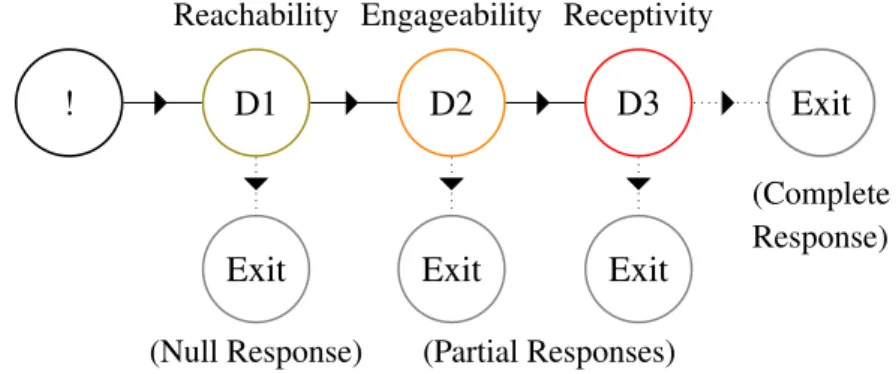
3.2 A visualisation of the linear sequence of decisions made during a typical response to an Android notification (𝑘 = 3). After the interruption occurs (!), at each point new information is given (e.g., the application icon) the user must decide (e.g., D1) whether to continue on to the next decision (e.g., D2), (up until either the notification is consumed) or exit at a particular decision. Figure from [124] . . . 50
3.3 The ImprompDo app listing on the Google Play Store. . . 53
3.4 The main UI screen for the ImprompDo app after initial setup. Figure from [122] . . . 55
3.5 The Android notification response process used. Figures from [122, 124] 56
3.6 Visualisation of the the data collection process, from 5 seconds before delivery up until the notification is consumed (at𝑇𝑡(5𝑠 < 𝑇𝑡< 35𝑠)) or it expires. Figure from [122] . . . 57
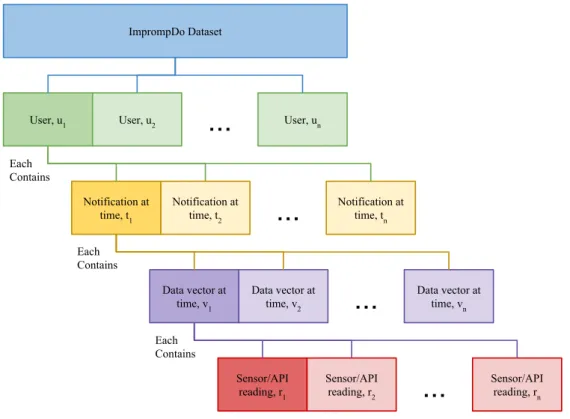
3.7 A visualisation of the ImprompDo dataset structure. . . 59
3.8 Histogram of response times for notifications that were either consumed or dismissed, using a bin size of 1000 milliseconds . . . 63
4.1 The reliability of sensor readings within 2 seconds. . . 71
5.1 Visualisation of the training and testing approaches (as described in Section 5.1.1.3). Personally tested approaches are visualised using an example user (user1). Additionally, each data point cannot be in both training and testing datasets. ▮= the training data used and ▮ = the testing data used . . . 85
List of Figures xxiii
5.2 Visualisation of the PPV, NPV, sensitivity and specificity metrics used. Weighted precision is the average between PPV and NPV perform-ance, and weighted recall refers to the average between sensitivity and specificity performance . . . 86 5.3 User performance for models trained from aggregate data (AT-PT).
Rv* refers to receptivity when the device is in use. Y-axis represents prediction performance. Figure from [124] . . . 91 5.4 Predictive performance of AT-PT and PT-PT for more active users.
Rv* refers to receptivity when the device is in use. Y-axes represent prediction performance. Figures from [124] . . . 94 5.5 User performance for models trained from personalised data (PT-PT).
Rv* refers to receptivity when the device is in use. Figure from [124] 95 5.6 Always interrupt baseline PPV performance across users - The user
is always interruptible (default application assumption). Sensitivity is 1.0 and 0 for NPV and specificity, across all models. Y-axis represents prediction performance. Figure from [124] . . . 97 5.7 A comparison of the volume state baseline against the multi-modal
models trained from aggregated data (AT-PT). Rv* refers to receptivity when the device is in use. Y-axes represent prediction performance. Figures from [124] . . . 98 5.8 A comparison of the volume state baseline against the multi-modal
models for personalised models (PT-PT). Rv* refers to receptivity when the device is in use. Y-axes represent prediction performance. Figures from [124] . . . 100 5.9 Online learning visualisation for the first 21 days, using the mean
value of users with >21 days participation. Y-axes represent prediction performance. Figures from [124] . . . 104
xxiv List of Figures
6.1 An example of the Boomerang Notifications main user interface . . . 110 6.2 User feature: the process for saving a notification . . . 111 6.3 The Boomerang Notifications app listing on the Google Play Store. . . 112 6.4 Screenshots from Boomerang Notification’s setup process. . . 113 6.5 Screenshots of Boomerang Notification’s customisation options for the
user facing features . . . 114 6.6 Icons for notifications with Normal or higher priority are shown along
the top (left) of the screen as well as in the notification drawer. Low priority notifications are only shown in the notification drawer . . . . 121 6.7 Interruptive design across interrupting notifications. . . 123 6.8 Notification display preferences across users. . . 126 6.9 Use of interruption policies across users. . . 128
7.1 A typical Android notification drawer showing an example stack of notifications. Priority notifications refer to those with a priority (set by the application) of at least “Normal” [3], discussed further in Section 7.2134 7.2 Distribution of the number of sessions in which none, some, or all of
the notifications present in the starting stack are removed by the end of the session. Considering both: all notifications regardless of their properties (shown on the left, number of sessions = 1,077,518) and only priority notifications that are individually dismissable (shown on the right, number of sessions = 798,358) . . . 140 7.3 The number of usage sessions unique notifications existed within. . . 141
List of Figures xxv
7.4 When notifications are removed within usage sessions, split between whether the notification was present in the notification stack at the start of the session, or arrived during, using 20 bins with each representing 5% of the usage session . . . 143 7.5 The proportion (percentage) of removed priority notifications, grouped
by the number of dismissable priority notifications . . . 147 7.6 The absolute position of notifications that were removed during usage
xxvii
List of Tables
2.1 The typical linear paradigm of interruptibility studies, including sub-components. Table extended from [121] . . . 12 2.2 A decomposition of the approaches used across studies for:
defin-ing interruptibility, the experiment environment, collectdefin-ing contextual data, and collecting interruptibility labels, sorted ascending by year. Some studies can include the use of multiple types of approaches (e.g., if different experiments are performed). PA=Physiological Ability, CE=Cognitive Effect, US=User Sentiment as defined in Section 2.2. COE=Controlled environment, EI=Explicit “in-the-wild” environment, II=Implicit “in-the-wild” environment as discussed in Section 2.3.2 and defined in Table 2.3. EUS=Explicit User Surveys (i.e., ESM), RS=Real world machine data sources, SS = Simulated data sources, as discussed in Section 2.4.2.1 and shown in Figure 2.4. EOS=Explicit opinion from in situ surveys (i.e., ESM), IIO=Implicit in situ observations of behaviour, RSL=Retrospective labelling, as discussed in Section 2.4.1 and shown in Figure 2.3. Table extended from [121]. . . 17 2.3 Common types of experiment environments used. Table extended
from [121] . . . 20 2.4 A categorisation of commonly captured data traces. Table extended
xxviii List of Tables
2.5 A categorisation of common features. Table extended from [121]. . . 29
2.6 An overview of techniques and algorithms used for interruptibility prediction. Table extended from [121] . . . 39
4.1 Frequency statistics of the (ms) intervals between the start of the sampling time-windows . . . 72
4.2 P-values indicating significance of each feature before the interruption and the outcome of each decision [122, 124]. Bold values show sig-nificance using 𝑝 < .05. * Mann-Whitney U Test ** Kruskal-Wallis 1-way ANOVA. Rc=Receptivity, Eg=Engageability, Rv=Receptivity. .000 values refer to strong significance< .001. Table from [122, 124] 77
5.1 Classifier performance of the aggregated dataset (AT-AT) using weighted precision and recall metrics and different measures of interruption suc-cess (reachability, engageability, receptivity). Classifier names are those provided by Weka [39]. MC=the multi-class model. Bold values indicate the highest value across classifiers. Table from [122] . . . 88
5.2 Classifier performance (J48) of the aggregated dataset (AT-AT) us-ing unweighted metrics and different measures of notification success (reachability, engageability, receptivity). Table from [124] . . . 89
6.1 The top 10 applications that produced notifications. . . 117
6.2 Applications that produced the most notifications for 13 example Google Play Store categories. . . 119
List of Tables xxix
A.1 The observable interruption and response process to Android notifica-tions for versions up to and including v4.4, when the device is not-in-use at the time the notification is delivered . . . 179 A.2 The observable interruption and response process to Android
notifica-tions for versions up and including v4.4, when the device is in-use at the time the notification is delivered . . . 180 A.3 The randomly chosen triggers used. . . 181 A.4 Data completeness in notification responses. This is discussed further in
analysis comparing the DOIG model vs typical black-box approaches to labelling in Chapter 3, Section 3.4 . . . 182 A.5 Frequency statistics of whether notifications were consumed (tapped
on), dismissed, or expired, split between whether the device was in-use or not at the time the notification was delivered. Superscript charac-ters are used for cross-referencing values within the table and with Tables A.6, A.7 and A.8 . . . 182 A.6 Frequency statistics on the number of notifications removed by the user
by various means. This is used in the analysis of user response time to notifications in Chapter 3, Section 3.4.1. Superscript characters are used for cross-referencing values within the table and with Tables A.5, A.7 and A.8 . . . 182 A.7 Frequency statistics of user response behaviour. Only responses that
were at least reachable are analysed for engage-ability, likewise only responses where the user was engageable are considered for receptiv-ity. Dismissals are considered “Not Receptive” in this representation. Superscript characters are used for cross-referencing values within the table and with Tables A.5, A.6 and A.8 . . . 183
xxx List of Tables
A.8 Calculations used to compare how many additional responses the DOIG model captures in comparison to typical black-box approaches for labelling interruptibility. This is discussed in Chapter 3, Section 3.4. Superscript characters are used for cross-referencing values within the table and with Tables A.5, A.6 and A.7 . . . 183 A.9 For each version of Android, whether the data vectors were consistent in
either always, sometimes, or never containing sensor data. grv=Gravity, prx=Proxmity, prs=Pressure, lin=Linear Acceleration, rtv=Rotation Vector, gyr=Gyroscope, mag=Magnetic Field, lgt=Light . . . 184 A.10 For those versions of Android that were consistent in some way in
Table A.9, whether they were either always, sometimes, or never con-sistent. prx=Proximity . . . 184 A.11 For devices that were used by at least 2 users, whether the data
vec-tors were consistent in either always, sometimes, or never containing sensor data. grv=Gravity, prx=Proxmity, prs=Pressure, lin=Linear Ac-celeration, rtv=Rotation Vector, gyr=Gyroscope, mag=Magnetic Field, lgt=Light . . . 184 A.12 For those devices that were consistent in some way in Table A.11,
whether they were either always, sometimes, or never consistent. grv=Gravity, prx=Proxmity, prs=Pressure, lin=Linear Acceleration, rtv=Rotation Vec-tor, gyr=Gyroscope, mag=Magnetic Field, lgt=Light. . . 186 A.13 Features extracted from the sensor/software API data traces. . . 187
B.1 Boomerang Notifications’ user modifiable settings. . . 189 B.2 Notifications produced by Boomerang Notifications. . . 190
1
Chapter 1
Introduction
Over the last decade the rise of the smartphone has had a profound effect on society, providing opportunities for ubiquitous information retrieval and delivery. Interactions with mobile devices have shifted from being predominately instigated by the user, to also include responses to interruptions instigated by applications (apps). This has extended into the rise of other mobile devices, including tablets and smart wearables.
Theappculture has expanded the diversity and frequency of interruptions from phone calls, alarms, and SMS messages to include notifications - snippets of information from diverse information sources, intended to inform, persuade, or prompt reaction. The concept of a notification is not limited to mobile devices, but a common thread exists in their intention to augment daily life with information. However, inappropriately timed interruptions from notifications can have a negative effect, at best being an annoyance and at worst a dangerous distraction. The ubiquitous nature of mobile devices and the continual evolution of notifications make this a timely issue, with ramifications for both applications that interrupt and the cognitive demands placed on individuals.
Assessing another person’s interruptibility prior to interaction with them is a natural human behaviour that is easily handled by the human brain [16, 34, 49, 126, 69]; for example we naturally assess the likely ramifications of engaging someone before initiat-ing conversation. However, creatinitiat-ing such capability in the context of a machine (such as a mobile application issuing notifications) is a significant challenge. Towards this, a central theme in interruptibility research with mobile notifications (and interruptions
2 1.1 Mobile notifications
Figure 1.1: An example Android notification.
more broadly) has been to learn from how users interact with the interrupting content (if at all). However, variation in notification design, as well as in definitions of what makes someone “interruptible” and a notification successful, has left the area fragmented with study conclusions that are tightly coupled with specific experiment scenarios [121]; where the boundaries of wider applicability are often unclear [107].
1.1
Mobile notifications
The development of use cases for notifications (and their design) has been an evolution-ary process. Historically, interruptions from mobile devices were limited to communic-ation prompts or alarms. Notificcommunic-ations have absorbed these into a flexible platform for delivering and presenting snippets of information. However, they are autonomous in that they can be generated by individual applications at any time without any consideration of interruptibility, and contain any information relevant to that application. An example (email) notification is shown in Figure 1.1, with further examples, such as an instant messaging notification, a media player notification and a calendar reminder shown in Figure 1.2. This has enabled other applications that have previously not attempted to interact with the user in this manner, such as games, to adopt notifications as a means of attracting attention.
The implementation of notifications is similar across different mobile devices and operating systems, with some degrees of freedom in their individual appearance and interruptive design. Content has traditionally been a short piece of text, however this has been extended over recent years to also enable other types of content and interactive features, such as images, lists, and actionable buttons. Notifications can also adopt
1.1 Mobile notifications 3
Figure 1.2: Multiple notifications in a notification drawer.
mechanisms to interrupt the user, in addition to merely appearing on the device’s user interface; using combinations of audio tones, vibration patterns, and visual cues (e.g., a flashing LED pattern). Finally, notifications have evolved to have variability in their persistence (i.e., whether a user can remove them) and priority (e.g., whether they pop-up on the screen), making the concept suitable for a broad range of use cases.
1.1.1
Interacting with notifications
While notifications are tightly associated with individual applications, they are isolated from their user interfaces. Notifications operate in a pushbased manner, where an application dictates when they are created and made known to the user (assuming that the user has not disabled an application’s ability to push notifications). Therefore, a user does not need to be using the application, or even using the device, in order for notifications to arrive. In some use cases this is directly influenced by external sources, for example, a SMS application will push notifications when the device receives the message. This is the opposite of user-driven interactions with applications, where a user
4 1.1 Mobile notifications
Figure 1.3: An example notification icon shown on the Android top bar.
may open and interact with the user interface in order topullinformation from it (e.g., perform a Google search or browse Twitter).
As with interruptions in general [73, 75], the response process towards notifications is a sequential process of pausing the current task and pursuing the content. On Android devices, after a notification has been generated, it is placed in thenotification drawer
(shown in Figure 1.2), where it remains until it is removed and permanently destroyed. Access to a notification can require the user to traverse a series of screens, particularly if the device is not in use. Along the way, the user can become aware of various information about the notification (e.g., the originating app), and decide whether to pursue further. For example, Figure 1.3 shows a notification icon being displayed along the top (left) of Android’s user interface.
As well as presenting information, the notification design may also encourage the user to act upon the notification and perform some direct action in response. However this is largely use-case dependent, for example, an email notification may have actions for immediately replying to the email or deleting it, whereas a weather summary notification may not have any direct response actions and simply display information.
1.1.2
Coexisting notifications
Notifications are designed, delivered, and responded to independently of one another, however they can coexist together. Multiple notifications that display different informa-tion for different purposes can be present at any given time (as shown in Figure 1.2), with any interruptions queued if they arrive in quick succession. On arrival, notifications are added to a stack where a user can interact with them individually. Historically, notifications in the stack have been sorted by arrival time, however this has evolved
1.2 Problem definition 5
to also be influenced by other operation system dependent factors (e.g., an assigned priority [3]).
However, the nature of mobile operating systems dictate that applications are sand-boxed [6], including their notifications, where individual applications are typically not aware of the notifications produced from other applications.
1.2
Problem definition
Notifications bring important utility to daily life, in both alerting a user of information they would likely otherwise look for (e.g., emails), as well as information they may not have otherwise considered (e.g., recommendations). However, a user will likely only find an individual notification useful in isolated contexts, yet they can receive notifications about any topic at any time. The filtering of this usefulness is largely reliant on the user, creating a cognitive burden that is accelerated with the increasing frequency and diversity of notifications [85].
Similarly to other information consumption environments, such as browsing social media feeds (e.g., [22, 125]) and email clients (e.g., [38]), current implementations of notification delivery create noise, where the information is not necessarily useful at the point in time it is seen. This not only diminishes the effectiveness of individual notifications, but any interruptions could also produce a negative effect in environments where focus is key (e.g., when driving [59]) or contribute to negative states of mind (e.g., stress [70]).
Therefore, limiting notification delivery to moments where it could be more useful is a highly desirable but challenging problem. This leads to the following question as the motivation for this thesis:
Can a notification delivery system assess and act upon an individual’s interruptive state in a similar manner to the social conventions that humans typically adopt?
6 1.3 Contributions
This question has motivated the research space in general, with studies largely focusing on improving predictive models of interruptibility through examining the accuracy improvements that different contextual factors can bring. However, approaches for collecting and labelling interruption behaviour in order to build accurate predictive models with this contextual data (i.e., the procedure for determining whether the user was interruptible or not) have had limited direct attention, with the typical conven-tions used having a number of limitaconven-tions that are susceptible to under-representing interruptibility. Discussed further in the Chapters 2 and 3, these limitations include: a heavy reliance on human annotation that is assumed to be reliable and accurate; a common focus on just observing interactions with the notification in isolation, rather than the interrupting device in general; and strict design assumptions in what makes an interruption successful.
The central approach adopted by this thesis is to embrace the fragmentation and variab-ility seen across existing studies. Motivated by the sequence of decisions that a user makes when receiving and responding to a notification [75], this thesis proposes that deconstructing how a response is made (from the point of delivery) can improve the labelling of interruptibility by separating where possible, a representation of a user’s physiological interruptive state from their sentiment towards the notification content. This intends to improve upon existing conventions for labelling interruptibility, such as relying solely on explicit user annotation through surveys, or merely knowledge that a notification has been removed (as is common in previous studies, e.g., [99, 92]), by providing a flexible basis to collect behaviour and predict interruptibility for different definitions and use cases.
1.3
Contributions
The overarching contribution of this thesis is the improvement of the typical mechanism for measuring the effectiveness of interruptions (such as mobile notifications). In
1.3 Contributions 7
doing so, this enables both consumer facing mobile applications, as well as research applications that issue interruptions (for example, experience sampling surveys for mood/well-being, e.g. [66, 11]) to define their own definition of a successful interruption and learn to deliver content at times where a successful response is likely to occur. This is formed from several individual contributions (summarised below), as a result of a survey of the literature and analysis of two in-the-wild empirical studies surrounding Android mobile notifications. Towards this thesis, these contributions have formed and extended a number of peer-reviewed research papers:
[121] Turner, L. D., Allen, S. M., and Whitaker, R. M. (2015a). Interruptibility prediction for ubiquitous systems: Conventions and new directions from a growing field. InProc. UbiComp’15, pages 801–812. ACM
[122] Turner, L. D., Allen, S. M., and Whitaker, R. M. (2015b). Push or delay? decom-posing smartphone notification response behaviour. InHuman Behavior Understanding, volume 9277 ofLecture Notes in Computer Science, pages 69–83. Springer International Publishing
[124] Turner, L. D., Allen, S. M., and Whitaker, R. M. (2017b). Reachable but not receptive: Enhancing smartphone interruptibility prediction by modelling the extent of user engagement with notifications. Pervasive and Mobile Computing
[123] Turner, L. D., Allen, S. M., and Whitaker, R. M. (2017a). Behaviour patterns in managing stacks of mobile notifications
Contributions
C1 A survey of the fragmented research area, developing open research questions by highlighting limitations and gaps in existing methodologies and conventions for collecting, labelling, and predicting interruptibility.
C2 A flexible model for labelling interruptibility for different definitions, the Decision-On-Information-Gain (DOIG) model, that deconstructs the observable behavioural
8 1.4 Thesis Structure
trace in a response to a notification.
C3 Analysis into the natural decision behaviour underpinning interactions with noti-fications, using data collected in-the-wild.
C4 Analysis into the predictability of response behaviour using past behaviour that is labelled using the DOIG model, including examining the effect of various machine learning strategies on predictive performance.
C5 A demonstration of the flexibility of DOIG the model for different notification designs and device preferences, using additional in-the-wild data.
C6 An exploration of where the DOIG model sits amongst wider notification beha-viour on the device.
Contribution C1 is relevant to [121]; C2, C3, and C4 to [122, 124]; and C5 and C6 to [123]. Across these contributions, a primary output is the proposal and validation of a labelling framework (primarily C2, C4, and C5). However the passive nature of the data collection enables further related contributions to be formed from the resulting datasets and analyses (C3 and C6).
1.4
Thesis Structure
The outline for the remainder of this thesis is as follows:
Background and research gaps: A survey and meta-analysis of relevant interruptib-ility literature, exposing key conventions used in collecting and studying interruption behaviour. Within this, a collection of research questions are proposed from gaps and limitations in the conventions exposed. A subset of these then shape the scope of the subsequent chapters. The associated chapter (2) creates contribution C1.
Proposal and implementation of a new labelling method for notifications: A flex-ible model for inferring and labelling interruptibility using the observable
behavi-1.4 Thesis Structure 9
oural trace towards interruptions is developed; called the decision-on-information-gain (DOIG) model. An empirical study using an Android application is then used to demon-strate an example implementation of the model and the benefit it brings over the existing convention for labelling interruptibility. Additionally, the procedure and challenges associated with collecting the behaviour and correlating contextual data on typical Android hardware is discussed. The associated chapters (3 and 4) create contributions C2 and C3.
Predicting decision behaviour towards notifications using the DOIG model: An ana-lysis into the relative differences in predictive performance for: a) the different labels produced by the DOIG model that represent various definitions of interruptibility, and b) different machine learning strategies, including: classifier algorithms, training strategies, and evaluation criteria. The associated chapter (5) creates contribution C4.
Examining the flexibility of the DOIG model: An empirical investigation (using a second Android application) into the practical flexibility of the DOIG model when different notification design characteristics and device preferences are used, through examining how these can modify the response process that the DOIG model can capture for labelling. The associated chapter (6) creates contribution C5.
Wider notification behaviour and implications on the DOIG model: An exploration of notification behaviour from the wider viewpoint of the notification stack, in order to determine further support for the DOIG model. With analysis surrounding: a) whether decision making in responses to notifications can also be seen from this viewpoint, and b) whether potential impacting factors in the wider behaviour may impact responses to individual notifications. The associated chapter (7) creates contribution C6.
Conclusions and future work: The thesis concludes with a reflection on the contribu-tions made, as well as a discussion of areas of future work.
Chapters 3 through 7 discuss the empirical studies conducted. These chapters are uniformly structured to firstly give an extended rationale for the chapter, discussing the
10 1.4 Thesis Structure
explicit limitations in the approaches seen in literature that are focused on, along with a section outline. From this, each group of analysis ends with a summary of the primary findings, before a closing chapter conclusion that summarises the extent to which the limitations have been improved upon and the resulting primary contributions towards this thesis.
11
Chapter 2
Background
The following survey explores the wider research area of machine-to-human interrupt-ibility, using studies surrounding interruptions from computational devices in general. The reason for this is that the research area is heavily fragmented with investigations concerning specific interruptions in specific scenarios. However broadly speaking, this does not create an entirely new research problem from that surrounding mobile notifications, with similar conventions used in study design, data collection, and data analysis.
The purpose of this chapter is twofold, firstly, to expose and classify key conventions used in the literature for: defining interruptibility, collecting data, labelling behaviour, and predicting interruptibility. Secondly, to provide insight of the wider research space, which is used as a basis for reflecting on how the contributions of the rest of this thesis (surrounding an improved framework for labelling interruptibility) may extend to other types of interruptions and environments.
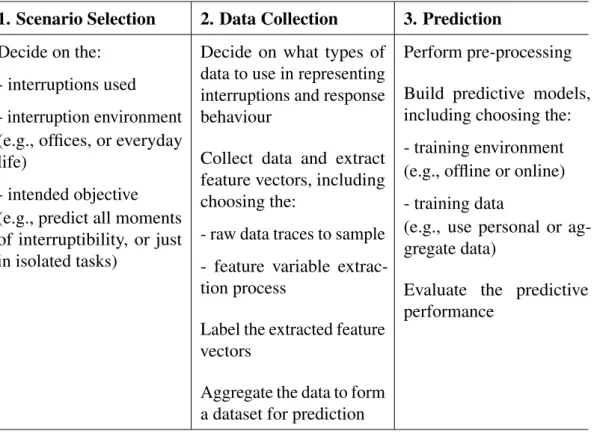
The survey is organised as follows. Firstly, the broad overarching themes in conducting research in this area are discussed, followed by an examination of the differences seen in how interruptibility has been defined across the literature. From this, the typical linear paradigm of empirical studies is explored (shown in Table 2.1), concerning: defining a scenario, collecting data, and building predictive models. Within each area, the typical design choices, assumptions, and implementation practices used are discussed, as well as the capabilities and limitations in generalising approaches.
12 2.1 Overarching themes in studying interruptibility
1. Scenario Selection 2. Data Collection 3. Prediction Decide on the:
- interruptions used - interruption environment (e.g., offices, or everyday life)
- intended objective (e.g., predict all moments of interruptibility, or just in isolated tasks)
Decide on what types of data to use in representing interruptions and response behaviour
Collect data and extract feature vectors, including choosing the:
- raw data traces to sample - feature variable extrac-tion process
Label the extracted feature vectors
Aggregate the data to form a dataset for prediction
Perform pre-processing Build predictive models, including choosing the: - training environment (e.g., offline or online) - training data
(e.g., use personal or ag-gregate data)
Evaluate the predictive performance
Table 2.1: The typical linear paradigm of interruptibility studies, including sub-components. Table extended from [121].
As part of this, 10 open research questions for the broader research space are proposed (as in [121]). The collective breadth of these questions goes beyond the scope of this thesis, however a subset of the questions help form the focus of the subsequent chapters, surrounding improving the conventions for labelling interruptibility (discussed further at the end of the survey in Section 2.6).
2.1
Overarching themes in studying interruptibility
Broadly speaking, interruptions from computational devices often result in a cognitive burden being placed on the recipient to individually assess and decide on a course of action [75]. Offloading this to systems that can proactively assess interruptibility before issuing interruptions (similar to what a human would prior to engaging in conversation, e.g., [34, 49, 126, 69]) is therefore highly desirable and forms an overarching focus
2.2 Variability in the definitions of interruptibility used 13
across the literature.
Towards this, reviews and empirical studies of interruptibility have surrounded two distinct approaches; inline with the typical study process shown in Table 2.1. Firstly, studies have encompassed interruptibility within the concepts and visions of creating attention-aware systems (e.g., [95, 101, 81, 107]). The second investigates specific relevant practices towards these systems, such as influential contextual features (e.g., [43, 97, 92, 76]) or the effectiveness of human/machine data collection (e.g., [12, 64]). In doing so, it is assumed that inappropriate interruption has a human cost (e.g., annoy-ance or cognitive burden), as does the lack of a legitimate interruption (e.g., opportunity cost). With interruptions in the right context able to augment some task-oriented envir-onments [47] or even provide productivity stimulus when self initiated [54]. Different use cases of interruptions are likely to have different priorities associated with these costs, and this is reflected in the literature with studies sometimes focusing on one or the other (discussed further in Sections 2.3.3).
Despite this, a consistent standpoint exists in the supportive role of intelligent technology and the need for accurate interruptibility prediction in order to improve this. This has resulted in increased academic interest from a wide range of disciplines including: psychology [79], human-computer interaction [75], and ubiquitous computing [101, 20, 93], as well as diverse application areas including medical [100, 62, 112] and safety [59] domains.
2.2
Variability in the definitions of interruptibility used
The purpose of inferring interruptibility is to identify (typically in situ) whether it is a suitable moment to introduce a stimulus that the user may choose to act upon. Thus, to minimise disruption and maximise timely response rates, interruptions should ideally occur at the most convenient or opportune moments. However there are degrees of freedom in what it means to be interruptible, such as being physically interruptible,
14 2.2 Variability in the definitions of interruptibility used
whether the interruption will (or will not) adversely affect a task, or whether the interruption content is considered useful. This is highlighted through the 2005 survey conducted by Ho and Intille [43], who report at least 8 definitions of interruptibility across the literature. More generally, studies can be broadly categorised under 3 groups (as defined in [121]), where the focus concerns either the:
• physiological abilityto switch focus; • cognitive effecton task performance; • oruser sentimenttowards the interruption.
Studies focusing on thephysiological abilityto switch focus surround the assessment of the cognitive workload of an individual at the time of interruption, and their capacity to receive it (i.e., whether they are physically interruptible). At the very lowest level, this can be assessed with the aid of EEG [71] or pupil size events [9, 13], although achieving this outside of controlled conditions is currently not a practical basis for measurement. Studies focusing on thecognitive effecton task performance surround the assessment of the likely effects the interruption will have on task performance. This has typically been adopted in task-oriented environments through identifying breakpoints where disruption is minimised (e.g., [50, 80]). These studies may not predict a user’s interruptibility, but instead the effect it has on the task. A common measure used for this is the elapsed time to regain focus after the interruption, referred to asresumption lag(e.g., [50, 8, 80, 51]). Studies focusing on theuser sentimenttowards an interruption surround the assessment of the user’s desire to react and consume the interruption (rather than the effect on the current task). This can involve more subjective opinions captured using self reports, termed experience sampling methods (ESM) (e.g., [99, 92]). However, degrees of freedom can be seen within this, with some studies distinguishing betweenattentiveness
(e.g., [97, 92]) towards an interruption (i.e., whether the whether the user decides to attend to the interruption) andreceptivenesstowards the interruption content (e.g., [29]). Table 2.2 classifies relevant works of note under these categories and Figure 2.1
visual-2.2 Variability in the definitions of interruptibility used 15 2002 2003 2004 2005 2006 2007 2008 2009 2010 2011 2012 2013 2014 2015 2016 Year 0 2 4 6 8 10 12 14 16 Number of studies
Physiological Ability Cognitive Affect User Sentiment
Figure 2.1: Definition groups over time. Figure extended from [121]. ises their prominence over time. Within this, some studies consider multiple categories and others do not define an explicit definition of interruptibility; in these cases a judge-ment is made from the information provided. Overall, there is clear fragjudge-mentation across the groups with all three being continually used over time to some degree. The small number of studies examining the physiological ability to switch focus is notable, but likely due to the complexities of data collection (e.g., requiring hardware to enable EEG readings [71]). Additionally, research into human physiology and cognitive inter-ruptions is also present in other domains such as neuroscience (e.g., [25, 27]), which is not included in this meta-analysis.
The high proportion of studies focusing on the cognitive effect on task performance or user sentiment remains consistent over time. A likely cause for this is the different experiment scenarios being used, in which only a specific definition may be relevant. For example, nurses working in an emergency facility are more likely to be concerned with the effect on task performance rather than their desire to receive it (e.g., [100]), while office environments (and mobile notifications in general) are relevant to both user sentiment and the cognitive affect on workload, depending on the interruption content.
16 2.2 Variability in the definitions of interruptibility used
Definition Focus Environment Contextual Data Labelling
Year PA CE US COE EI II EUS RS SS EOS IIO RSL
[80] 2002 X X X X [47] 2002 X X X X [44] 2003 X X X X X [48] 2003 X X X X X [82] 2004 X X X X X [46] 2004 X X X X [8] 2004 X X X X X X X [32] 2004 X X X [15] 2004 X X X [42] 2004 X X X X [57] 2004 X X X X [33] 2005 X X X X [9] 2005 X X X X [31] 2005 X X X X X [45] 2005 X X X X [43] 2005 X X X X [50] 2006 X X X X [101] 2006 X [14] 2006 X X X X X X X [58] 2006 X X X X [71] 2007 X X X X X [119] 2007 X X X X [51] 2008 X X X X X X [13] 2008 X X X X X [104] 2009 X [17] 2009 X [54] 2009 X X X X [29] 2010 X X X X [53] 2010 X X X X X [130] 2010 X X X [36] 2010 X X X X [113] 2011 X X X X [118] 2011 X X X X [30] 2011 X X X X [102] 2011 X X X X X [65] 2012 X X X X [55] 2012 X X X X [81] 2013 X [107] 2013 X [37] 2013 X X X X X X [115] 2014 X X X
2.2 Variability in the definitions of interruptibility used 17
Definition Focus Environment Contextual Data Labelling
Year PA CE US COE EI II EUS RS SS EOS IIO RSL
[97] 2014 X X X X [99] 2014 X X X X [111] 2014 X X X X [105] 2014 X X X X X X [92] 2014 X X X X X [18] 2014 X X X X [91] 2015 X X X X [59] 2015 X X X X [122] 2015 X X X X [19] 2015 X X [89] 2015 X X X X [21] 2015 X X X X X [114] 2015 X X X X [129] 2015 X X X X X X X [61] 2015 X X X X X [94] 2015 X X X X [67] 2015 X X X X [76] 2015 X X X X X [87] 2015 X X X X X X [116] 2015 X X X X [72] 2016 X X X X X X X [106] 2016 X X X X [83] 2016 X X X X [24] 2016 X X X X X [108] 2016 X X X X X [77] 2016 X X X X X X X [56] 2016 X X X X
Table 2.2: A decomposition of the approaches used across studies for: defining in-terruptibility, the experiment environment, collecting contextual data, and collect-ing interruptibility labels, sorted ascendcollect-ing by year. Some studies can include the use of multiple types of approaches (e.g., if different experiments are performed). PA=Physiological Ability, CE=Cognitive Effect, US=User Sentiment as defined in Section 2.2. COE=Controlled environment, EI=Explicit “in-the-wild” envir-onment, II=Implicit “in-the-wild” environment as discussed in Section 2.3.2 and defined in Table 2.3. EUS=Explicit User Surveys (i.e., ESM), RS=Real world ma-chine data sources, SS = Simulated data sources, as discussed in Section 2.4.2.1 and shown in Figure 2.4. EOS=Explicit opinion from in situ surveys (i.e., ESM), IIO=Implicit in situ observations of behaviour, RSL=Retrospective labelling, as discussed in Section 2.4.1 and shown in Figure 2.3. Table extended from [121].
18 2.3 Scenarios and interruptibility
Overall, there is a clear disparity in what constitutes interruptibility. The ability to categorise this is useful for synthesising studies, however a problem still remains in that the choice here impacts upon the rest of a study (i.e., data collection and labelling) and ultimately the conclusions made. This issue is a motivation in the focus of the remaining chapters of this thesis surrounding a flexible framework for labelling interruptibility for different definitions where possible; this is discussed further at the end of the survey in Section 2.6.
2.3
Scenarios and interruptibility
The first dimension of interruptibility studies is defining the scenario. At its highest level, this captures the scope, by defining achannel of interruption(such as mobile notifications), thestudy environment(which addresses the physical context in which the interruption is studied), and theobjective for the study.
2.3.1
Choice of interruption
In general, studies typically investigate using a single type of interruption from a single source. This ranges from messaging communications (e.g., instant messaging [97, 37, 21] or email [53, 56, 61]); to audio recordings (e.g., [32, 31]); to pop-up messages during device usage (e.g., [33, 116, 129, 85]); to phone calls (e.g., [30, 111, 106]); and to mobile notifications in general (e.g., [92, 99, 83, 76, 114, 24]). However, our daily lives typically involve multiple devices that can interact with us in more than one way, these devices may have multiple means of interaction, they may be restricted by place or time, and multiple devices can exist at the same time. Exploring how interruptibility can be affected by issuing interruptions through different channels and devices (i.e., predictinghowto best interrupt, as well aswhen) has been a relatively unexplored area, which leads to the following an open research question:
2.3 Scenarios and interruptibility 19
(RQ1) How can different channels of interruption (and potentially devices) be used in combination and to the best effect?
Towards addressing this, Sarter [107] reviews interruption management in a multi-modal context, and proposes the use of different interruptive cues based on characteristics of the current activity and the type of interruption, however does not test these with empirical experiments. Additionally, Okoshi et al [89] experiment with introducing mobile interruptions onto smart watches in addition to the smartphone. However more empirical work in this area is needed, particularly involving direct comparisons of delivering interruption content through different cues and devices. This goes beyond the scope of this thesis, which surrounds mobile notifications on a single device, however it remains a direction of future work.
2.3.2
Choice of study environment
Experiment environments have ranged from all moments of daily life (e.g., through a personal smartphone [92, 115]) through to a more specific focus, such as those with high social costs (e.g., during collaborative working [40, 60]) or where task disruption is likely to occur, (e.g., in offices [31, 82]). More generally, experiment environments are eithercontrolledorin-the-wild, as defined in Table 2.3, with variability in what constitutes an in-the-wild environment. While controlled environments have traditionally involved a laboratory setting (e.g., [51, 55, 8]), static office settings may also fall into this category. For example, in cases where a third party observer is present (e.g., [54]) or when cameras are added to an existing environment (e.g., [31, 58]). Table 2.2 classifies existing literature into these different types of environments, with Figure 2.2 visualising this over time. There is a clear recent increase in experimenting in-the-wild, this likely due to the spatial and temporal freedom that ubiquitous technologies such as the smartphone have enabled. However, controlled environments still remain a popular design choice for experiment scenarios involving set tasks over a finite time
20 2.3 Scenarios and interruptibility
Type Definition
Controlled environment
The experiment typically takes place in a single static location (e.g., a laboratory setting), involving simula-tions of activities and interrupsimula-tions. Participants are typically compensated for their time, but not always. Explicit in-the-wild
The experiment takes placein situaround the daily lives of the participants. However, the user is con-tinually aware of the experiment (e.g., if a dedicated mobile application is used to issue interruptions sur-veying interruptibility [92]). The participants are typically incentivised through compensation for their time, but not always.
Implicit in-the-wild
The experiment takes placein situaround the daily lives of participants. The experiment is often embed-ded through other features that the participant finds useful (e.g., if a mobile app is used that also offers additional features to the user, such as a mood diary [99]), providing more natural incentive than explicit compensation.
Table 2.3: Common types of experiment environments used. Table extended from [121].
period (e.g., [37]), and where additional technologies need to be introduced into the environment (e.g., external cameras [91]).
2.3.3
Choice of study objective
The objective for a study concerns what is trying to be predicted in relation to the choice of interruption and environment. For example, some works focus on classifying any given moment as either suitable for a particular interruption or not (e.g., [30, 99, 92, 76, 122, 72]), while others focus on exploring the effects of interruptions (e.g., [50, 13]). There are also studies with a more specific focus, such as predicting the timeliness of instant messages being read (e.g., [97]) or the time it takes for a user to resume to their previous task (e.g., [50]).
2.3 Scenarios and interruptibility 21 2002 2003 2004 2005 2006 2007 2008 2009 2010 2011 2012 2013 2014 2015 2016 Year 0 2 4 6 9 11 13 16 Number of studies
Controlled Environment Explicit In-The-Wild Implicit In-The-Wild
Figure 2.2: Use of different experiment environments over time. Figure extended from [121].
Overall, the scenarios for studying interruptibility can be seen as being heavily domain and interruption type specific. This creates a problem in that the choices made here have a profound effect on the later stages (e.g., what data is collected) and ultimately on interruption prediction systems in the evaluation criteria chosen (i.e., prioritising the minimisation of false positive or false negative predictions, or both). This creates uncertainty in assessing the wider applicability for other scenarios [107], which could require costly implementation and testing to determine. Therefore, another open re-search question remains in whether a one-size-fits-all framework can be achieved, or whether conclusions are limited to being tightly coupled with specific scenarios:
(RQ2) Given the diversity of potential scenarios, when are generalised and interoper-able solutions for interruptibility sufficient, and when are domain specific solutions necessary?
Little progress has so far been made towards addressing this issue directly, with works either presenting either broad frameworks that represent an interruption as a general concept (e.g., the Interruption Management Stage Model [73, 75]) or isolating their
22 2.4 Data collection and labelling
investigations to specific channels of interruption (e.g., all smartphone notifications [99, 92, 76]). This research question inspires the focus in the remainder of this thesis, in considering multiple definitions of interruptibility in labelling, through to assessing the relative differences in predictive performance for different labels with different evaluation criteria.
2.4
Data collection and labelling
Towards predicting interruptibility, empirical studies require the collection of a dataset of previous interruptions where the interruptibility of the user is known (or the effects task performance are known). In this data, each interruption is typically represented by a vector of variables that capture the context at a given moment, and a label representing some categorisation of interruptibility (e.g., interruptible, or not interruptible). However within this, there are considerable degrees of freedom in how this is achieved.
2.4.1
Strategies for labelling interruptibility
The label used to denote interruptibility is often tightly coupled with the definition of interruptibility used and the objective of a study. However these labels ultimately represent interruptibility as either a binary state (e.g., [105]) or on a scale (e.g., [113, 92]) with some threshold then used to convert it to a binary state. This then represents whether the interruption should or should not have occurred.
In order to retrieve this label, some form of labelling task needs to take place after an interruption has been issued. However accomplishing this accurately and reliably can be problematic. Three different approaches are dominant in the literature,explicitand
implicit labelling by the user being interrupted (performed in situ, e.g., [116, 122, 92]), orretrospectivelabelling that occurs after the data collection (e.g., [48, 67]).
2.4 Data collection and labelling 23
Explicit labellingis typically performed directly by the user in situ through self-reporting (ESM) (e.g., [43, 31, 36, 30, 129, 116]). For example, Choy et al [24] ask the user the binary question “Are you interruptible?”, whereas others ask the user provide a response on a scale, e.g., Pejovic and Musolesi [92] ask “Is this a good moment to interrupt?”. With retrospective labelling also formed from user opinion (e.g., [48, 57]). However, it is questionable whether a user can accurately and consistently quantify their interruptibility [111], either in real time (e.g., [43, 31]) or retrospectively (e.g., [91]). Additionally, a user may be interruptible, but not to the extent that they wish to complete the labelling task [48, 72] (e.g., Pejovic et al. [94] only had 36% of their surveys completed), or they may find doing so undesirable (e.g., if they respond and fill in a survey, but can state that they are not at all interruptible [116, 129, 92]); leading to some dedicated studies that focus on finding opportune moments to issue surveys (e.g., [83, 78]).
Alternatively,implicit labelling(e.g., [24]) involves observing user actions and making deductions (e.g., [30, 97]) rather than relying on user annotation. For example, for studies focusing on user sentiment towards mobile interruptions (discussed in Sec-tion 2.2) this has included observing whether a phone call is answered (e.g., [111]) or a notification is tapped on (e.g., [97]). However this loses the benefit of human opinion and may not be feasible in environments where this behaviour cannot be observed by machine sources.
The extent that these different types of labelling methods occur in the literature is shown in Table 2.2, with Figure 2.3 visualising this over time. From this, it is clear that retrospective labelling has not been widely used in recent years, likely due to technological advances enabling participant feedback in situ as opposed to relying on video recordings (e.g., [44, 67]). Interestingly, the debate of using ESM or implicit observations of behaviour is reflected in the consistent use of both techniques over time. Across all of the methods used, a primary limitation has been to rely on some final action being performed by the user. For example, if human annotation is used, this relies on the
24 2.4 Data collection and labelling 2002 2003 2004 2005 2006 2007 2008 2009 2010 2011 2012 2013 2014 2015 2016 Year 0 2 4 6 8 10 12 14 Number of studies
Experience Sampling Implicit Observations Retrospective
Figure 2.3: Use of different labelling strategies over time. Figure extended from [121].
individual being willing to complete a survey (e.g., [99, 92, 116, 129, 24]). If implicit observations are used, this has typically relied on some action being reached, such as a mobile notification being tapped on, or application opened (e.g. [97, 18, 111]). However, in some scenarios, the response process could involve multiple steps. Additionally, as with Android mobile notifications, it may be the case that not all information is available to the user initially (e.g., the source application or exact content) until the user performs additional interactions with the device.
This could therefore result in responses that are started but then abandoned, where arguably some degree of interruptibility is shown, i.e., the user was physically reachable for interruptions in general, but not receptive to the particular interruption [21]. These cases may be incorrectly classified as not interruptible because, for example, the user did not complete the survey. Investigations into the importance of incomplete responses has received little attention, leading to the following research question:
(RQ3) Can including the extent of a response to an interruption provide additional semantic value for inferring the user’s attentiveness towards it?
2.4 Data collection and labelling 25
Across the literature there is a foundation of key works introducing relevant concepts. Firstly, McFarlane and Latorella show that the act of interrupting and responding is a decision process [74], however this stops short of modelling the response process between switching to the interruption and returning to the previous task. Additionally, as discussed in Section 2.2, several works (e.g., [97, 92, 29]) have proposed concepts such as attentivenessand receptivityin order to separate willingness to consume an interruption and liking the content. However, there has been little empirical investigation into the viability of a framework that labels interruptibility using different definitions from a trace of response behaviour, and by extension the impact that this has on prediction. This forms a key focus in the subsequent chapters of this thesis.
2.4.2
Capturing contextual data
The usefulness of the interruptibility label produced is ultimately tied to its ability to be predicted from contextual data. Therefore a key design consideration is the choice of what data to capture and how, which can include data representing the current moment (e.g., [72, 99]) as well as historical activity (e.g., [24]).
2.4.2.1 Common contextual data traces collected
Capturing signals to represent the current context is an essential component in predicting interruptibility (or the effects of interruptibility). Table 2.4 details the types of data traces commonly collected in the literature, classified as being from either external sources to an individual or more latent. These can loosely be described as capturing
what is currently happeningandhow the user feelsrespectively. Ideally, this data should be as rich as possible, however resource constraints and scenario environments typically dictate a subset of these being used (as shown in Table 2.4). Collection of this data can involve the use of explicit human annotation through surveys (likewise to labelling), real world machine sources, or in some cases, simulated data; with Table 2.2 and Figure 2.4
26 2.4 Data collection and labelling
Source Example data traces and studies
External
Smartphone sensors: such as hardware sensors (e.g., [115, 59, 97, 99, 105, 92, 30, 102, 89, 72, 24, 108, 76, 77, 83]) and/or software APIs (e.g., [65, 115, 97, 111, 30, 18, 102, 77, 106, 21])
Other physiological sensors: capturing physical state (such as heart rate) (e.g., [59, 105]) or activity (e.g., [105, 57, 43])
Other environmental sensors: such as sound or motion in a room (e.g., [82, 32, 48, 15, 44, 45]) or car (e.g., [59])
Software events: e.g., active windows, keyboard and mouse activity (e.g., [50, 51, 55, 82, 32, 118, 80, 42, 15, 44, 46, 45, 33, 116, 61, 85, 72]) Calendar schedules: (e.g., [113, 115, 44, 106])
Temporal logs: e.g., of user actions (e.g., [55, 65, 97, 45, 106])
Spatial logs: e.g., GPS (e.g., [113, 115, 111, 105, 30, 102]) or connections to antennas (e.g., [82, 99, 111, 92, 46])
Latent
Self reports: experience sampling (e.g., [29, 91, 82, 119, 105, 92, 47, 51, 57, 43, 94, 76, 108]) or post-experiment surveys (e.g., [8, 37, 54])
Qualitative feedback: e.g., post-interviews (e.g., [29, 47])
Third party observer reports: e.g., in situ observation (e.g., [54]) or video annotations (e.g., [48, 57, 31, 67])
Physiological sensors: e.g., mental state or workload (e.g., [71, 9, 105, 13, 72, 129])
Table 2.4: A categorisation of commonly captured data traces. Table extended from [121].
showing the use of these different practices over time.
Advances in ubiquitous sensing (such as mobile devices) is a likely cause of the rise in the use of real world machine sources, such as sensors (e.g., [99, 15]) and experience sampling (e.g., [92]) over simulated sensors (e.g., [48, 31]) in recent years (Figure 2.4). Additionally, the personal relationship between these devices and their user has been argued to allow more “ecologically valid data" [79], rather than using peripheral devices, such as external cameras (e.g., [48, 31]) or wearable accelerometers (e.g., [43, 57]). However there is still disagreement over whether sensors should be used [92, 99, 115] or not over user annotation (e.g., through ESM), due to accuracy and reliability concerns [113, 64, 105], resource requirements [111], and limitations for measuring latent variables.
2.4 Data collection and labelling 27 2002 2003 2004 2005 2006 2007 2008 2009 2010 2011 2012 2013 2014 2015 2016 Year 0 1 3 5 7 8 10 12 14 16 Number of studies
Experience Sampling Real Sensors/Software Events Simulated Sensors
Figure 2.4: Use of different data collection strategies over time. Figure extended from [121].
However, human involvement either from a third party observer (e.g., [48, 57]) or by the participant themselves (e.g., [47, 119, 91]) has also been argued to suffer from similar issues (e.g., [82, 91, 72]). On one hand, it has benefits including being highly flexible in what can be asked, having a low cost overhead in terms of technical resources, and allowing the collection of latent variables (e.g., mental state) which aren’t easily ob-servable by readily available sensors [64]. However, the use of ESM for interruptibility research specifically has been controversial due to the additional interruption cost it places on the user [30, 72, 78]. Overall, likewise to labelling, the use of explicit human annotation and/or implicit machine sources remains a contested issue.
Beyond this debate, a trend in recent years is the consolidation of technologies used to collect this contextual data, such as only using a smartphone (e.g., [92, 99, 30]). However the emergence of networked pervasive technologies in the environment (i.e., the Internet of Things) and upon the person (i.e., smart wearables), could lead to this becoming unconsolidated once more with these technologies augmenting existing data traces. For example, a light sensor in a room may be more consistent and accurate
![Figure 2.1: Definition groups over time. Figure extended from [121].](https://thumb-us.123doks.com/thumbv2/123dok_us/9066323.2804821/45.893.244.707.150.492/figure-definition-groups-time-figure-extended-from.webp)
![Figure 2.2: Use of different experiment environments over time. Figure extended from [121].](https://thumb-us.123doks.com/thumbv2/123dok_us/9066323.2804821/51.893.250.700.143.477/figure-use-different-experiment-environments-time-figure-extended.webp)
![Figure 2.3: Use of different labelling strategies over time. Figure extended from [121].](https://thumb-us.123doks.com/thumbv2/123dok_us/9066323.2804821/54.893.185.637.146.476/figure-use-different-labelling-strategies-over-figure-extended.webp)
![Figure 2.4: Use of different data collection strategies over time. Figure extended from [121].](https://thumb-us.123doks.com/thumbv2/123dok_us/9066323.2804821/57.893.252.699.149.483/figure-use-different-data-collection-strategies-figure-extended.webp)
![Figure 3.4: The main UI screen for the ImprompDo app after initial setup. Figure from [122].](https://thumb-us.123doks.com/thumbv2/123dok_us/9066323.2804821/85.893.358.600.140.470/figure-main-ui-screen-imprompdo-initial-setup-figure.webp)