the leafy head of Chinese cabbage
(Brassica rapa)
Promotors Dr A.B. Bonnema
Associate Professor, Plant Breeding, Wageningen University & Research Prof. Dr R.G.F. Visser
Professor of Plant Breeding Wageningen University & Research
Other members
Prof. Dr G.C. Angenent, Wageningen University & Research Prof. L. Ostergaard, John Innes Centre, Norwich, United Kingdom Dr M.J. Caldas Paulo, Wageningen University & Research
Dr H. Huits, Bejo Zaden B.V., Warmenhuizen, the Netherlands
This research was conducted under the auspices of the graduate school Experimental Plant Science
the leafy head of Chinese cabbage
(Brassica rapa)
XiaoXue Sun
Thesis
submitted in fulfilment of the requirements for the doctor degree at Wageningen University
by the authority of the Rector Magnificus, Prof. Dr A.P.J. Mol,
in the presence of the
Thesis Committee appointed by the Academic Board to be defended in public
on Monday 19 November 2018 at 11 a.m. in the Aula.
Morphological and genetic characterization of the leafy head of Chinese cabbage (Brassica rapa),
152 pages.
PhD thesis, Wageningen University, Wageningen, the Netherlands (2018) With references, with summary in English
ISBN 978-94-6343-502-4
Chapter 1 1
General introduction Chapter 2 15
Genetic analysis of Chinese cabbage reveals correlation between rosette leaf and leafy head variation Chapter 3 35
Genome wide transcriptome analysis reveals molecular pathways involved in leafy head formation of Chinese cabbage (Brassica rapa) Chapter 4 57
Morphological differences at cellular level between heading and non-heading B. rapa accessions Chapter 5 77
Allelic variation of the Chinese cabbage domestication gene BrARF3.1 affects leaf phenotypes Chapter 6 99
General discussion References 108
Summary 124
Acknowledgements 127
About the author 131
Brassicaceae
The Brassicaceae family is one of the largest families in the angiosperm plant kingdom, which comprises 370 genera and over 4000 species in some 10 poorly defined tribes (Bonnema et al., 2011). Several species of great scientific, economic and agronomic importance are included, such as the model species Arabidopsis thaliana, as well as many widely cultivated species, for example Brassica oleracea (cabbage, cauliflower, turnips), B. rapa (Chinese cabbage, turnips, pak chois) and B. napus (oilseed rape, rutabaga, canola).
A. thaliana is a model plant species for its small genome size (2n=10), short generation cycle and ease of transformation (Koornneef & Scheres, 2001). The work on A. thaliana has revolutionized our knowledge in almost every field of modern plant biology. Many public resources are available and the molecular regulation of many biological processes is well studied with the function of many genes known. The genus Brassica is a monophyletic group, which is evolutionarily closely related to this model crucifer plant A. thaliana, and is reported to have diverged almost 14.5-20.4 million years ago (Hong et al., 2008; Cheng et al., 2013). Therefore, comparative experiments between most Brassica plants and A. thaliana are generally very informative to understand the molecular regulation of phenotyic variation and developmental processes. However, several cultivated Brassica species have special phenotypes, like tubers (turnips), leafy heads (cabbage or Chinese cabbage) and enlarged inflorescences (curds of cauliflower), which are absent in A. thaliana.
Triangle of U species
Brassica species (broccoli, cabbage, canola) and A. thaliana share a common ancestor ~43 million years ago (MYA) (Mark et al., 2010). After divergence, a whole genome triplication (WGT) event occurred between 13-17 million years ago (MYA) from which the different Brassica species evolved (Town et al. 2006). The genomes of some Brassica species (eg. B. oleracea, B. rapa and B. napus) are sequenced and supports the theory for the comparative genomic study for Brassica species (Wang et al., 2011; Chalhoub et al., 2014; Liu et al., 2014; Parkin et al., 2014). The three different sub-genomes have evolved at different rates, with the Least Fractionated (LF) retaining most genes and, Medium Fractionated 1 (MF1) and Most Fractionated 2 genomes (MF2) having lost more genes (Wang et al., 2011; Cheng et al., 2012). The rates of genome fractionation, block reshuffling and chromosome reduction in these three sub-genomes are different (Cheng et al., 2012; Tang et al., 2012).
In addition to WGT and hybridization, domestication and breeding also contributed to the extreme morphotypes in Brassica (Bonnema et al., 2011; Cheng et al., 2016). The Brassica genus includes six major economically important interrelated species, each with considerable morphological variation as the result of local selection and breeding. The three diploid species are B. rapa (2n=20, genome AA), B. nigra (2n=16, genome BB) and B. oleracea (2n=18, genome CC). From the cytogenetic relationships of the Brassica species it is evident that there are three amphidiploids derivatives, B. juncea (2n=36, genome AABB, brown mustard), B. carinata (2n=34, genome BBCC), B. napus (2n=38, genome AACC, oilseed rape), evolved after hybridization and polyploidization of two of the diploid species (Ashraf & McNeilly, 2004). The genetic relationship between species in the Brassica family is described by the confirmed evolutionary theory called the ‘Triangle of U’ (U, 1935) (Figure 1).
Figure 1. ‘Triangle of U’ described
the genetic relationship between six Brassica species. According to the theory, three diploid ancestral species B. rapa (AA), B. nigra (BB) and B. oleracea (CC) are represented by different colors. Three amphidiploid species B. juncea (AABB), B. napus (AACC), B. carinata (BBCC) derived from each pair of the three diploid species (U, 1935).
Recently, it was proposed to expand the triangle of U into a multi-vertex model by speciation and hybridization. Several new species or crop types were suggested to be added, such as Raphanus, Rapisturm and Sinapis (Cheng et al. 2017). Most Brassica species display an enormous variation, ranging from leafy heads, large storage tubers, enlarged arrested inflorescences to abundant seed yields. The model species Arabidopsis lacks this huge variation (Koch et al., 2008).
Brassica rapa
Brassica rapa originated in the Middle east/crescent belt area and is cultivated worldwide in most continents (Li, 1981; Gomez-Campo & Prakash, 1999; Bonnema et al., 2011). The genome of B. rapa (n=10) is diploid and is the first Brassica genome that was sequenced. In total, the estimated genome size of B. rapa is 485 Mb and the genome contains 41020 genes (Wang et al., 2011; Cai et
al., 2017). Brassica vegetable crops are characteristic for their lower levels of saturated fat and high values of fiber, secondary metabolites like glucosinolates and vitamins, which contribute to a healthy diet.
Sub-species in Brassica rapa
B. rapa consists of various subspecies that are often referred to as morphotypes: ssp. chinensis (pak choi), ssp. pekinensis (Chinese cabbage), ssp. parachinensis (caixin), ssp. rapa (turnip), ssp. trilocularis (yellow sarson), ssp. oleifera (oil seeds), ssp. narinosa (wutacai) and ssp. nipposinica (mizuna) (Gómez-Campo, 1999) (Figure 2). These subspecies display enormous variation, such as leafy heads, enlarged hypocotyls/roots, stems, inflorescences, axillary shoots and oilseeds.
Figure 2. Morphotypes of sub-species in B. rapa
Five important B. rapa crops are the leafy vegetable crops ssp. pekinensis, ssp. chinensis, ssp. parachinensis, the tuber crop ssp. rapa and theoilcrop ssp. oleifera (Chi-meng, 1979; Van Wyk, 2005). Pak choi (ssp. chinensis), which originated in Southeast Asia has long been cultivated in China and Japan. The edible part of pak choi is the young plant with green small leaves and white petioles. The closely related Chinese flowering cabbages (ssp. parachinensis) have elongated flowering shoots and fleshy stems with pak choi like leaves which form the edible parts. Turnips (ssp. rapa), as one of the oldest cultivated tuber crops, have a fleshy and globe shaped hypocotyl as a storage organ. Their tubers and young leaves are cooked as dishes in Europe. Tubers are also used as fodder crop (Reiner et al., 1995; Vogl-Lukasser et al., 2007). There are in fact two different groups of turnips, suggesting that they were domesticated twice: the Japanese turnips are annual, while European turnips are biannual (Gómez-Campo, 1999; Zhang et al., 2014). Chinese cabbages (ssp. pekinensis) represent an important leafy vegetable crop with a long history of cultivation in East Asia. The flat leaves fold together to form a leafy head. The general theory is that heading Chinese cabbages have been domesticated from non-heading leafy pak choi in China (Tan, 1979; Li, 1981). Oil
seed (ssp. oleifera) types are annual (sarsons) or biannual (winter oils). The seeds are used for edible oil extraction (Kuvshinov et al., 1999).
The different B. rapa accessions were clustered into three groups based on genetic diversity studies (Zhao et al., 2005 & 2010). Broccoletto accessions and most European origin turnips adn biannual oils were assigned to one group. Annual oil type accessions, mainly from India and Bangladesh were assigned to the second group and group three is a group of Asian crop types. However, like in the study of Pino Del Carpio et al. (2011), group three (Asian crop types) is represented by two sub groups, one comprising of Chinese cabbage, and the other of Asian turnips and pak choi.
Heading and non-heading leafy vegetables in B. rapa
Two important leafy vegetables are the non-heading pak choi (B. rapa ssp. chinensis) and the heading Chinese cabbage (B. rapa ssp. pekinensis) (Figure 3A). When we compare the vegetative developmental stages of heading Chinese cabbage and the non-heading pak choi, the Chinese cabbage develops first a rosette, followed by a leaf folding stage and finally forms a leafy head (Yu et al., 2000). In contrast, the pak choi does not form a leafy head after rosette stage and forms clusters of loose green leaves with long fleshy petioles (Hanson et al., 2009). Compared to the flat non-heading pak choi leaves, Chinese cabbage heading leaves grow upward with white and broad mid vein and display inward curvature (Figure 3B). Chinese cabbages have been domesticated for some clear advantages for consumers and traders, such as their high yield and good cold tolerance, ease in transport and long-time storage (Daly & Tomkins, 1997). As I am interested in leafy head development in Chinese cabbage, I will first review what is known about leaf development in the model plant A. thaliana.
Figure 3. Developmental stages and leaf phenotypes for heading Chinese cabbage and non-heading pak choi. (A) Developmental stages from seedling stage to mature plants. (B) Leaf phenotypes for mature Chinese cabbage and pak choi. Upper panel is Chinese cabbage, lower panel is pak choi.
Leaf development
Leaves are important plant organs and provide the basis for plant growth. Through photosynthesis, leaves absorb sunlight and convert it into energy (Gonzalez et al., 2012). For food crops, improvement of the capacity and efficiency of this process plays a major role in increasing in yield production (Zhu et al., 2010; Harbinson et al., 2012; Van Rooijen et al., 2017). The photosynthesis capacity is strongly influenced by the leaf size and leaf shape and also leaf orientation (Demmig-Adams et al., 2017). In addition, leaves sense the external environment, like light intensity, temperature and day length (Parkhurst & Loucks, 1972; Haworth & McElwain, 2008; Song et al., 2013; Sun et al. 2018).
Leaf cellular structure
The cells of a leaf are arranged as a sandwich, with two outer epidermal layers surrounding the mesophyll zone in the middle (Figure 4). The epidermis provides the leaf with a waxy layer and protects against water loss. The only way for gas exchange is through stomata, with the majority positioned on the lower epidermis of the leaf. The tissue between the epidermal cells (mesophyll layers), contains large numbers of chloroplasts that turn sunshine into carbohydrates. The mesophyll layer is composed of the palisade layer with palisade cells located on the adaxial side (upper side) of the leaf and the spongy parenchyma cells located at the leaf abaxial (lower) side. The palisade cells are tightly packed, oblong, with one small end facing the upper epidermis and the long ends squeezed in side-by-side. They have been arranged to maximally capture the sunlight and contain many chloroplasts. The spongy cells are irregularly shaped, less ordered, loosely arranged and leaves large intracellular spaces for carbon dioxide (CO2) and
oxygen (O2) exchange. Among the spongy tissue, the vascular bundles are formed
which are composed of two different types of “transport ” tissue, xylem and phloem vessels. These two tissues consist of typically long and slender cells. The xylem cells transport water and dissolved minerals to the leaves, while the phloem transports the photosynthetic products to the other parts of the plant.
Figure 4. Cellular structure of C3 plant leaf, showing the cuticle, epidermis cells, palisade parenchyma, spongy parenchyma, vascular bundles, stomata and guard cells. Left part is a cartoon diagram (leaf figure is modified from http:// redslime.typepad.com/i/adaptations-of-plant-leaves.html), right part is a B. rapa (Chinese cabbage) leaf cross section.
Leaf developmental processes and genetic control in Arabidopsis
The development of a leaf is a complex process that is regulated by several pathways. In A. thaliana, the leaves are initiated from the shoot apical meristem (SAM) and growth involves six overlapping and interconnected phases: leaf primordium initiation, leaf polarity formation (adaxial/abaxialization), cell division, transition phase, cell expansion and cell differentiation into stomata, vascular tissue and trichomes (Kalve et al., 2014). During these processes, several hormonal pathways, like auxin, cytokinin (CK) and gibberellic acid (GA) pathways regulate the development of the leaf. Auxin maxima define leaf initiation and auxin gradients play a role in ad/abaxial polarity and leaf growth (Qi et al. 2014).
The SAM is organized in three layers: central zone (CZ), peripheral zone (PZ) and rib zone (RZ). The cells in the peripheral zone can differentiate into leaf primordia. This cell differentiation decision involves dynamic gradients of the signaling molecule auxin (Benková et al., 2003) and is governed by the plant hormones auxin, cytokinin and gibberellin. The genes AUXIN RESISTANT (AUX1) and PIN-FORMED1 (PIN1), Class I KNOTTED1-LIKE HOMEOBOX (KNOX1) and GA20-oxidases play important roles in leaf initiation. KNOX proteins initiate and maintain the SAM by promoting cytokinin biosynthesis and repressing GAs by down-regulating the GA20-oxidase gene (Sakamoto et al., 2001; Jasinski et al., 2005; Byrne, 2012). The influx carrier AUX1 and efflux carrier PIN1 orient the
auxin transport from cell to cell to create auxin maxima (Bayer et al., 2009; Guenot et al., 2012) thereby promoting leaf primordia formation.
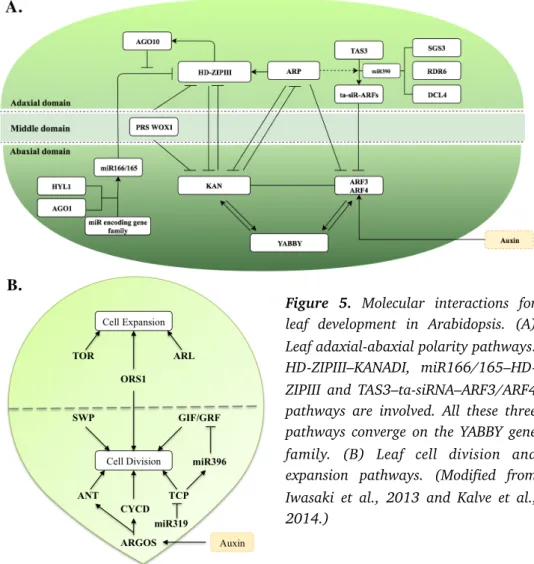
After leaf initiation, the developing leaf primordium establishes upper (adaxial), middle and lower (abaxial) domains. The adaxial-abaxiality reflects positional differences in the leaf blade, which are established by the leaf polarity pathway
(Figure 5A). PHAVOLUTA (PHV), REVOLUTA (REV) and PHABULOSA (PGD),
which encode class III HOMEODOMAIN–LEUCINE ZIPPER (HD-ZIPIII) transcription proteins, determine the adaxial fate and have an antagonistic relationship with the abaxial determinants KANADI (KAN1, KAN2 and KAN4) (Byrne, 2006; Ariel et al., 2007). Together with KAN, members of the YABBY gene family (FIL, YAB2, YAB3 and YAB5) and ARF3, ARF4 are involved in leaf abaxial fate specification (Bowman et al., 2002; Eshed et al., 2004). KAN and ARF3-ARF4 proteins have overlapping roles in the formation of partially adaxialized leaves (Husbands et al., 2009). The expression of FIL is up-regulated by both KAN and ARF3-ARF4 and inversely KAN, ARF3 and ARF4 are positively regulated by the activity of FIL (Eshed et al., 2004; Bonaccorso et al., 2012). Both the adaxial and abaxial determinants are regulated by small regulatory RNAs-microRNAs (miRNAs) or trans-acting short interfering RNAs (ta-siRNAs). miR165 and miR166 target the HD-ZIPIII genes on the adaxial side (Kidner & Martienssen, 2004). ta-siRNA (TAS3) accumulates on the adaxial side and forms a gradient that determines leaf polarity by targeting auxin-response transcription factors, ARF3 and ARF4 on the abaxial side (Hunter et al., 2006). This TAS3-ta-siRNA pathway is activated by RNA-dependent RNA polymerase 6 (RDR6), SUPPRESSOR OF GENE SILENCING3 (SGS3) and DICER-LIKE4 (DCL4).
The final leaf size and shape is determined by leaf cell division and cell expansion (Meyerowitz, 1997; Tsukaya, 2003) (Figure 5B). Cytoplasmic growth plays a crucial role in controlling a range of cell division and expansion events that are regulated by the Target of Rapamycin (TOR) pathway (Sablowski & Dornelas, 2014). On the basis of increasing the cell volume by cytoplasmic growth, the cell division cycle is operated by the activity of the CDKs-CYC (cyclin dependent kinases-cyclin) complex (Francis & Sorrell, 2001; Dissmeyer et al., 2009; Kalve et al., 2014). The AINTEGUMENTA (ANT) family proteins, GRF-INTERACTING FACTOR (GIF), GROWTH-REGULATING FACTOR (GRF) and TEOSINTE BRANCHED1/CYCLOIDEA/PCF (TCP) transcription factors are essential to promote cell division (Lee et al., 2009; Kim et al., 2003; Palatnik et al., 2003; Rodriguez et al., 2010). In the cell expansion phase, roles for the cell wall associated proteins EXPANSINs (EXPs), which regulate cell elongation, the TOR
pathway and ARGOS LIKE (ARL) have been described (Sampedro & Cosgrove, 2005). The cell division, which increases the number of cells, is accompanied by continued cell expansion. Some factors and genes control the transition between cell division and expansion. For example, ORGAN SIZE RELATED1 (ORS1) positively regulates cell division as well as expansion (Feng et al., 2011). ErbB-3 EPIDERMAL GROWTH FACTOR RECEPTOR BINDING PROTEIN (EBP1) positively regulates leaf growth and promotes cell division and expansion (Horvath et al., 2006). Conversely, AUXIN RESPONSE FACTOR 2 (ARF2) represses leaf growth by affecting cell division and expansion (Schruff et al., 2006). Whereas, the phytohormones like auxin, gibberellins (GA), cytokinin (CK) and abscisic acid (ABA) also impact cell division and expansion (Perrot-Rechenmann, 2010; Hu et al., 2000).
Figure 5. Molecular interactions for
leaf development in Arabidopsis. (A) Leaf adaxial-abaxial polarity pathways: HD-ZIPIII–KANADI, miR166/165–HD-ZIPIII and TAS3–ta-siRNA–ARF3/ARF4 pathways are involved. All these three pathways converge on the YABBY gene family. (B) Leaf cell division and expansion pathways. (Modified from Iwasaki et al., 2013 and Kalve et al., 2014.)
Leafy head formation in Chinese cabbage
Chinese cabbages represent an important leafy vegetable with high yield and great storability (Liu et al. 2014). The heading trait is a major determinant of Chinese cabbage quality. The Chinese cabbage leafy heads have different shapes and sizes, which were found to be associated with morphological features of rosette leaves. Many environmental factors affect the formation of the leafy head, such as temperature, daylight, light intensity, auxin concentration and nutrition (Ito & Kato, 1957; Wang et al., 2012). In addition, the genetic background affects leafy head formation and head shape and color (Mao et al., 2014). Understanding the regulation of leafy head development is therefore of vital agronomic importance.
Leafy head structure
The Chinese cabbage leafy head consists of inner yellow-green crinkly leaves that are folded around each other. The plant goes through four stages of vegetative growth: seedling, rosette, folding and heading stage (Chen, 1984). At seedling stage, primary and juvenile leaves are round and have long petioles. At rosette stage, the plant forms a rosette by extending large and round rosette leaves, with increasing leaf base angle. At the end of the rosette stage, folding leaves with short leaf petioles are differentiate to form the leafy head. Compared to non-heading leafy types, the folding leaves are more inwards curving standing up and remain metabolically active during the entire head development in order to supply the head with photosynthetates (Wang et al., 2012). Following the rosette and folding stages, the heading leaves, which are folded around the shoot apexes, orientate extremely upward and curve inwards giving rise to the leafy head. Different head shapes can be distinguished, depending on the cultivar. The Chinese cabbage leafy head shape is divided into four groups: round, oblong, cylindrical and cone-like shape (Figure 6). Recent studies showed that the shape and size of rosette and folding leaves influence the shape of the Chinese cabbage leafy head (Mao et al., 2014).
Figure 6. Chinese cabbage different leafy head shapes. (A) Round head shape. (B) Oblong head shape. (C) Cylindrical head shape. (D) Cone-like head shape. (Pictures from Mao et al., 2014.)
Genetic studies of leafy head formation
As a quantitative trait, multiple genes control the head formation in Chinese cabbage. However, the understanding of genetics and molecular mechanisms for this trait is still limited. The complete genome of B. rapa has been sequenced, which provides opportunities to genetically study the head formation in Chinese cabbage (Wang et al., 2011). Several quantitative genetic studies identified quantitative trait loci (QTLs) for heading related traits, including head top leaf overlap shape, head weight, head diameter and head height. In Yu et al.’s (2013) paper, 18 QTLs for six head traits were detected and three candidate genes were selected; BrGL1 for trichome formation, BrESR1 and BrSAW1 for the leaf wing trait. In the study of Inoue et al., (2015), four QTLs for head leaf overlap shape, head height, head diameter and head height to head diameter ratio were detected under different growth conditions, but no candidate genes were proposed. Several classes of small RNAs (microRNAs and siRNAs) serve as guides for post-transcriptional and epigenetic regulation of target genes with functions in plant developmental processes (Kidner and Martienssen, 2004; Laufs et al., 2004). In leafy heads of China cabbage, accumulation of microRNA319 reduces the expression level of the BrTCP4 gene, which controls cell proliferation in developing leaves and associates with a cylindrical head shape (Mao et al., 2014; Schommer et al., 2014). Another microRNA, microRNA156, targets BrSPL9-2, controlling the heading time of Chinese cabbage. Over-expression of microRNA156 prolongates the juvenile and early adult phases, thus delaying the folding stage (Wang et al., 2013).
Furthermore, in a large re-sequencing study of both B. rapa, and B. oleracea, bioinformatic analyses revealed genomic regions or selective sweeps for the domestication trait leafy head formation (Cheng et al., 2016). In these regions, several candidate genes were identified in the ab/adaxial leaf formation pathway, such as the Auxin Response Factors (ARF) BrARF3.1 and BrARF4.1, the KANADI transcription factors BrKAN2.1 and BrKAN2.2 and BrRDR6.
BrARF3 in B. rapa
As a single non-synomynous SNP in the C-terminal region of BrARF3.1 was highly associated with heading Chinese cabbages (Figure 7) in a large association
mapping panel, we decided to investigate how allelic variation of this gene relates to both leaf size, shape, and folding and leafy head formation in Chinese cabbages. ARFs are well known auxin-mediated response factors that bind to the promoters of auxin response genes (Guilfoyle & Hagen, 2001). Typical ARFs consist an N-terminal B3 DNA binding domain (DBD), middle region-Auxin response super family domain (MR) and C-terminal protein-protein interaction domain (AUX/IAA domain) (Guilfoyle & Hagen, 2007; Boer et al., 2014). ARF-DBD binds to specific DNA sequences to regulate transcription of different target genes. ARF-MR targets the reporter genes and acts as an activation or repression domain. These two domains alone are not influenced by auxin. The ARF-AUX/IAA domain interacts with Aux/IAA by amino acid sequence motifs III and IV and is required for an auxin response (Tiwari et al., 2003).
Figure 7. Auxin response factor (ARF) family information. (A) Phylogenetic tree of
B. rapa and A. thaliana ARFs. (B) Conserved protein domains of ARFs. (C) BrARF3.1 C-terminal SNP ratio in 806 B. rapa heading and non-heading accessions.
Arabidopsis has 23 ARF genes and these genes are expressed in a wide variety of tissues and organs. Based on the A.thaliana ARF gene family, 33 BrARF genes were identified in the B. rapa genome and divided into four subgroups (Mun et al., 2012; Huang et al., 2015) (Figure 7A). All BrARFs consist of an N-terminal DBD and an auxin response super family domain at the middle region. However, not all ARF have the C-terminal AUX/IAA domain. Like AtARF3 and AtARF17, BrARF3.1, BrARF3.2 and BrARF17.1, BrARF17.2 also lack the C-terminal AUX/IAA domain
(Figure 7B). In presence of auxin, ARF3 and ARF17 cannot be repressed or
activated by the Aux/IAA repressor (Tiwari et al., 2003). Interestingly, BrARF3.1 (Bra005465) and BrARF4.1 (Bra002479) cluster together in group II based on their sequence similarity and were both identified as candidate genes in selective sweeps for leaf heading traits (Cheng et al., 2016). A C-terminal amino acid difference between heading (Chinese cabbage) and non-heading B. rapa accessions was identified and used to design a SNP marker assay to genotype the BrARF3.1 alleles in 806 B. rapa accessions. 90% of the heading accessions (Chinese cabbage) carry a “G” allele (heading allele), and 73% non-heading accessions carry a “C” allele (non-heading allele) which leads to a significant association between heading and allelic variaton in BrARF3.1 (Figure 7C). The G/ C allele difference changes the amino acid from Glutamine (Gln) to Histidine (His) in the ARF3.1 protein.
Objectives and outline of the thesis
The aim of this thesis is to elucidate molecular pathways underlying the domestication trait leafy head formation in B. rapa and to investigate the role of BrARF3 in this. As a quantitative trait, the heading trait is still not fully understood. In this thesis I followed several approaches to study leafy head formation. First, I described the morphology of Chinese cabbage during development at both whole plant and the leaf cellular level. To study the genetic regulation of head formation, Quantitative Trait Loci (QTLs) were detected for both rosette leaf and leafy head traits in biparental populations. To study the molecular regulation of leafy head formation, gene expression was profiled during Chinese cabbage development and compared to gene expression during development of non-heading pak choi. To study the role of the BrARF3 gene in leafy head formation, functional studies of BrARF3 were conducted. The functional studies included over-expression studies in A. thaliana, and protein interaction studies with different B. rapa ARF3 protein alleles. Below both the used plant materials and all these aspects are shortly described within the context of the different chapters.
Plant materials used in this thesis: The population genetic experiments were conducted in China. The Chinese cabbage collection consisted of breeding materials from Hebei Agricultural University (HAU) and commercial varieties from different provinces in China. The Doubled Haploid (DH) population was generated in Wageningen using available DH parental lines: CC-48 (B.rapa ssp. pekinensis: CGN06867) as father line and non-heading pak choi PC-101 (B.rapa ssp. chinensis: CGN13926) as mother line. These genotypes were selected for their high response in microspore culture. In chapters 3 where we phenotyped whole plant and leaf development and in chapter 4 where we analysed the transcriptome in Chinese cabbage and pak choi during their development, we used homozygous genotypes, either DH lines generated in Wageningen or inbred lines obtained from others. In chapter 3 and 4 the used pak choi PC-024 was a DH line developed in our group, while the early heading Chinese cabbage CC-Z16 with smooth leaves and a round head was provided by the Institute of Vegetables and Flowers (IVF-CAAS) (Prof. Wang Xiaowu). This Chinese cabbage genotype was chosen for its smooth leaf phenotype and similar developmental speed compared to the PC-024 DH line. In addition we used the homozygous inbred Chinese cabbage line Chiifu in chapter 4, which was sequenced as reference genome (Wang et al. 2011) and in chapter 3 we used the DH line CC-A03, provided by HAU (Prof. Zhao Jianjun). CC-A03 is a late heading line with a cylindrical head and rugose leaves. From this line, an EMS mutant population is available at HAU. In chapter 5, we cloned BrARF3.1, BrARF4.1, BrKAN2.1, BrKAN2.2, YAB1.1 and YAB1.2 from PC-024 and CC-Z16. In addition, Arabidopsis thaliana Col-0 was used for functional studies.
Chapter 2: The correlation between rosette leaf traits and head formation was
determined by using 152 Chinese cabbage accessions. Hereafter, QTL analysis was performed to link genotypic data (molecular markers) and phenotypic data (head formation related trait measurements) in two parental populations from a cross between non-heading pak choi and Chinese cabbage (Doubled Haploid population and F2 population). QTL explaining heading and heading related traits were identified.
Chapter 3: Compared to non-heading pak choi, which goes through seedling and
rosette stages only, Chinese cabbage has two extra stages: folding and heading. The difference in morphological development at the full plant scale was described during the vegetative growth period for heading Chinese cabbages and non-heading pak choi. Specific developmental stages were defined and RNA was isolated from central emerging leaves for gene expression profiling using a B. rapa
60-mer custom made microarray. Differences in transcript abundance among genes between developmental stages and morphotypes are identified and annotated. Furthermore, the co-expression of genes related to heading formation is shown by comparing differences between the pak choi on the one hand and the two very different Chinese cabbage genotypes on the other hand. Mapman enrichment categories that define the different co-expressed genes are being discussed, with special focus on ‘cell’, ‘cell-wall’ and ‘photosynthesis’ related genes.
Chapter 4: The leafy head of Chinese cabbage is composed of a number of
heading leaves. Certain seedling and rosette leaf traits, like leaf size, shape, degree of blistering, leaf curvature and leaf waviness, are considered to be closely related to the formation of the leafy head. To understand these different leaf morphologies, the shapes, sizes, density and patterns and arrangements of cells that make up the palisade and spongy tissues were investigated using optical microscopy from different leaf segments. We then used quantitative real time PCR to profile gene expression of genes associated with leaf ad/abaxial formation and leaf cell division/expansion. The combined data are discussed and related to the differences in rosette leaves between Chinese cabbages and pak choi.
Chapter 5: In this chapter we investigated the role of BrARF3.1 in leaf and leafy
head development. Over-expression of both the heading and non-heading alleles of BrARF3.1 in A. thaliana resulted in a clear phenotype for the non-heading alleles only. The alleles differ in only four amino acids (aa), with one located between the ARF3 auxin response factor domain and B3 DNA binding domain, two located in the ARF3 B3 DNA binding domain and one located at the protein’s C-terminus. We over-expressed two different chimeric constructs of BrARF3.1 in A. thaliana to understand which mutation caused the strong phenotype. These same constructs were used in yeast two hybrid (Y2H) protein-protein interaction studies to test interaction with selected transcription factors. Interestingly, the aa change in BrARF3.1 that affects its interaction with other proteins, corresponds to the aa change that causes phenotypes in Arabidopsis over-expression plants.
Abstract
To understand the genetic regulation of the domestication trait leafy-head formation of Chinese cabbages, we exploit the diversity within Brassica rapa. To improve our understanding of the relationship between variation in rosette-leaves and leafy heads, we phenotyped a diversity set of 152 Chinese cabbages. This showed correlation between rosette-leaf traits and both head traits and heading capacity. Interestingly, the leaf number of the mature head is not correlated to heading degree nor head shape. We then chose a non-heading pak choi genotype to cross to a Chinese cabbage to generate populations segregating for the leafy head traits. Both a large F2 (485 plants) and a smaller Doubled Haploid (88 lines) mapping population were generated. A high density DH-88 genetic map using the Brassica SNP array and an F2 map with a subset of these SNPs and InDel markers was used for quantitative trait locus (QTL) analysis. Thirty-one quantitative trait loci (QTLs) were identified for phenotypes of rosette-leaves in time and both heading degree and several heading traits. On chromosome A06 in both DH-88 and F2-485 QTLs for rosette leaf length and petiole length at different developmental days and an F2 QTL for head height co-located. Variation in head height, width and weight all correlate with variation in heading degree with co-locating QTLs respectively on chromosome A03, A05 and A08 in F2-485. The correlation between rosette-leaf and heading traits provides not only insight in the leaf requirements to form a head, but also can be used for selection by Chinese cabbage breeders.
Introduction
B. rapa is an economical important species that includes many morphoypes that are cultivated as vegetable, oil and fodder crops (Prakash & Hinata, 1980; Gomez-Campo, 1999; Hanelt, 2001). It contributes many important leafy vegetable crops grown worldwide, with main production and consumption area’s in Asia and Europe (Dixon, 2007; Ge et al., 2011). The two most important B. rapa leafy morphotypes are Chinese cabbage with leafy heads and pak choi’s with flat smooth leaves and fleshy petioles that do not form a head. The general hypothesis is that Chinese cabbages have been domesticated from non-heading leafy pak choi’s in China (Li, 1984). Compared to the non-heading accessions, the heading types can be transported easily, stored long time and have better cold tolerance and higher yield (Daly & Tomkins, 1997).
Chinese cabbages go through four stages of vegetative growth: seedling, rosette, folding and heading stage (Ge et al., 2011). During seedling stage the leaves are round and have long petioles. Rosette leaves (RL) differentiate at the rosette stage and become large and round, with short petioles. At the end of the rosette stage, the folding leaves (FL) are also large and round with short petioles, but curve more inwards and thereby form a mould for further head development. Unlike species that do not form a leafy head, the rosette and folding leaves in heading plants remain metabolically active during the entire head development in order to supply the head with the products by photosynthesis (Yu et al., 2000; Wang et al., 2012). Leafy heads of Chinese cabbage are formed following the rosette and folding stages, when heading leaves develop an extreme upward and inward curvature giving rise to the leafy head that in effect becomes a nutrient storage organ. However, details of leaf development are rarely described and the correlation between variation of leaves in rosette/folding stage with timing of head formation and head shape is still unclear. As far as we know, only few genetic studies have been conducted on variation in rosette leaf traits and the relationship with head formation. Mao et al. (2014) phenotyped the rosette leaves and head shape at the heading stage and found a correlation between their morphology. Generally round heads had flat rosette leaves, cylindrical heads had rosette leaves with wavy margins and cone-like heads had rosette leaves that curved inwards. The same team also recently published about the effects of microRNAs on leaf curvature, which is also highly relevant to understand leafy head formation in Chinese cabbage (Wang et al., 2014). In addition, several genomic studies are conducted that describe gene expression profiles during Chinese cabbage development (Wang et al., 2012; Wang et al., 2013, Gau et al.,
2017). When these are combined with phenotyping of both the complete plant and the anatomy of leaves and meristems, our understanding of leafy head formation will increase.
Head formation is a quantitative trait, controlled by multiple genes, however genetic mechanism of head formation is still unclear. Currently, few studies have identified quantitative trait loci (QTLs) for heading traits in Chinese cabbage, such as head weight, head diameter, head height and number of leaves. Kubo et al. (2010) constructed a map based on a mapping population consisting of 188 F2 plants derived from a cross between a Chinese cabbage and a vegetable turnip. For head formation, two QTLs were detected in both 2005 and 2007, with no common head formation QTLs detected. Ge et al. (2011) phenotyped 154 F3 families and identified twenty-seven QTL distributed over all nine linkage groups for gross weight, head weight, head length, head width, numbers of wrapper leaves and head forming leaves. Inoue et al. (2015) evaluated eight traits over 2 years (2010 and 2011) for a F2 population of 188 plants from a cross between two Chinese cabbage cultivars. They reported QTL for four heading traits (degree of head-top-leaf overlap, head height, head weight and the ratio of head height to head diameter) on linkage groups A1, A5, A7 and A8 in both years. Xiao et al. (2013) used a genetical genomics approach to study variation in leaf shape and size in B. rapa. For this purpose they used a DH population derived from a cross between non-heading pak choi and an oil type, yellow sarson. They identified several candidate genes for leaf variation and also revealed correlations between leaf traits and both plant architecture and flowering time.
In this paper we aimed to understand further the complexity of head formation during Chinese cabbage development. To achieve this goal, we performed the first global analysis of the correlation between leaf traits during development and head formation at heading stage using 152 Chinese cabbage cultivars. The data will substantially increase knowledge of Chinese cabbage heading related traits during leafy head development and provide research directions for QTL studies of heading related traits. We also generated an F1 population derived from a cross between heading Chinese cabbage (CC-48) and non-heading pak choi (PC-101). A doubled haploid population (DH-88) and an F2 population (F2-485) were developed from F1 by microspore culture and self-pollination respectively. DH-88 and F2-485 linkage maps were constructed using 66 DH-88 and 485 F2-485 individuals for QTL analysis to detect loci related to rosette leaves related traits at rosette stage and leafy head formation at heading stage.
Materials and Methods
Plant materialsChinese cabbage genotypes for morphological traits analysis
A collection of 152 B. rapa L. ssp. pekinensis (Chinese cabbage) accessions from different locations of China was used in this study (Supplemental Table S1). Among them, 69 accessions were inbred lines and 83 accessions were hybrid varieties (F1). Plants were grown in a random block design in the field in Hebei province in China, September 2013. Three blocks with fifteen plants of each accession were used for collection of morphological trait data.
DH-88 and F2-485 mapping populations
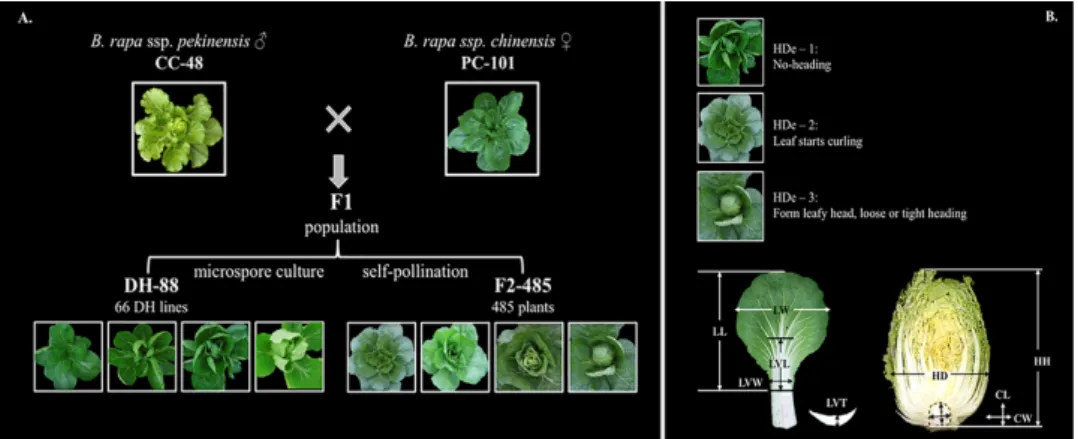
The mapping populations used in this study consisted of a doubled haploid population (DH-88) and an F2 population (F2-485) (Figure 1A). The DH-88 and F2-485 have the same father line, heading Chinese cabbage CC-48 (B. rapa ssp. pekinensis: CGN06867) and mother line, non-heading pak choi PC-101 (B. rapa ssp. chinensis: CGN13926). The F1 was obtained from a cross between CC-48 and PC-101. The 66 lines of DH-88 were obtained by F1 plant microspore culture. From this F1, 485 F2 plants were produced after selfing.
Figure 1. The strategy for constructing the Chinese cabbage (DH-88 and F2-485) populations (A) and description of the measurements of leaf and heading traits (B). Head degree (HDe), head diameter (HD), head height (HH), core length (CL) and core width (CW) were recorded for the leafy heads. Leaf length (LL), leaf width (LW), leaf mid vein length (LVL), leaf mid vein width (LVW) and leaf mid vein thickness (LVT) were recorded for leaves.
For QTL analyses, the experiments were conducted in Hebei Agriculture University, Hebei, China. Sixty-six DH-88 lines, plus their parental lines and their F1’s were sown in seeding soil in the greenhouse, transplanted September 2014 to an open field at the Hebei Agriculture University, and grown under short day conditions (11 h photoperiod) until December 2014. The 485 F2 seeds were sown on the same experimental field September 2015, and grown under natural conditions until November 2015.
Trait evaluations and phenotypic data analyses
The collection of 152 Chinese cabbage accessions were evaluated for 17 agronomic traits during heading stage and the traits scored in each individual plant are listed in Table 1. Five plants as biological replicates for each accession were evaluated for their agronomic traits.
For QTL analysis, 4 traits of DH-88 and eight traits of the F2-485 population were evaluated at rosette and heading stages. In rosette stage, the 6th rosette leaf was phenotyped for leaf width (LW), leaf length (LL), leaf petiole length (PL) and leaf trichomes (LT) at 36, 41, 44, 47, 50 and 53 days after sowing for the DH-88 and 30, 34, 37, 41, 44 and 48 days after sowing for the F2-485 population. At the heading stage, the degree of heading (HDe) was classified on a 1-4 scale (1.non-heading, 2.leaf up curling, 3.loose (1.non-heading, 4.tight heading) by visual observation before maturity of the heads for both the DH-88 and F2-485 population (Figure. 1B). At maturity, head diameter (HD), head height (HH) and head fresh weight (HW) were measured after discarding the loose outer leaves of all F2-485 plants at the same time. In DH-88 population, five biological replicates per DH line were used for traits observation.
The mean, standard deviation and variance were calculated for all traits by SPSS (Statistical Package for the Social Sciences, IBM) software. R package (“corrplot” package: http://www.R-project.org) with Pearson correlation coefficient was used to calculate the correlation coefficients between traits and between populations. Genetic map construction and QTL mapping
DNA extraction
Genomic DNA was extracted from young leaves of DH-88 and F2-485 plants by the CTAB method (Murray & Thompson, 1980; Rogers & Bendich, 1985). Subsequently, the DNA was checked on gel, diluted to the same concentration with water and used to screen for SNP markers.
DH-88 and F2-485 population genetic maps
TraitGenetics (Germany) developed a 60K B. napus array. The parental genotypes CC-48 and PC-101 were screened for this array, which resulted in 5795 polymorphic SNPs, which were used to construct the genetic map. The DH-88 individuals were genotyped for a set of 5795 SNPs covering the 10 linkage groups. A subset of 899 specific SNPs was used for constructing the DH88 genetic linkage map (Supplemental Table S2) in this study. The F2-485 genetic map was based on 99 InDel markers and 36 SNP markers (Supplemental Table S3). The InDel markers were designed using the B. rapa data base (http://brassicadb.org/brad/) and SNP markers were selected from the TraitGenetics set. SNP markers were used to anchor DH-88 and F2-485 populations. InDel markers were used for F2-485 genotyping by Native-PAGE method. SNP genotyping was carried out by high resolution melting analysis of small amplicons and HRMA was performed on 96-Well LightScanner System. Genetic maps for both populations were constructed by using JoinMap4.1 (Van Ooijen and Voorips, 2006). After creating population nodes, LOD scores 8.0 to 10.0 were used to assign the markers into linkage groups (LGs) and Kosambi’s mapping function (Kosambi, 2016) was used to construct genetic maps. Consensus linkage groups of the two populations were constructed with common markers in both populations and drawn using Mapchart 2.3 (Voorrips, 2002).
DH-88 and F2-485 population QTL mapping of heading related traits
Based on the genetic map, QTL mapping analysis was performed using MapQTL6 (van Ooijen, 2009). QTL regions for testing traits were identified by interval mapping (IM) analysis. Based on the results of IM, multiple- QTL model mapping (MQM) was performed using the closest markers as cofactors. A QTL was considered significant when LOD thresholds were estimated with a genome-wide confidence level p<0.005 (Doerge & Churchill, 1996).
Results
Diversity and correlation analyses of 17 heading related traits scored over the 152 Chinese cabbage accessions
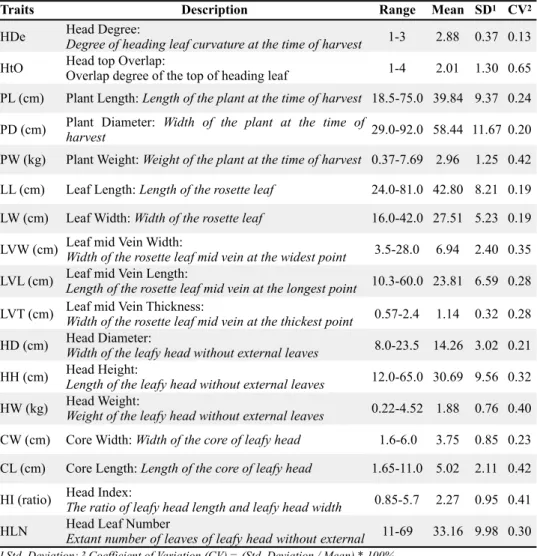
Phenotypic data for seventeen traits scored for the diversity set of 152 Chinese cabbages are shown in Table 1. All the quantitative traits showed normal distribution (Supplemental Figure S1). The coefficient of variation for “head-top-leaf overlap level” (HtO, 0.65) was higher than that of other traits, while
coefficient of variation for “heading degree” (HDe, 0.13) was the lowest among the seventeen investigated traits.
Table 1. List of 17 evaluated phenotypic traits of 152 Chinese cabbage accessions, their ranges and descriptive statistics
The17 traits were divided into three clusters based on the outcome of principal component analysis (Figure 2A). HDe, CL, HD were classified as “heading capacity traits” with regard to the Chinese cabbage head formation. Thirteen traits (LVL, LL, PL, HtO, HI, HH, CW, PW, HW, LVW, LVT, PD and LW) were classified as “head type traits”. Based on the Eigen Value, CW, PW, HW, LVW, LVT, PD, LW traits mainly belong to the Head Trait component, but are also partly related to “Head
2
Traits Description Range Mean SD1 CV2
HDe Head Degree: Degree of heading leaf curvature at the time of harvest 1-3 2.88 0.37 0.13 HtO Head top Overlap: Overlap degree of the top of heading leaf 1-4 2.01 1.30 0.65 PL (cm) Plant Length: Length of the plant at the time of harvest 18.5-75.0 39.84 9.37 0.24 PD (cm) Plant Diameter: harvest Width of the plant at the time of 29.0-92.0 58.44 11.67 0.20 PW (kg) Plant Weight: Weight of the plant at the time of harvest 0.37-7.69 2.96 1.25 0.42 LL (cm) Leaf Length: Length of the rosette leaf 24.0-81.0 42.80 8.21 0.19 LW (cm) Leaf Width: Width of the rosette leaf 16.0-42.0 27.51 5.23 0.19 LVW (cm) Leaf mid Vein Width: Width of the rosette leaf mid vein at the widest point 3.5-28.0 6.94 2.40 0.35 LVL (cm) Leaf mid Vein Length: Length of the rosette leaf mid vein at the longest point 10.3-60.0 23.81 6.59 0.28 LVT (cm) Leaf mid Vein Thickness: Width of the rosette leaf mid vein at the thickest point 0.57-2.4 1.14 0.32 0.28 HD (cm) Head Diameter: Width of the leafy head without external leaves 8.0-23.5 14.26 3.02 0.21 HH (cm) Head Height: Length of the leafy head without external leaves 12.0-65.0 30.69 9.56 0.32 HW (kg) Head Weight: Weight of the leafy head without external leaves 0.22-4.52 1.88 0.76 0.40 CW (cm) Core Width: Width of the core of leafy head 1.6-6.0 3.75 0.85 0.23 CL (cm) Core Length: Length of the core of leafy head 1.65-11.0 5.02 2.11 0.42 HI (ratio) Head Index: The ratio of leafy head length and leafy head width 0.85-5.7 2.27 0.95 0.41 HLN Head Leaf Number Extant number of leaves of leafy head without external 11-69 33.16 9.98 0.30
capacity trait” component. This is also supported by Pearson correlation analysis
(Figure 2B). Significant phenotypic correlations were found within the head type trait and within the heading capacity groups. CL and HDe clustered into one group and LVL, LL, PL, HtO, HI, HH formed another group, with significant correlation among these traits. The traits shared between Head Trait components and Heading capacity component grouped together based on their correlation rate. Only head leaf number (HLN) was negatively correlated with other traits in both component and correlation analysis.
Figure 2. Principal component (A) and Pearson correlation (B) Pearson correlation analysis for 17 traits in 152 Chinese cabbage accessions.
QTL analysis in DH-88 and F2-485
Linkage map construction
Construction of DH-88 linkage maps
The 5795 SNPs were profiled over the DH-88 population, which resulted in 899 bins distributed over ten linkage groups spanning a total genetic distance of 1469.5cM and average distance between markers is 0.92cM. The linkage groups correspond to the Chinese cabbage reference map. We only found one inversion of adjacent SNP bins located at the bottom of A10 and few inconsistent bins located in chromosomes A02 and A07, respectively, compared to the Chiifu Chinese cabbage reference genome (Supplemental Figure S2).
2
ComponentHeading Trait Heading Capacity Others Leaf middle vein length (LVL) ,750 -,403 -,100 Leaf length (LL) ,852 -,347 ,098 Plant length (PL) ,862 -,381 ,082 Head top overlap (HtO) ,137 -,715 -,051 Head index (HI) ,281 -,906 -,094 Head height (HH) ,640 -,676 ,137 Core width (CW) ,629 ,389 -,272 Plant weight (PW) ,862 ,356 -,031 Head weight (HW) ,813 ,407 ,049 Leaf middle vein width (LVW) ,622 ,235 -,252 Leaf middle vein thickness (LVT) ,534 ,244 -,447 Plant diameter (PD) ,756 ,135 ,028 Leaf width (LW) ,635 ,256 ,144 Head diameter (HD) ,426 ,659 ,369 Head degree (HDe) ,039 ,538 -,030 Core length (CL) -,085 ,475 -,291 Head leaf number (HLN) ,159 ,165 ,799
Construction of F2-485 linkage map
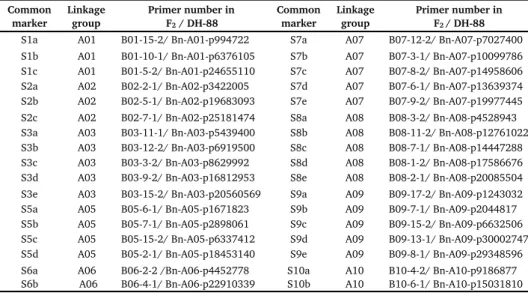
The DH-88 population consists of only 66 DH lines, limiting mapping precision and detection of significant QTLs. In order to identify significant quantitative trait loci, a large F2-485 population with 485 F2 plants was generated and a linkage map was constructed. A variety of different types of molecular markers were used for the construction of this linkage map. These included 36 SNPs and 99 InDel markers distributed over the ten linkage groups spanning a genetic distance of 1145.7cM with an average distance of 8.93cM between markers (Supplemental Figure S3). In general, marker order was in agreement with the Chinese cabbage genome sequence v1.5 (http://brassicadb.org/brad/) with few exceptions. There were 36 common SNPs markers between DH-88 and F2-485 linkage maps
(Supplemental Table S4). Common markers assist in comparison of the QTL positions on the two different linkage maps.
Correlation analysis of rosette leaf and heading traits in both DH-88 and F2-485
Development of rosette leaves in DH-88 and F2-485
Rosette leaves were phenotyped six times during their development; rosette leaf length and width continuously increase throughout the development (Figure 3). In DH-88, LL increased significantly between 36DAS (days after sowing) to 47DAS, but growth ceased 50DAS as there was no significantly increase between 50DAS and 53DAS (P=0.146). For LW, growth ceased after 47DAS (P=0.167). In F2-485, LL increased significantly during all time points measured, while for LW no significant difference was seen between 44DAS and 48DAS (P=0.763), and we can conclude that leaf growth ceased at 44DAS. Correlations between LL, LW and PL at different DAS with the trait “Final heading degree” are shown in Figure 3B. In both DH-88 and the F2-485 population, LL and PL are not significantly correlated with heading degree. LW however is positively correlated with “Final heading degree” in both DH-88 and F2-485. In DH-88, the correlation between LW and heading degree was clear from 36DAS to 53DAS, while this correlation was only significant at 37DAS in F2-485.
Figure 3. Sixth rosette leaf traits analysis in DH-88 and F2-485 populations throughout development. Box plots of the rosette leaf length (LL), leaf width (LW), petiole length (PL), grouped by growth days (the days after sowing: DAS). Correlation analysis between rosette leaf traits and “Final heading degree”.
2
Correlation coefficients among DH-88 population rosette leaf traits with Heading Degree
Day 36 41 44 47 50 53
LL 0.180 0.168 0.197* 0.183 0.174 0.157
LW 0.277** 0.358** 0.290** 0.283** 0.337** 0.314**
PL -0.201 -0.192 -0.246* -0.216 -0.155 -0.179
**Correlation is significant at the 0.01 level (2-tailed). *Correlation is significant at the 0.05 level (2-tailed).
LW_DH-88 LL_DH-88 PL_DH-88 36D 41D 44D 47D 50D 53D 36D 41D 44D 47D 50D 53D 36D 41D 44D 47D 50D 53D 0 2 4 6 8 10 20 30 40 5 10 15 20 Day Data Day 36D 41D 44D 47D 50D 53D
Correlation coefficients among F2-485 population rosette leaf traits with Heading Degree
Day 30 34 37 41 44 48
LL 0.156 0.100 0.022* 0.156 0.111 0.32
LW 0.114 0.055 0.016* 0.006** 0.002** 0.067*
PL 0.829 0.169 0.244 0.653 0.330 0.084
**Correlation is significant at the 0.01 level (2-tailed). *Correlation is significant at the 0.05 level (2-tailed).
Head trait analysis in F2 population
At the heading stage, the heading degree (HDe) was evaluated for 66 DH-88 lines and 485 F2 plants, while HH, HW and HWe were only evaluated in the F2-485 population (Supplemental Table S5). In the F2 population, the variance was higher for HH than for HW and HWe. The correlation coefficient analyses showed that HH, HW, HWe and HD were significantly correlated with each other. Correlation between HH and HD was lower, and not significant at the 0.01 level.
Detection of QTLs
QTL analyses for both leaf traits at the rosette stage and heading traits were performed for the DH-88 and F2-485 populations (Table 2).
In the rosette stage, QTLs for rosette leaf area length (LL), leaf width (LW) and petiole length (PL) were detected for both the DH-88 and F2-485 population. For LL one QTL was detected in DH-88 (R_DHLL1), while four QTLs (R_F2LL2, 3, 4, 5) were detected in the F2-485. R_F2LL4 and R_F2LL5 had high LOD scores (9.93 and 9.65), and explained around 18% of the phenotypic variation. There was one LW QTL detected on A03 in DH-88 that explained 33% of the phenotypic variation and one on A04 in the F2 that explained 6.8%. For PL, 6 QTLs were detected in DH-88 on A06. Four QTLs on A06 for PL in F2-485 were identified for different developmental days. The QTL region of A06 showed multiple QTL for LL and PL.
In the heading stage, two QTLs for head height (H_F2HH1 and H_F2HH2), one for head width (H_F2HW1) and two for head weight (H_F2HWe1 and H_F2HWe2) were detected in the F2-485. For the heading degree trait, a total of five QTL in four LGs in F2-485 and two on two LGs in DH-88 were detected. Of the QTL detected for the HDe trait, H_F2De7 showed a higher LOD (8.54) value on A08 in F2-485. We found that the HDe QTL region of A03 and A08 were detected in both DH-88 and F2-485, while the HDe QTL on A04 and A05 were only detected in the F2-485 population.
In both DH-88 and F2-485, a major QTL for leaf trichomes (LT) was detected on A06, explaining 64% and 57.8% of the variation.
2
Table 2. Quantitative trait loci found in DH-88 and F2-485 populationQTL StaAe LG Position
(cM) Nearest markers LOD
R2 (%) R_DHLL1A6 41D A06 46.907-49.574 Bn-A06-p3934890(46.907)-Bn-A06-p4623401(49.574) 3.14 28.0 R_F2LL2A6 37D A06 56.150 Bn-A06-p4452778(46.310)-A06-22-2(57.157) 4.48 8.9 R_F2LL3A6 41D A06 55.150 Bn-A06-p4452778(46.310)-A06-22-2(57.157) 7.08 13.7 R_F2LL4A6 44D A06 49.310 Bn-A06-p4452778(46.310)-A06-4(52.150) 9.93 18.7 R_F2LL5A6 48D A06 55.150 A06-4(52.150)-A06-22-2(57.157) 9.65 18.3 R_DHLW1A3 47D A03 84.414-89.414 Bn-A03-p14684924(84.414)-Bn-A03-p15627698(88.414) 3.87 33.3 R_F2LW2A4 44D A04 11.211 A04-17-2(8.211)-A04-6(12.356) 3.38 6.8 R_DHPL1A6 36D A06 53.349 Bn-A06-pp4056446(44.241)-Bn-A06-p5845542(53.682) 3.35 29.6 R_DHPL2A6 41D A06 43.537 Bn-A06-p3496759(41.537)-Bn-A06-p3986320(45.574) 3.75 32.4 R_DHPL4A6 44D A06 44.241 Bn-A06-p4056446 4.42 37.0 R_DHPL6A6 47D A06 43.537 Bn-A06-p3496759(41.537)-Bn-A06-p3986320(45.574) 3.72 32.2 R_DHPL7A6 50D A06 46.574 Bn-A06-p4056446(44.241)-Bn-A06-p4623401(49.574) 3.35 29.5 R_DHPL8A6 53D A06 48.241 Bn-A06-p4021930 3.04 27.3 R_F2PL9A6 37D A06 49.310 Bn-A06-p4452778(46.310)-A06-4(52.150) 8.14 15.5 R_F2PL10A6 41D A06 49.310 Bn-A06-p4452778(46.310)-A06-4(52.150) 10.06 19 R_F2PL11A6 44D A06 44.394 Bn-A06-p4452778(46.310) 5.97 11.6 R_F2PL12A6 48D A06 49.310 Bn-A06-p4452778(46.310)-A06-4(52.150) 5.82 11.5 R_DHLT1A6 -- A06 147.610 Bn-A06-p21896359(147.610) 9.75 64 R_F2LT2A6 -- A06 127.7-132.9 Bn-A06-p22910339(106.266) 9.1 57.8 H_F2HH1A6 Head A06 32.085 A06-43-1(31.085)-zyj6-6-2(59.563) 9.74 9.1 H_F2HH2A3 Head A03 16.071 B03-11-1(10.071)-B03-12-2(19.627) 6.41 6.1
H_F2HW1A5 Head A05 60.708 A05-7(60.708) 5.76 5.6
H_F2HWe1A8 Head A08 10.000 A08-1-1(0.000)-Zyj8-2-2(10.978) 6.49 6.0 H_F2HWe2A6 Head A06 62.563 Zyj6-6-2(59.563)-Zyj6-10-2(75.643) 5.89 5.5 H_DHHDe1A3 Head A03 73.394 Bn-A03-p12863642(72.394)-Bn-A03-p12903591(73.728) 4.09 34.8 H_DHHDe2A8 Head A08 8.140 Bn-A08-p1847328 3.39 29.9 H_F2HDe3A3 Head A03 8.000 zyj3-3-2(0.000)-Bn-A03-p5439400(10.071) 5.90 5.5 H_F2HDe4A4 Head A04 25.311 Zjy4-7(17.311)-zyj4-9-2(28.172) 4.46 4.2 H_F2HDe5A5 Head A05 57.664 B05-2-1(54.664)-zyj5-18(58.964) 4.28 4.0 H_F2HDe6A5 Head A05 77.975 zyj5-20-2(71.975)-A05-16-2(78.111) 4.91 4.6 H_F2De7A8 Head A08 7.000 A08-1-1(0.000)-zyj8-2-2(10.978) 8.54 7.8
Co-localization of QTLs between rosette leaf and head traits
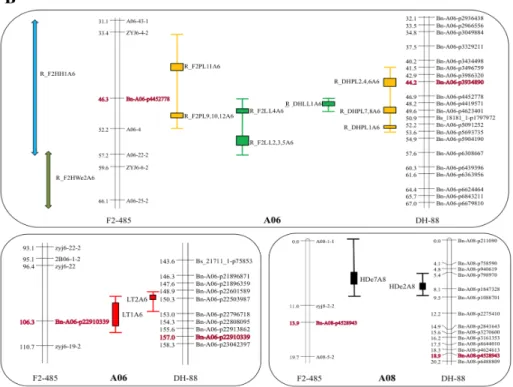
For the F2-485 population both rosette leaf and head traits were recorded, while for DH-88 population we measured rosette leaf traits and heading degree only. A total of 9 QTLs in rosette stage and 11 QTLs in heading stage were detected in the F2-485. Several QTLs were found to co-localize (Figure 4A). The QTL region of A03, A04, A05, A06 and A08 showed multiple QTLs for two till five traits. Head trait QTL H_F2HH2 and H_F2HDe3 were located at the top position of A03 (0.000-16.071cM). Heading degree and rosette leaf width H_F2HDe4 and R_F2LW2 were mapped closely linked on the top of LG A04. The bottom part of A05 (60.708-77.975cM) showed overlapping QTL for head weight and heading degree traits: H_F2HW1 and H_F2HDe5, H_F2HDe6. QTL for both rosette leaf and head traits R_F2LL (2, 3, 4, 5), R_F2PL (9, 10, 11, 12), R_F2LH2, H_F2HH1 and H_F2HWe2 were clustered at the interval of 32.085-62.563cM region on F2-485 LG A06. QTL for head traits H_F2HDe7 and H_F2We1 were detected at the top of A08 around 10.978cM.
The positions of the rosette leaf RLL, RPL, leaf trichomes LT and heading degree HDe QTLs in this study were compared between DH-88 and F2-485 maps (Figure 4B). A QTL for rosette leaf length (RLL: 46.8-49.5cM) was mapped on DH88 LG A06. QTLs for RLL in F2 (46.3-57.2cM) were detected on LG A06 below the common marker Bn-A06-p4452778. The SNP marker Bn-A06-p4452778 was linked with the QTL for RPL in both DH-88 (41.5-53.5cM) and F2-485 (33.4-52.2cM) in this study. The percentage of phenotypic variation explained by RPL QTLs ranged from 64% in DH-88 and 57.8% in F2-485. QTLs for leaf trichomes (LT) were mapped on LG A06 and a comparison of map positions could be made using the common Bn-A06-p22910339 marker in the maps. QTL for heading degree (HDe) in DH-88 (5.4-9.5cM) and F2-485 (0.0-11.0cM) on the top of LG A08 overlap, as they were linked to the common marker Bn-A08-p4528943.
Figure 4. Quantitative trait loci hotspots for the DH-88 and F2-485 population. (A) QTLs are represented by colored vertical bars positioned at the right of each linkage group. Common markers between DH-88 and F2-485 are indicated by “Sxx” and marker information, which is also shown in Supplemental Table S4. (B) Zoom in of QTL hotspots of the rosette traits RLL (green), RPL (yellow), leaf trichomes LT (red) and heading degree HDe (black) on DH-88 and F2-485 on A06 and A08.
Discussion and Conclusion
Heading is an important breeding trait, as size and shape of the Chinese cabbage heads determine their market share. In addition, the heading trait is an important domestication trait that was domesticated around 1600 years ago (Tan, 1979; Li, 1981). Identification of QTL and the underlying causal genes can both shed light on the mutations and pathways that were selected for during domestication, but will also generate tools for breeders to select for optimal size and shape of Chinese cabbages.
Head formation related traits
So far, only few studies are published that study the genetics of leafy head formation (He et al., 2000; Wang et al., 2012; Yu et al., 2013), but only very few
combined morphological variation at the rosette stage with variation in heading degree and shape. Mao et al. (2014) demonstrated that variation in expression of TCP4 miRNA (miRNA319) explained head shape and the size, shape and curvature of rosette leaves. They showed clear correlation between morphology of leaves in rosette stage and final leafy head shape. In this study, we also extensively phenotyped leaf development during rosette stage and phenotyped the leafy head in a diverse collection of Chinese cabbage hybrids and inbred lines. This allowed us to evaluate variation and correlation between rosette and heading traits. We found that rosette leaf petiole- and leaf blade length were not correlated with final heading degree (HDe). However, rosette leaf width measured at several developmental stages was correlated with HDe during plant development in F2-485 and DH88 populations. This correlation was weaker at early rosette stage and increased following the head formation process. The observation that rosette leaf width, which largely determines size and heading degree, are correlated fits with the physiology of Chinese cabbage. The special feature of heading Chinese cabbages is that younger leaves that initiate and grow inside the head are not photosynthetically active. As a consequence the outer leaves should remain active until harvest to generate photosynthetates and stimulate N uptake (Wang et al. 2012). Also, the redistribution from older outer leaves to the young inner leaves forming the head is of importance (Lammerts van Bueren & Struik, 2017). At later rosette stages when the head growth increases, the rosette leaves are thus very important and their width may affect the growth of the head.
A number of leafy head related traits were studied in the heading stage of the collection of Chinese cabbage accessions. By phenotype variation analysis, we found that in Chinese cabbage the variation in the extent to which the outer heading leaves overlap each other (HtO) was the largest, while the trait Heading Degree (HDe) showed little variation in the collection. We showed clear correlations among traits, with a cluster of traits related to heading capacity and traits related to the shape of the head. The core of a Chinese cabbage head is the compact stem from which the leaves branch off. The shorter the core is, the denser the head. We detected strong correlation between core length (CL) and heading degree (HDe). Surprisingly, head leaf number (HLN) was not significantly correlated to the core length or to other head related traits. In this study the head weight was measured, however head density (weight divided by volume) was not determined, a trait that is likely related to both leaf number and core length. Currently we developed tools to analyze 3D images that make it possible to calculate head shape, volume and density.
Co-localized QTLs
By phenotyping a large F2 population derived from a cross between a PC and a CC parent for both rosette and heading traits and in addition phenotyping rosette traits in a DH population generated from the same cross, we found that QTLs for leaf size traits LL, LW, PL, the leaf trichome trait (LT) and leafy head traits HH, HW, HWe, HDe collocated in many cases. This was expected based on the correlations found between these traits.
For rosette leaves traits, common QTLs for leaf length (RLL), petiole length (RPL) and leaf trichome (LT) traits were identified on LG A06 in both the DH-88 and the F2-485 populations. However several QTLs are found in a single population only. The two populations have very different sizes (485 F2 plants and 65 DH lines), which affects statistical power to detect QTL. In addition, F2 phenotypic data are based on single plants while DH data are based on several biological repeats of the same DH line. This, and the fact that all loci are homozygous in the DH, while in F2 plants homo- and heterozygotes both occur, and dominance relationships of the traits are generally unknown, can all affect QTL detection. QTLs for rosette leaf width (RLW) were identified on chromosome A03 in the DH-88 and on chromosome A04 in the F2-485. Very interestingly, the RLW QTLs all co-located with heading degree (HDe) QTL. This as discussed based on their correlation, matches the physiological explanation that rosette leaves are the source of nutrients for the growing leafy head that serves as a sink. Colocation of QTL for RLL and RPL on LG A06 in both F2-485 and DH-88 population illustrates that total leaf length is correlated to petiole length.
For head related traits in the F2-485, we detected three QTLs for head length (HH) on LG A03, A06, A08, one QTL for head width (HW) on LG A05 and two QTLs for head weight (HWe) on LG A06, A08. Another QTL study in F3 families from a cross between small-and large heading Chinese cabbage lines identified QTLs for head related traits on the same linkage groups: HH on LG A03 and for HWe on LG A06 and A08 (Ge et al., 2011). In yet another study a head width QTL on LG A05 was detected (Yu et al., 2013). In the study of Yu et al. (2013) HW was phenotyped using 150 recombinant inbred lines from a cross between heading and non-heading Chinese cabbage in both 2011 and 2012 and one HW QTL on LG A05 was identified. In our study, we found that the head traits height, width and weight (HH, HW and HWe) were highly correlated with heading degree (HDe) and their QTLs co-located on LG A03, LG A05 and LG A08. Very interestingly, colocation of QTL for rosette leaves traits (RLL, RPL) and head related traits (HH, HWe) were identified on LG A06 in F2-485. This again shows the relation