Simulation-based study comparing multiple imputation methods for non-monotone missing ordinal data in longitudinal settings
A.F. Donneau Medical Informatics and Biostatistics, School of Public Health,
University of Li`ege, Li`ege, Belgium
M. Mauer EORTC Headquarters, Departments of statistics and quality of life, Brussels, Belgium
Ph. Lambert Institute of Social Sciences, Quantitative Methods
University of Li`ege, Li`ege, Belgium
G. Molenberghs I-BioStat, University of Hasselt, Diepenbeek, Belgium I-BioStat, Katholieke University of Leuven, Leuven, Belgium A. Albert Medical Informatics and Biostatistics, School of Public Health,
University of Li`ege, Li`ege, Belgium
Version 14-12-2012
Abstract
The application of multiple imputation (MI) techniques as a preliminary step to handle missing values in data analysis is well established. The MI methods can be classified into two broad classes, the joint modeling and the fully conditional specification approaches. Their relative performance for longitudinal ordinal data setting is not well documented. This paper intends to fill this gap by conducting a large simulation study on the estimation of the parameters of a longitudinal
proportional odds model. The two MI methods are also illustrated on a real dataset of quality of life in a cancer clinical trial.
Keywords: ordinal variables; longitudinal analysis; non-monotone; intermittent; missing at random; multiple imputation
Address for correspondence: A.F. Donneau, Medical Informatics and Biostatistics, School of Public Health, University of Li`ege, Sart Tilman B23, 4000 Li`ege, Belgium. E-mail: [email protected]
1
Introduction
In clinical trials, it is common practice to assess quality of life (QoL) on a Likert-type
scale along with the patient’s disease evolution [1]. Patients however may withdraw
prematurely from the trial or miss one or more follow-up visits. The latter situation refers
to intermittent or non-monotone missingness pattern and the former to monotone
missingness. The statistical analysis of non-Gaussian longitudinal data with
non-monotone missingness pattern is difficult to handle. Even when the number of
patients with intermittent missing data is small, discarding these patients from the
analysis [2] is unsatisfactory and alternative methods have to be considered.
Multiple imputation (MI) has become a reference method for handling missing data [3].
For longitudinal ordinal data with monotone missingness patterns, MI consists in a
sequential application of the proportional odds model considering the previous assessment
time as covariate and accounting for the uncertainty about the regression coefficients [4].
We shall refer to this method as the ordinal imputation model (OIM). Even if
inappropriate for ordinal data, it is common practice to impute ordinal data using a MI
approach for continuous data based on multivariate normality [5]. This MI method will be
refereed to as multivariate Normal imputation (MNI). In a previous work of our group, we
compared the performance of both approaches for the monotone setting and we clearly
demonstrates the superiority of the OIM approach [6]. The OIM method however hardly
works for non-monotone missing data and it has been suggested to apply the MNI method
based on multivariate normality [5] even if inappropriate for ordinal data. Here, we
propose to adapt the OIM method to longitudinal ordinal data with non-monotone
missingness patterns.
modeling (JM) and the fully conditional specification (FCS). The latter is also known as
chained equation, variable-by-variable imputation or regression switching. Within the JM
approach, the joint distribution of the data has to be specified (e.g. normality). The idea
of the FCS imputation method is to bypass the definition of the joint distribution by
specifying a conditional distribution for each variable where data need to be imputed. In
the subsequent, we shall assume that covariates are fully observed and only the ordinal
outcome can be missing. Thus, a proportional odds model needs to be specified at each
assessment time point.
We shall adapt the FCS strategy to monotone and non-monotone missing ordinal data by
means of widely available statistical software procedures. The performance of the
proposed method was compared to the joint modeling that assume a multivariate normal
distribution method by focusing on the estimation of the parameters of a longitudinal
proportional odds model. Both imputation methods were assessed through Monte Carlo
simulated artificial data sets and also illustrated on a real example. The simulations will
cover well-balanced outcome data but also skewed distributions, as often observed in QoL
studies.
The paper is organized as follows. The proportional odds model to analyze longitudinal
ordinal data is briefly reviewed in Section 2, while a general overview of the problem of
missing data is given in Section 3. Section 4 outlines the theoretical background of
multiple imputation including those for continuous and ordinal variables. The simulation
experimental design is described in Section 5 and results are presented in Section 6. Both
MI methods are illustrated on a QoL dataset in Section 7. Concluding remarks are given
2
The QoL dataset
The QoL data used in this work were obtained from the EORTC phase III clinical trial
26981 comparing radiotherapy (RT) and radiotherapy plus concomitant daily
temozolomide, followed by adjuvant temozolomide (RT+TMZ) in patients with newly
diagnosed and histologically confirmed glioblastoma. Between August 2000 and March
2002, a total of 573 patients were randomized by 85 institutions in 15 countries in this
trial, respectively 286 in the RT arm and 287 in the RT+TMZ arm. Clinical and QoL
results have been published previously [7, 8].
Per protocol, QoL had to be assessed in all patients using the EORTC QLQ-C30 version 2
questionnaire [9]. In the RT arm, QoL assessment was performed at baseline (ie, before
start of treatment), during radiotherapy at 4 weeks, 4 weeks after completion of the
radiotherapy and then every three months until disease progression. In the RT+TMZ
arm, QoL assessment was performed at baseline, during radiotherapy and concomitant
chemotherapy at week 4, 4 weeks after RT at the end of the third and sixth cycle of
adjuvant temozolomide, and then every 3 months until disease progression. At the time of
the analysis, time windows for acceptable QoL forms were defined around each time point
to gather the maximum information available [8]. Since there were only a few assessments
available after the first two follow-up time points, the analysis was stopped there.
In this paper, we shall consider the appetite loss (AP) scale of the QLQ-C30 as the
outcome varaible. AP is an ordinal variable with 4 response categories (‘Not at all’, ‘A
little’, ‘Quite a bit’, ‘Very much’). Since only few patients reported category ‘Very much’,
the two last categories were combined into a single one. In the following, the time of AP
assessment was treated as a categorical covariate. The distributions of AP according to
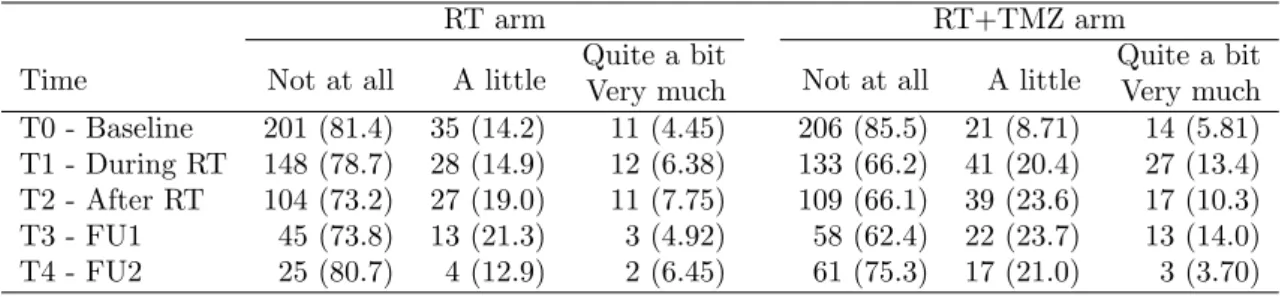
Table 1: Distribution of appetite loss (Number (%)) for each time point and treatment arm
RT arm RT+TMZ arm
Time Not at all A little Quite a bitVery much Not at all A little Quite a bitVery much T0 - Baseline 201 (81.4) 35 (14.2) 11 (4.45) 206 (85.5) 21 (8.71) 14 (5.81) T1 - During RT 148 (78.7) 28 (14.9) 12 (6.38) 133 (66.2) 41 (20.4) 27 (13.4) T2 - After RT 104 (73.2) 27 (19.0) 11 (7.75) 109 (66.1) 39 (23.6) 17 (10.3) T3 - FU1 45 (73.8) 13 (21.3) 3 (4.92) 58 (62.4) 22 (23.7) 13 (14.0) T4 - FU2 25 (80.7) 4 (12.9) 2 (6.45) 61 (75.3) 17 (21.0) 3 (3.70) FU1 = first follow-up / FU2 = second follow-up
In cancer trials, the drop-out is typically linked to disease progression and death.
Furthermore, it has been shown that no sharp increase or decrease was observed in scores
just before missingness, which is usually a good indicator for non-ignorable missing data
[7, 8]. A total of 29 different missingness patterns was observed for AP. The distribution
of the complete, monotone and non-monotone missingness patterns in each treatment
group is summarized in Table 2.
Table 2: Distribution of the different missingness patterns (Number (%)) in both treatment
arms
Missingness pattern RT arm RT+TMZ arm
Complete 15 (5.62) 30 (11.2)
Monotone 200 (74.9) 138 (51.3) Non-monotone 52 (19.5) 101 (37.6)
Total 267 269
3
Models for longitudinal ordinal data
3.1 The proportional odds model
Consider a sample ofN subjects and let Y be an ordered variable withK categories
assessed onT occasions in each subject. Then, let Yij denote the assessment of the ordinal
(Yi1, ..., YiT)0 is the vector of the repeated assessments of theith subject andYj =
(Y1j, ..., YN j)0 is the vector of responses at thejth occasion. Associated with each subject,
there is ap×1 vector of covariates, say xij, measured at timej. Hence, let
Xi= (xi1, ...,xiT)0 denote the T×p design matrix of theith subject. Covariates typically
include time of measurement, age, gender, treatment group, and so on.
The ordinal nature of the outcome variable may be accounted for by considering the
cumulative probabilitiesP r(Yij ≤k), k= 1,· · ·, K. The cumulative proportional odds
model is a popular choice to relate the marginal probabilities ofY to the covariate vector
x[10]. Specifically,
logit[Pr(Yij ≤k|xij)] =β0k+x0ijβ (1)
whereβ0= (β01, ..., β0,K−1)0 is the vector of the intercept parameters and β= (β1, ..., βp)0
the vector of coefficients (i= 1, ..., N;j = 1, ..., T;k= 1, ..., K−1). Under the
proportional odds assumption,βdoes not depend on k.
3.2 Generalized estimating equations
Estimation of the regression coefficients of marginal models can be approached by
likelihood-based or non-likelihood-based methods. One difficulty present with likelihood
models resides in the complexity of the relationship between the parameters of the model
and the joint probabilities that define the likelihood. Alternative solutions to
likelihood-based analysis have been explored, in particular the generalized estimating
equations (GEE), quite popular for the analysis of non-Gaussian correlated data. This
approach circumvents the specification of the joint distribution of the repeated responses
specified. Since the proportional odds model is not part of the regular generalized linear
model family, some transformations are required before applying the GEE method.
Following Lipsitzet al. [11], a (K−1)-dimensional expanded vector of binary responses
has to be created for each subject at each occasion,Y∗ij = (Yi∗1j, ...,Yi,∗(K−1),j)0 where
Yikj∗ = 1 if Yij =kand 0 otherwise. Now,
logit[Pr(Yij ≤k|xij)] = logit[Pr(Yikj∗ = 1|xij)], k= 1, ..., K−1 (2)
Since the logistic regression model is a member of the generalized linear model family, the
GEE method applies and consistent estimates of the regression parameters can be
obtained by solving the estimating equations
N X i=1 ∂π0i ∂βV −1 i (Y ∗ i −πi) =0 (3)
whereYi∗= (Yi∗1, ...,Y∗iT)0,πi =E(Y∗i),Vi =A1i/2RiA1i/2 withAi the diagonal matrix
of the variance of the elements ofYi∗, andβ the expanded vector of intercepts and
regression coefficients. The matrixRi is the ‘working’ correlation matrix that expresses
the dependence among repeated observations over the subjects ranging from independence
to exchangeable, banded, or unstructured.
4
Missingness
In line with the notation introduced previously, consider the missing data indicators,Rij,
defined as follows:
Rij =
1 if Yij is observed,
0 otherwise,
NowYi can be split into two subvectors (Yoi,Ymi ) whereYio refers to the observed
component ofYi andYmi refers to the missing component part.
When missing data occur, we are concerned with the distribution of the measurement
process together with the missing-data process. Little and Rubin [12, 13, 14] identified
two broad classes of joint models: the selection model and the pattern-mixture model. In
the selection model, the joint distribution (Yi,Ri) is split into the marginal distribution
of the measurement and the distribution of the missingness process conditional on the
measurementYi. By contrast, the pattern-mixture model specifies the marginal
distribution ofRi and the conditional distribution of Yi given Ri. Here we shall focus on
the selection model approach in which Rubin [4] and Little and Rubin [12] made essential
distinctions between the processes responsible for the missingness: missing completely at
random (MCAR), missing at random (MAR), and missing not at random (MNAR). The
determination of the mechanism responsible for missing data has a decisive implication on
the choice of the statistical method used to analyze the data. Under the MCAR
mechanism, the probability of an observation being missing is independent of bothYo and
Ym. Under the MAR mechanism, the probability of an observation being missing is
independent ofYm given Yo . When neither MCAR nor MAR holds, the missingness
mechanism is said to be MNAR, whence the probability of an observation being missing
depends onYm.
Liang and Zeger [15] pointed out that GEE are only valid under the restrictive assumption
that the data are missing completely at random (MCAR). Alternative methods were
investigated to allow the analysis of data under less strict missingness assumptions.
Robinset al. [16, 17] developed an extension of the GEE, known as the weighted
regression parameters even under the MAR assumption. With their method, each
subject’s measurements is weighted in the GEE by the inverse probability of dropping out
at that time point. Another alternative to analyze the data under the MAR assumption is
multiple imputation based on GEE (MI-GEE). In this approach, missing values are
imputed several times [4, 18] and the resulting completed datasets are analyzed using
standard GEE methods. Using Rubin’s rules, the final results obtained from the
completed datasets are combined into a single inference. In the context of longitudinal
binary data, Beunckenset al. [19] showed by simulations that, in spite of the asymptotic
unbiasedness of WGEE, the combination of GEE and multiple imputation is both less
biased and more accurate in small to moderate sample sizes which typically arise in
clinical trials. In this paper, focus will be on MI-GEE methods.
5
Multiple imputation
5.1 Theoretical framework
The idea behind multiple imputation is to replace each missing value wit a set ofM >1
plausible values drawn from the conditional distribution of the missing data given the
observed data. This conditional distribution represents the uncertainty about the right
value to impute in the sense that the set ofM imputed values properly represents the
information about the missing value that is contained in the observed data.
Using the notation introduced in previous sections, letθ represents the parameter vector
of the distribution of the responseYi= (Yio,Yim). Note thatθ may differ from the
parametersβof the substantive model. The observed dataYo will be used to estimate the
can be drawn fromf(Ym|Yo,θ). For θ unknown, an estimate is obtained from the data,
sayθˆ; then missing values will be imputed usingf(Ym|Yo,θˆ). Frequentists incorporate
uncertainty inθ by using bootstrap or other methods. A Bayesian prior distribution forθ
can also be chosen. Given this distribution, a drawθ∗ is generated and now values for Ym
can be drawn fromf(Ym|Yo,θ∗). These two steps for the construction of the imputed
data are the first phase of MI. Then the substantive model is applied to each of theM
completed data (Yoi,Yim∗). Let βˆm and Uˆm be the vector of estimates and the
corresponding variance-covariance matrix for themth imputed data set (m= 1, . . . , M),
respectively. The last step of MI is the combination of theM results. The MI point
estimate forβ is simply the average of theM complete-data point estimates [4, 5],
ˆ β∗ = 1 M M X m=1 ˆ βm
A measure of the precision ofβˆ∗ is obtained by Rubin’s variance formula [4] which
combines the within- and the between-imputation variability. DefineW, the
within-imputation variance, as the average of theM within imputation variance estimates
ˆ Um, W= 1 M M X m=1 ˆ Um
andB, the between-imputation variance, measuring the variability across the imputed
values, B= 1 M −1 M X m=1 (βˆm−βˆ∗)(βˆm−βˆ∗)0
Then, the variance estimate associated withβˆ∗ is the total variance
T=W+ 1 + 1 M B
5.2 MNI method
In Bayesian inference, information about unknown parameters is expressed in the form of
posterior probability distributions computed using Bayes’ theorem. In this context,
Markov Chain Monte Carlo methods (MCMC) have been considered to explore and
simulate the entire joint posterior distribution of the unknown quantities through the use
of Markov chains.
Assuming that data arise from a multivariate normal distribution, Schafer [5] developed a
method based on an MCMC process for generating proper imputations that accounts for
between imputation variability, the MNI approach. This approach, based on the algorithm
of data augmentation [20], is a procedure that iterates between an imputation step
(I-step) and a posterior step (P-step). In the I-step, given starting values for the mean
and the covariance matrix, i.e. given starting values forθ, values for missing dataYm are
simulated by randomly drawing a value from the conditional multivariate normal
distribution ofYm givenYo,f(Ym|Yo,θ). After the first iteration, new values forθ are
drawn from its posterior distribution. Both steps are iterated, which creates a Markov
chain (Ym
(1),θ(1)),(Y(2)m,θ(2)),· · · where each step depends on the previous one,
introducing dependency across the steps. The two steps are then iterated long enough
until the distribution becomes stationary. Imputations from the last iteration are used to
impute the missing values of the dataset. More detail about this procedure can be found
in [5].
When proceeding this way for an ordinal outcome, the imputed values obtained are no
longer integer values and need then to be rounded off to the nearest integer (category) or
to the nearest plausible value. However, in the binary case, it was demonstrated that
parameter estimates [21, 22, 23]. In situations like ours, where one is concerned with
missing values for the outcome variable, unrounded values are physically not plausible. So,
the rounding phase is unavoidable before application of the substantive model (e.g. GEE
with proportional odds model).
5.3 FCS based on ordinal imputation model
The adaptation of the ordinal imputation model (OIM) to arbitrary missingness pattern
appears as an alternative to the MNI approach. To impute missing data for an ordinal
outcome, one has to impose a probability model on the complete data. In the presence of
an ordinal outcome variable, a proportional odds model will be considered to link the
ordinal outcome to a set ofq covariates. The FCS with an ordinal imputation model is
based on the Gibbs sampling algorithm; that is random draws from the multivariate
distribution of interest,f(Ym|Yo,θ), is be obtained by iteratively drawing from the
conditional distribution of each outcome assessment. This imputation process is composed
of two steps, a filled-in step and an imputation step.
Filled-in step
In this step, all missing value,Ym, are filled-in using an arbitrary method. Let
Y(0) = (Y(0)1 ,· · · ,YT(0)) whereYj(0)= (Yjo,Y(0)j∗) withYoj the observed part of the jth
assessment of the ordinal outcomeY andY(0)j∗ its filled-in part. Y(0) will serve as initial
starting values for the imputation step.
Imputation step
In this second step, the previously filled-in elements ofYj(0)∗ are imputed using the specified
(j= 1,· · ·, T). In order to obtain imputed values that are independent of the starting
values,Y(0), the cycling imputation through all Ymj (j = 1,· · · , T) is repeated several
times. The imputations above will be based on the following proportional odds model,
logit[P r(Yijm≤k)|x∗ij] = θjk+x0∗ijθxj, (4)
where the covariates typically include those of the substantive modelXij, possible
auxiliary covariatesAij, and the other outcomes Y−j = (Y1,· · · ,Y(j−1),Y(j+1),· · ·,YT).
To realize proper imputation [4], uncertainty aboutθj = (θjk,θxj) has to be accounted
for. For this purpose, a value forθj is drawn from an appropriate posterior distribution
aboutθj conditionally on the most recently imputed data. One way of proceeding is
known as the ”Normal approximation draw” method. This method is correct for linear
regression [4] but is near far a reasonable approximation for situation involving categorical
regression. Nevertheless, it is a common practice, supported by the law of large-sample, to
use this Normal approximation [4]. To correct for possible misleading association that
could have been introduced in the filled-in step, the proportional odds model is fitted on
the part of the dataset with observed observation for thejth assessment,Yoj, which might
contain observations with imputed values for the other assessments,Y−j.
Based on these considerations, thetth iteration of the imputation step goes as follows,
Y(1t): 1. Fit the proportional odds model (4) on the part of the dataset for whichY1 is
fully observed and draw new values for ˆθ1 using
θ1∗ = ˆθ1+V0hiZ,
where V0hi is the upper triangular matrix of the Cholesky decomposition,
independent random normal variates.
2. For each element ofYm
1 compute
P[Yim1 =k|θ1∗,Yo1,Y2(t−1),· · · ,Y(Tt−1),xi1,Ai1] from equation (4).
3. For each element ofYm
1 draw a random variate from a multinomial distribution
with probabilities derived in step 2.
· · · · · · · · ·
Y(Tt): 1. Fit the proportional odds model (4) on the part of the dataset for whichYT is
fully observed and draw new values for ˆθT using
θT∗ = ˆθT +V0hiZ,
where V0hi is the upper triangular matrix of the Cholesky decomposition,
Vi=V0hiVhiof the covariance matrix of ˆθT and Zis a (K−1) +q vector of
independent random normal variates.
2. For each element ofYmT computeP[YiTm=k|θT∗,Yt1,Y
(t)
2 ,· · · ,YTo,xi1,Ai1]
from equation (4).
3. For each element ofYTm draw a random variate from a multinomial distribution
with probabilities derived in step 2.
The previous cyclic iteration process is repeated several times, usually between 10-20
[25, 24], until stabilization of the results. As within the Gibbs sampling algorithm,
convergence is influenced by the choice of the initial values,Y(0). In the filled-in step, we
then replace the missing values using an ordinal logistic regression sequentially by order of
6
SIMULATION STUDY
To assess the performance of both imputation methods (MNI and FCS OIM), we
conducted a large simulation study as described hereafter.
6.1 Longitudinal ordinal data-generating model
Correlated ordinal responses were generated with the SAS macro developed by Ibrahim
[26] and based on Lee’s algorithm [27]. The basic measurement model utilized in this
study includes as covariates a binary group effect (X= 0 or 1), an assessment time (T)
and an interaction term between group and time, so that the proportional odds model
(Eq. 1) is written as:
logit[Pr(Yij ≤k|xi, tj)] =β0k+βxxi+βttj+βtxxitj. (5)
(i= 1,· · ·, N;j= 1,· · · , T;k= 1,· · · , K−1). An exchangeable correlation structure was
considered.
6.2 Missing data generating mechanisms
The mechanism used to generate MAR missingness data is based on the following binary
logistic regression model:
logit[Pr(Rij = 0|xi, Yi,(j−1))] =ψ0+ψxxi+ψprevYi,(j−1) (6)
(i= 1,· · ·, N;j= 1,· · · , T;k= 1,· · · , K−1). Thus, the probability to be missing at a
certain time pointj depends on the binary covariate X and the outcome value at the
6.3 Simulation patterns
Theoretical values of the model parameters (see (Eq. 5)) considered in our simulations are
given in Table 3 for a well-balanced and skewed distribution.
Table 3: Values of the model parameters used for generating longitudinal ordinal dataset (well-balanced and skewed distribution) Distribution K β01 β02 β03 β04 β05 β06 βx βt βtx Well-balanced 2 -0.25 - - - 0.10 0.10 -0.15 3 -0.71 0.66 - - - - 0.10 0.10 -0.15 4 -1.10 0.00 1.10 - - - 0.10 0.10 -0.15 5 -1.39 -0.41 0.41 1.39 - - 0.10 0.10 -0.15 7 -1.79 -0.92 -0.29 0.29 0.92 1.79 0.10 0.10 -0.15 Skewed 2 1.00 - - - 0.80 0.10 -0.25 3 -2.20 -0.85 - - - - 0.80 0.10 -0.25 4 -0.41 0.00 0.41 - - - 0.80 0.10 -0.25 5 -0.85 -0.20 0.20 0.85 - - 0.80 0.10 -0.25 7 -1.39 -0.66 -0.16 0.16 0.66 1.39 0.80 0.10 -0.25
Three distinct sample sizesN were considered for the simulation: 100, 300 and 500,
equally distributed between both groups. This covers small (50 subjects/arm) to large
studies (250 subjects/arm). For the assessment time pointsT, two possibilities were
envisaged corresponding to short (T = 3) or long (T = 5) longitudinal study. Note that for
skewed data, onlyT = 3 was considered. The ordinal outcome variable Y covered several
numbers of categoriesK = 2,3,4,5 and 7, respectively. Finally, the population parameters
of (Eq. 6) (ψ0, ψx, ψprev) were chosen to yield a rate of missingness approximatively equal
to 10%, 30% and 50%, respectively. The complete data case (0% missingness) was also
considered. Thus, both imputation methods were assessed on 90 different combination
patterns. For each pattern, S = 500 random samples were generated. The two MI
incomplete dataset allowing a paired comparaison of the two approaches. A GEE model
was then fitted to the resulting multiply imputed datasets. For each MI method, the
number of multiple imputation was fixed toM = 20 [4, 28]. As the generation of the
MAR missingness was based on the binary covariateX, the latter had to be included in
the imputation model. In the GEE model, the same working correlation matrix as the one
used in the generation data process was considered, that is an exchangeable correlation
matrix. The MI based on MNI and on FCS OIM were carried out using the SAS MI
procedure. The GEE SAS macro based on the extension of Lipsitzet al. method [11] and
implemented by Williamsonet al. [29] was used to analyze the imputed datasets. Finally,
the SAS MIANALYZE procedure was used to pool the results obtained.
6.4 Evaluation criteria
For each simulation pattern, the relative biasRB = ˆβ/βexpressed in percent was averaged
over theS= 500 replicated datasets. Likewise, the mean square error was calculated as
M SE =Bias2+V ar( ˆβ) withV ar( ˆβ) =PSs=1 ( ˆβs−β¯ˆ)2 (S−1) , ¯ ˆ β =PSs=1 βˆs S and Bias= ¯ ˆ β−β.
The effect of the modeling parameters on RB was assessed by multiple regression analysis
and so was the difference between RB obtained by MNI and FCS OIM, respectively. To
account for the matching between both imputation methods, a generalized linear mixed
model taking all modeling parameters as covariates was applied to the MSE derived after
imputation. This statistical scheme was applied to both kinds of generated ordinal data,
7
Results
The values of the relative bias (%) and the MSE calculated over the 500 replicate samples
are detailed in Appendices for both imputation methods. For clarity, results for intercepts
were omitted.
7.1 Well-balanced distributions Relative bias
Table 4 reports the mean (±SD) of RB of each regression parameter derived under both
imputation methods as well as their differences. Globally, underestimated values of the
model parameters were found using the MNI method, while estimates derived with the
FCS OIM method were almost unbiased. Although differences between the two
imputation methods were highly significant (p <0.0001) for all regression parameters, the
RB difference was small (3−8%).
When considering the results under the various simulation patterns, the following
observations could be made. For the binary effect parameter,βx, using the MNI method,
the RB was unchanged forK and rate of missingness but it varied according to the
number of time points (p= 0.001) and to N (p= 0.019). In fact, RB was lower in short
term than in long term studies (92.9±15.9 % vs 101.8 ±10.5 %; p= 0.001) and it
decreased from 100.1±18.8 % forN=100 to 92.1±9.27 % forN = 500. Nearly the same
conclusions apllied for the RB derived under the FCS OIM process. The RB remained
unchanged withT and the rate of missingness but decraesed withK (p= 0.009) and with
N (p= 0.022). The RB for the time effect parameter,βt, and for the interaction term,
βtx, behaved similarly under both MI methods. It significantly decreased withK
point (p <0.05) but was unchanged forN. Overall, for each simulation pattern, better
T able 4: Relativ e bias (mean ± SD) of the parameters of the substan tiv e mo del after im putation of the ordinal outcome using MNI an d F CS OIM me tho ds. Globally and according to the mo deling parameters βx βt βtx MNI F CS OIM Diff MNI F CS OIM Diff MNI F CS OIM Diff Global 97.4 ± 14.1 100.1 ± 12.7 -2.78 ± 3.92 90.4 ± 14.1 98.3 ± 9.22 -7.90 ± 6.34 95.2 ± 6.09 99.2 ± 4.57 -4.02 ± 2.53 < 0 . 0001 < 0 . 0001 < 0 . 0001 K 2 93.7 ± 13.6 99.1 ± 12.0 -5.36 ± 3.84 99.0 ± 4.87 102.4 ± 6.31 -3.40 ± 2.27 96.4 ± 3.71 100.1 ± 2.65 -3.70 ± 2.65 3 110.5 ± 12.9 111.7 ± 12.9 -1.12 ± 1.75 97.1 ± 6.30 102.4 ± 4.71 -5.34 ± 2.44 99.6 ± 5.48 102.9 ± 4.77 -3.30 ± 1.63 4 93.9 ± 14.4 98.0 ± 12.0 -4.05 ± 4.69 88.0 ± 11.2 97.6 ± 4.91 -9.58 ± 6.75 94.4 ± 7.10 99.2 ± 4.82 -4.80 ± 3.29 5 95.5 ± 10.8 97.5 ± 12.1 -2.01 ± 2.20 90.5 ± 8.55 100.3 ± 4.99 -9.86 ± 6.56 93.3 ± 4.75 97.5 ± 3.00 -4.14 ± 2.53 7 93.2 ± 11.8 94.6 ± 7.68 -1.35 ± 4.63 77.5 ± 21.7 88.8 ± 14.1 -11.3 ± 7.92 92.3 ± 6.46 96.4 ± 4.52 -4.16 ± 2.31 0.086 0.009 0.003 < 0.0001 < 0.0001 < 0.0001 < 0.0001 < 0.0001 0.063 T 3 92 .9 ± 15.9 97.8 ± 14.3 -4.89 ± 3.86 85.4 ± 18.1 96.7 ± 12.6 -11.3 ± 7.01 92.4 ± 7.09 97.8 ± 5.75 -5.34 ± 2.61 5 101.8 ± 10.5 102.5 ± 10.6 -0.66 ± 2.65 95.4 ± 4.72 99.9 ± 3.01 -4.51 ± 2.93 98.0 ± 3.02 100.7 ± 2.22 -2.70 ± 1.61 0.001 0.064 < 0.001 < 0.0001 0.046 < 0.0001 < 0.0001 0.0005 < 0.0001 N 100 100.1 ± 18.8 102.4 ± 17.2 -2.27 ± 3.97 92.1 ± 14.7 99.5 ± 10.1 -7.36 ± 6.17 96.0 ± 7.77 99.6 ± 6.39 -3.58 ± 2.40 300 99.9 ± 11.4 102.9 ± 10.4 -2.94 ± 4.01 90.4 ± 14.4 98.4 ± 9.32 -7.99 ± 6.50 95.7 ± 5.32 99.9 ± 3.50 -4.17 ± 2.60 500 92.1 ± 9.27 95.2 ± 7.57 -3.12 ± 3.87 88.6 ± 13.4 97.0 ± 8.37 -8.35 ± 6.53 93.9 ± 4.73 98.2 ± 3.04 -4.30 ± 2.61 0.019 0.022 0.29 0.15 0.20 0.23 0.043 0.16 0.013 Missingness 10 100.1 ± 1.6 101.9 ± 13.4 -1.74 ± 1.32 97.3 ± 6.76 100.8 ± 5.55 -3.51 ± 2.66 98.7 ± 4.31 100.4 ± 4.06 -1.71 ± 0.87 30 97.9 ± 14.7 100.8 ± 13.1 -2.95 ± 3.75 90.9 ± 11.4 99.4 ± 7.41 -8.54 ± 5.86 95.6 ± 5.62 99.7 ± 4.58 -4.18 ± 1.90 50 94.1 ± 13.9 97.8 ± 11.6 -3.64 ± 5.43 83.1 ± 18.2 94.7 ± 12.4 -11.7 ± 6.86 91.4 ± 5.99 97.5 ± 4.69 -6.17 ± 2.23 0.074 0.18 0.020 < 0.0001 0.003 < 0.0001 < 0.0001 0.0045 < 0.0001
Mean square error
The mean square error (mean±SD) of each regression parameters under both imputation
methods and their difference are given in Table 5. Globally, although results were
significant, difference between MNI and FCS OIM were minute and not practically
relevant. From this perspective, MNI and FCS OIM were similar.
As expected, under both imputation methods and for each model parameter, the MSE
decreased significantly (p<0.0001) with the sample size N. A decrease was also observed
withT (p <0.0001). The number of categories K and rate of missingness did not affect
T able 5: Mean square error (mean ± SD) of the parameters of the substan tiv e mo del after imputation of the ordinal outcome using MNI and OIM metho ds. Globally and according to the mo deling parameters βx βt βtx MNI F CS OIM Diff MNI F CS OIM Diff MNI F CS OIM Diff Global 0.120 ± 0.101 0.117 ± 0.098 0.003 ± 0.007 0.01 0 ± 0.011 0.010 ± 0.011 -0.000 ± 0.001 0.01 9 ± 0.021 0.019 ± 0.022 -0.000 ± 0.001 < 0 . 0001 0.008 0.038 K 2 0.139 ± 0.119 0.141 ± 0.121 -0.002 ± 0.002 0.01 1 ± 0.013 0.012 ± 0.013 -0.001 ± 0.001 0.02 2 ± 0.025 0.023 ± 0.026 -0.001 ± 0.002 3 0.116 ± 0.100 0.113 ± 0.096 0.002 ± 0.005 0.01 0 ± 0.011 0.010 ± 0.012 -0.000 ± 0.001 0.01 9 ± 0.022 0.020 ± 0.022 -0.000 ± 0.000 4 0.122 ± 0.108 0.117 ± 0.102 0.005 ± 0.007 0.01 0 ± 0.012 0.010 ± 0.012 -0.000 ± 0.001 0.02 0 ± 0.024 0.020 ± 0.024 -0.000 ± 0.000 5 0.112 ± 0.096 0.108 ± 0.091 0.005 ± 0.007 0.00 9 ± 0.010 0.009 ± 0.011 -0.000 ± 0.000 0.01 7 ± 0.019 0.017 ± 0.019 0.000 ± 0.000 7 0.111 ± 0.089 0.105 ± 0.081 0.007 ± 0.010 0.01 1 ± 0.012 0.010 ± 0.011 0.000 ± 0.001 0.01 7 ± 0.018 0.017 ± 0.018 0.000 ± 0.001 0.12 0.031 < 0.0001 0.65 0.36 < 0.0001 0.16 0.09 < 0.0001 T 3 0.160 ± 0.118 0.154 ± 0.115 0.006 ± 0.009 0.01 7 ± 0.012 0.018 ± 0.013 -0.000 ± 0.001 0.03 2 ± 0.024 0.032 ± 0.024 -0.000 ± 0.001 5 0.081 ± 0.058 0.080 ± 0.058 0.001 ± 0.003 0.00 3 ± 0.002 0.003 ± 0.002 -0.000 ± 0.000 0.00 6 ± 0.004 0.006 ± 0.005 -0.000 ± 0.000 < 0.0001 < 0.0001 0.0001 < 0.0001 < 0.0001 0.016 < 0.0001 < 0.0001 0.038 N 100 0.240 ± 0.087 0.233 ± 0.084 0.007 ± 0.011 0.02 0 ± 0.014 0.021 ± 0.015 -0.0001 ± 0.001 0.03 8 ± 0.027 0.038 ± 0.028 -0.000 ± 0.001 300 0.075 ± 0.025 0.074 ± 0.024 0.002 ± 0.003 0.00 7 ± 0.005 0.007 ± 0.005 -0.000 ± 0.000 0.01 2 ± 0.008 0.012 ± 0.008 -0.000 ± 0.000 500 0.045 ± 0.015 0.044 ± 0.015 0.001 ± 0.002 0.00 4 ± 0.003 0.004 ± 0.003 0.000 ± 0.000 0.00 7 ± 0.005 0.007 ± 0.005 -0.000 ± 0.000 < 0.0001 < 0.0001 < 0.0001 < 0.0001 < 0.0001 0.0002 < 0.0001 < 0.0001 0.16 Missingness 10 0.116 ± 0.100 0.115 ± 0.099 0.001 ± 0.002 0.00 9 ± 0.011 0.009 ± 0.011 -0.000 ± 0.000 0.01 8 ± 0.021 0.018 ± 0.021 -0.000 ± 0.000 30 0.120 ± 0.101 0.117 ± 0.099 0.003 ± 0.005 0.01 0 ± 0.011 0.010 ± 0.011 -0.000 ± 0.001 0.01 9 ± 0.021 0.019 ± 0.021 -0.000 ± 0.001 50 0.125 ± 0.105 0.119 ± 0.098 0.006 ± 0.011 0.01 1 ± 0.012 0.012 ± 0.013 -0.000 ± 0.001 0.02 0 ± 0.023 0.021 ± 0.023 -0.000 ± 0.001 0.46 0.73 0.0008 0.18 0.13 0.040 0.44 0.40 0.15
7.2 Skewed distributions
As mentioned in the simulation plan, the impact of both imputation methods within the
skewed ordinal data setting has been investigated in the context of a short term study,
that isT = 3. Simulation results are summarized in the Appendices.
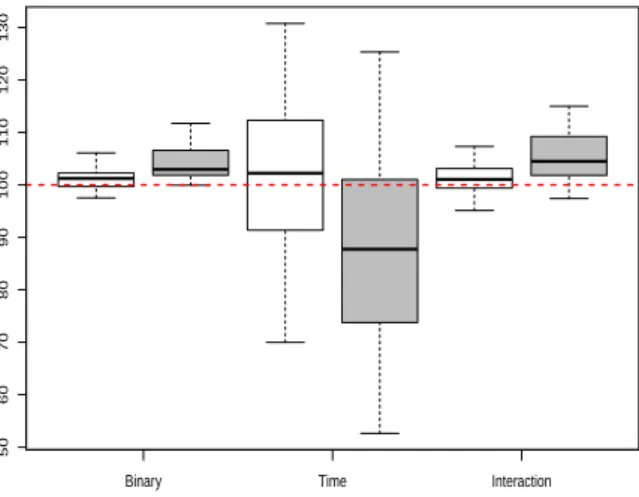
The overall RBs under both imputation methods are depicted in Figure 1 for each
regression parameter. Globally, the MNI method overestimated the binary and the
interaction term parameters of the model, while at the same time underestimated the time
parameterβt. As in the well-balanced setting, the OIM method yielded less biased
estimates. The median RB difference between the two imputation methods ranged from
2% to 10%, with the worst results observed for the time parameter,βt. In fact, the lowest
RB value ofβt was equal to 52.6% and the highest RB value was equal to 205.6%; both
extremes values were obtained under the MNI method. The extreme RBs under the OIM
method presented the same but less marked behaviour; they were equal to 76.7% and
144.4%, respectively.
Model parameter
Relativ
e bias (%)
Binary Time Interaction
50 60 70 80 90 100 110 120 130
Figure 1: Global Relative bias (%) of the model parameters (βx, βt, βtx) (MNI= shaded boxplot
-OIM=empty boxplot)
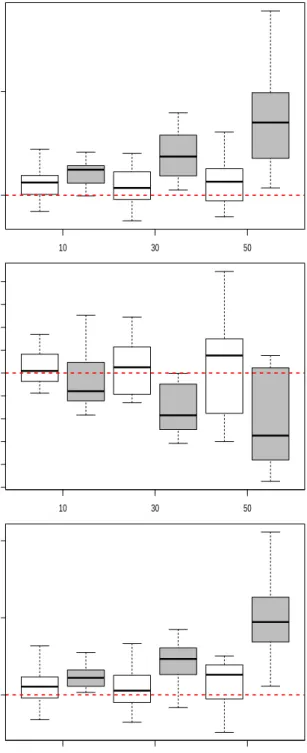
was found to be the same forK and N but not for the rate of missingness. As shown in
Figure 2, under both multiple imputation methods, the RB varied according toK,
especially for the time effect. While no association was found between RB and the rate of
missingness for the OIM, Figure 3 shows that, except for the time effect, RB under MNI
increased significantly with the rate of missingness (βx: p= 0.0003, βt: p= 0.99,βtx:
p <0.0001). No relationship was observed between the RBs derived under both MI
methods and the sample size,N.
The MSE of each regression parameter under both imputation methods and their
differences are displayed in Table 6. Comparison of the MSE calculated in presence of
skewed ordinal outcomes with those derived in well-balanced setting showed that MSE
values were larger in presence of skewness. Contrary to the well-balanced setting,
differences in the behaviors of the MSE were observed with respect to the modeling
parameters, especially according toK.
As expected, under both imputation methods and for each model parameter, the MSE
decreased significantly (p<0.0001) with the sample size N. Contrary to the
well-balanced setting, MSE values got lower as the number of categoriesK increased.
However, these falls in the MSE behaved differently in the two MI methods for the binary
and the interaction terms of the model. For the binary effect of the model, the difference
in MSE increased with the number of categories of the ordinal outcome (p <0.0001),
while for the interaction term the MSE difference decreased (p <0.0001). While the rate
of missingness did not affect MSE; the difference in MSE between the two MI methods
Relativ e bias (%) 2 3 4 5 7 100 110 Relativ e bias (%) 2 3 4 5 7 50 70 90 110 130 150 170 190 Numbers of categories Relativ e bias (%) 2 3 4 5 7 100 110 120
Figure 2: Relative bias (%) of the model parameters (βx,βt,βtx) according toKthe number of categories
Relativ e bias (%) 10 30 50 100 110 Relativ e bias (%) 10 30 50 50 60 70 80 90 100 120 140 Rate of missingness Relativ e bias (%) 10 30 50 100 110 120
Figure 3: Relative bias (%) of the model parameters (βx,βt,βtx) according to the rate of missingness (MNI=
T able 6: Mean square error (mean ± SD) of the parameters of the substan tiv e mo del after imputation of the ordinal outcome using MNI and OIM metho ds, globally and according to the mo deling parameters (sk ew ed distribu tion) βx βt βtx MNI F CS OIM Diff MNI F CS OIM Diff MNI F CS OIM Diff Global 0.203 ± 0.170 0.198 ± 0.172 0.005 ± 0.013 0.02 1 ± 0.017 0.021 ± 0.017 0.000 ± 0.002 0.041 ± 0.035 0.042 ± 0.037 -0.001 ± 0.003 < 0 . 0001 0 . 84 < 0 . 0001 K 2 0.339 ± 0.264 0.350 ± 0.271 -0.011 ± 0.011 0.03 4 ± 0.026 0.035 ± 0.026 -0.001 ± 0.001 0.070 ± 0.054 0.075 ± 0.057 -0.005 ± 0.005 3 0.180 ± 0.132 0.179 ± 0.131 0.001 ± 0.002 0.02 4 ± 0.015 0.021 ± 0.014 0.003 ± 0.004 0.036 ± 0.026 0.038 ± 0.028 -0.002 ± 0.002 4 0.165 ± 0.119 0.153 ± 0.111 0.012 ± 0.011 0.01 6 ± 0.012 0.017 ± 0.013 -0.001 ± 0.001 0.032 ± 0.025 0.033 ± 0.025 -0.001 ± 0.001 5 0.174 ± 0.135 0.165 ± 0.129 0.008 ± 0.008 0.01 7 ± 0.013 0.017 ± 0.014 -0.000 ± 0.001 0.034 ± 0.027 0.035 ± 0.027 -0.001 ± 0.001 7 0.159 ± 0.115 0.145 ± 0.104 0.014 ± 0.015 0.01 5 ± 0.011 0.015 ± 0.011 0.000 ± 0.001 0.030 ± 0.023 0.030 ± 0.023 0.000 ± 0.001 0.0015 0.0005 < 0 . 0001 < 0 . 0001 0.0001 0.87 0.0007 0.0 003 < 0 . 0001 N 100 0.404 ± 0.148 0.395 ± 0.164 0.009 ± 0.021 0.041 ± 0.015 0.041 ± 0.015 -0.000 ± 0.003 0.081 ± 0.032 0.084 ± 0.035 -0.003 ± 0.004 300 0.130 ± 0.044 0.127 ± 0.050 0.003 ± 0.008 0.014 ± 0.005 0.013 ± 0.005 0.000 ± 0.002 0.026 ± 0.010 0.027 ± 0.012 -0.001 ± 0.002 500 0.076 ± 0.022 0.074 ± 0.026 0.002 ± 0.005 0.009 ± 0.004 0.008 ± 0.003 0.001 ± 0.002 0.015 ± 0.006 0.016 ± 0.007 -0.001 ± 0.001 < 0 . 0001 < 0 . 0001 0.070 < 0 . 0001 < 0 . 0001 0.23 < 0 . 0001 < 0 . 0001 0.007 Missingness 10 0.196 ± 0.171 0.194 ± 0.172 0.002 ± 0.004 0.019 ± 0.015 0.019 ± 0.016 -0.000 ± 0.000 0.039 ± 0.034 0.039 ± 0.035 -0.000 ± 0.001 30 0.201 ± 0.171 0.196 ± 0.173 0.005 ± 0.010 0.021 ± 0.017 0.021 ± 0.017 0.000 ± 0.001 0.040 ± 0.035 0.041 ± 0.036 -0.002 ± 0.002 50 0.213 ± 0.179 0.205 ± 0.184 0.008 ± 0.021 0.024 ± 0.019 0.023 ± 0.020 0.001 ± 0.004 0.043 ± 0.038 0.046 ± 0.041 -0.003 ± 0.004 0.62 0.77 0.094 0.11 0.19 0.32 0.50 0.36 0.007
8
QoL data EXAMPLE
We applied both imputation methods on the QoL data (see Table 7).
Table 7: Results of the MI-GEE (proportional odds model) when using MNI and FCS OIM
as multiple imputation method
Parameter MNI FCS - OIM
Estimate (SE) P-value Estimate (SE) P-value
β01 1.41 (0.17) <0.0001 1.46 (0.15) <0.0001 β02 3.59 (0.21) <0.0001 2.94 (0.21) <0.0001 T1 −0.36 (0.22) 0.11 -0.097 (0.20) 0.62 T2 −0.73 (0.22) 0.001 -0.52 (0.22) 0.021 T3 −0.92 (0.24) 0.0001 -0.43 (0.33) 0.20 T4 −0.70 (0.35) 0.054 0.10 (0.36) 0.77 T RT×T0 0.21 (0.27) 0.44 0.26 (0.26) 0.32 T RT×T1 −0.52 (0.22) 0.017 -0.69 (0.23) 0.003 T RT×T2 −0.12 (0.22) 0.59 -0.23 (0.23) 0.32 T RT×T3 −0.26 (0.26) 0.32 -0.47 (0.37) 0.21 T RT×T4 0.01 (0.34) 0.97 -0.47 (0.42) 0.27
TRT is treatment (0 = RT, 1 = RT+TMZ); T0 = Baseline; T1 = During RT; T2 = After RT; T3 = FU1; T4 = FU2
Results derived under the MNI method showed that AP was more severe during RT (p =
0.001) and after RT (p = 0.0001) than at baseline. Moreover, severe AP affected more RT
+ TMZ patients than RT patients (T RT ×T1; p = 0.017) during treatment. When
applying the FCS OIM approach, the time effect disappeared except after RT (p = 0.021).
As for the MNI approach, the deleterious effect was significantly higher in RT + TMZ
patients (p = 0.0003). The difference between the two MI methods is evidenced in Figure
4 where the probabilities of each category at each assessment time in both treatment arms
are displayed for both MI approaches.
Increasing the number of imputations up to 100 to test the robustness of the results did
Figure 4: Distribution of appetite loss at each assessment time and in each treatment arm
for both MI methods
9
DISCUSSION
Several studies have compared MNI and FCS imputation methods [25, 31, 30] but to the
best of our knowledge, none have focused on longitudinal ordinal outcome data. This
study was designed to compare the performance of the two methods, available in most
statistical packages, in the context of longitudinal ordinal datasets with non-monotone
missing values. The comparison was based on a comprehensive simulation plan covering a
wide range of real life situations. Specifically, the parameters of the experimental design
included the following parameters: number of categories of the ordinal outcome (K),
number of time points (T), sample size (N) and rate of missingness (%) but also the form
of the distribution (well-balanced or skewed) of the ordinal outcome data. Both MI
methods was appraised by the relative bias and the mean square error of the regression
parameters of the model. The latter included a group effect and a time effect, as well as
their interaction.
Within the well-balanced setting, the model parameters were slightly underestimated in
the MNI approach as compared to the FCS OIM method which yielded almost unbiased
estimates. Except for the binary term where effects were less marked, both imputation
methods behaved similarly for each regression parameters. Under both MI methods, RB
decreased withK and the rate of missingness, increased with the number of assessment
time and was unchanged for the sample size (N). However, within each simulation
pattern, RB values derived under the FCS OIM were slightly better than those derived
under the MNI process. For all regression parameters, the MSE of both imputation
methods were comparable.
For skewed data, application of the MNI process led to a marked overestimation of the
regression coefficients of the binary and the interaction terms and an underestimation of
the time coefficient. Overall, estimates derived under FCS OIM process were less biased.
While, RB evolved differently according toK under both MI methods, it was only affected
by the rate of missingness under MNI. In both distribution settings, estimation of the time
effect coefficient was more biased than the other coefficients.
Although globally, simulations did not evidenced a large differences between the
performance of the two MI methods, some simulation patterns were clearly against MNI.
This was confirmed by the AP dataset where the ordinal outcome hadK=3 categories, a
skewed distribution and a large amount of missing data. Application of the two MI
methods led to different conclusions, in particular for the time effect.
method provides less biased results when imputing drop out cases than the MNI method.
In comparison with those findings where the RB difference between the two imputation
methods ranged from 9% to 16%, the difference between the MNI and the FCS OIM
method found here was much lower (3% to 8%). As far as the MSE is concerned, the
conclusions made for the non-monotone setting paralleled those found for the monotone
setting.
Based on the results of this large simulation study and application to QoL dataset, salient
conclusions may be drawn. Although theoretically unsuitable for ordinal data, the MNI
method with rounding imputation to the nearest integer value globally provided better
acceptable results than expected. However, as shown across the different simulation
patterns, some situations were less favorable for MNI than for FCS OIM. This remark was
reinforced by results of the QoL dataset where different conclusions applied according to
the MI method used. Finally, as for the analysis model, the choice of the imputation
method should be guided by the type of the data that needs to be imputed. Thus, it is
advisable to impute missing ordinal data using suitable MI method.
References
1. Olschewski, M., Schulgen, G., Schumacher, M. and Altman, D.G. Quality of life
assessment in clinical cancer research.British journal of cancer 1994. 70: 1–5.
2. Carpenter, J.R., Kenward, M. G. Missing data in randomised controlled trials a
practical guide Birmingham: National Institute for Health Research 2007. Available
atwww.missingdata.org.uk.1–206.
approach to nonresponse.Imputation and Editing of Faulty or Missing Survey Data
1978.1–32.
4. Rubin, D. B. Multiple imputations for nonresponse in survey . Wiley: New York,
1987.
5. Schafer, J. L. Multiple imputation for Nonresponse in Survey Chapman & Hall1997
6. Donneau, A.F., Mauer, M., Molenberghs, G. and Albert, A. A simulation study
comparing multiple imputation methods for incomplete longitudinal ordinal data.
2012submitted
7. Stupp R, Mason WP, van den Bent MJ et al. Radiotherapy plus concomitant and
adjuvant temozolomide for glioblastoma.New England Journal of Medicine 2005;
352(10):987–996.
8. Taphoorn MJ, Stupp R, Coens C et al. Health-related quality of life in patients with
glioblastoma: a randomized controlled trial.Lancet Oncology 2005; 6(12):937–944.
9. Aaronson NK, Ahmedzai S, Bergman B, Bullinger M, Cull A, Duez NJ, Filiberti A,
Flechtner H, Fleishman DB, De Haes JCJM, Kaasa S, Klee M, Osoba D, Razavi D,
Rofe P, Schraub S, Sneeuw K, Sullivan M, Takeda F. The European Organization
for Research and Treatment of Cancer QLQ-C30: A quality-of-life instrument for
use in international clinical trials in oncology.Journal of the National Cancer
Institute 1993; 85:365–376.
10. McCullagh, P. Regression models for ordinal data (with discussion).Journal of the
11. Lipsitz, SR., Kim, K., Zhao, L. Analysis of repeated categorical data using
generalized estimating equations.Statistics in Medicine 1994;13(11):1149–1163.
12. Little, R. J. A., Rubin, D. B.Statistical Analysis with Missing Data . Wiley: New
York, 1987.
13. Little, R. J. A. Pattern-mixture models for multivariate incomplete data. Journal
of the American Statistical Association 1993. 88:125–134.
14. Little, R. J. A. Modeling the drop-out mechanism in repeated measures studies.
Journal of the American Statistical Association 1995. 90:1112–1121.
15. Liang, K.-Y., Zeger, S. L. Longitudinal data analysis using generalized linear
models.Biometrika 1986; 73:13–22.
16. Robins, J. M., Rotnitzky, A. Semiparametric efficiency in multivariate regression
models with missing data.Journal of the American Statistical Association 1995;
90:122–129.
17. Robins, J. M., Rotnitzky, A., Zhao, L. Analysis of semiparametric regression
models with missing data.Journal of the American Statistical Association 1995;
90:106–121.
18. Rubin, D. B. Inference and missing data.Biometrika 1976; 63:581–592.
19. Beunckens, C., Sotto, C., Molenberghs, G. A simulation study comparing weighted
estimating equations with multiple imputation based estimating equations for
longitudinal binary data.Computational Statistics and Data Analysis 2008;
20. Tanner, M. A., Wong, W. H. The calculation of posterior distribution by data
augmentationJournal of American Statistical Association 1987, 82: 528–550.
21. Horton, N., Lipsitz, S., Parzen, M. A potential for bias when rounding in multiple
imputationThe American Statistician 2003, 57:229–232.
22. Ake, C. Rounding after multiple imputation with non-binary categorical covariates.
Paper presented at SAS Users Group international 2005. Thirty annual
conference,Philadelphia.
23. Allison, P. Imputation of categorical variables with PROC MIPaper presented at
SAS Users Group international 2005. Thirty annual conference,Philadelphia
24. White, Ian R. and Royston, Patrick and Wood, Angela M. Multiple imputation
using chained equations: Issues and guidance for practiceStatistics in
Medicine2011, 30(4):377–399.
25. van Buuren, S. Multiple imputation of discrete and continuous data by full
conditional specification Statistical Methods in Medical Research200716:219–242.
26. Ibrahim, N., Suliadi, S. Generating correlated discrete ordinal data using R and
SAS IMLComputer Methods and Programs in Biomedicine 2011;104(3):122–132.
27. Lee, A. J. Some simple methods for generating correlated categorical variates
Computational Statistics and Data Analysis 1997; 26:133–148.
28. Graham, J. W., Olchowski, A. E., Gilreath, T. D. How Many Imputations are
Really Needed? Some Practical Clarifications of Multiple Imputation Theory
29. Williamson, J., Lipsitz, S., Kim, K. GEECAT and GEEGOR: computer programs
for the analysis of correlated categorical response data.Computer Methods and
Programs in Biomedicine 1999;58:25–34 .
30. Lee, K. and Carlin, J. Multiple imputation for missing data: fully conditional
specification versus multivariate normal imputationAmerican Journal of
Epidemiology 201271:624–632.
31. Demirtas, H., Freels, S. and Yucel R. Plausibility of multivariate normality
assumption when multiply imputing non-Gaussian continuous outcomes: a
simulation assessment. Journal of Statistical Computation and Simulation 2008
10
App
endices
T able 8: Sim ulation res ults for the MI-GEE based MNI and OIM metho ds (K = 2 -W ell-balanced distribution) 0% 10% 3 0% 50% MNI F CS OIM MNI F CS OIM MNI F CS OIM T N P arm RB(%) MSE RB(%) MSE RB(%) MSE RB(%) MSE RB(%) MSE RB(%) MSE RB(%) MSE 3 1 00 βx 87.7 0.389 90.1 0.393 88.7 0.372 95.2 0.376 83.9 0.360 97.0 0.366 βt 104.2 0.037 106.0 0.038 107.0 0.037 111.9 0.040 109.4 0.0 39 116.6 0.043 βtx 96.9 0.075 98.5 0.076 98.0 0.073 102.4 0.075 93.2 0.074 102.6 0.081 3 3 00 βx 93.8 0.104 95.9 0.104 89.7 0.102 96.5 0.103 88.3 0.103 99.1 0.107 βt 99.1 0.012 100.4 0.012 99.2 0.012 103.2 0.013 105.6 0. 012 111.8 0.013 βtx 98.2 0.021 99.8 0.021 95.5 0.021 100.4 0.022 93.2 0.021 100.9 0.024 3 5 00 βx 75.5 0.071 79.1 0.071 72.9 0.066 79.9 0.067 72.0 0.067 84.4 0.068 βt 94.8 0.007 96.6 0.008 94.1 0.007 98.1 0.008 102.6 0.008 110.9 0.009 βtx 92.3 0.015 95.2 0.015 90.1 0.014 94.6 0.014 89.4 0.015 98.1 0.016 5 1 00 βx 112.6 0.186 113.7 0.187 118.4 0.195 119.8 0.196 113.5 0.1 95 120.5 0.201 βt 97.5 0.007 98.1 0.007 98.7 0.008 100.7 0.008 97.7 0.008 101.3 0.009 βtx 101.6 0.016 102.2 0.016 103.0 0.016 105.1 0.016 99.8 0.017 103.6 0.017 5 3 00 βx 105.1 0.063 106.3 0.63 102.8 0.063 105.5 0.065 103.4 0.064 110.6 0 .067 βt 97.6 0.002 98.4 0.003 96.9 0.003 99.1 0.003 95.6 0.003 100.3 0.003 βtx 99.7 0.005 100.6 0.005 98.1 0.005 100.2 0.005 96.8 0.005 101.2 0.006 5 5 00 βx 96.4 0.035 98.0 0.036 93.0 0.035 96.2 0.035 88.9 0.035 95.5 0.037 βt 96.3 0.001 97.3 0.001 94.5 0.001 96.8 0.001 91.5 0.001 95.8 0.001 βtx 98.4 0.003 99.4 0.003 96.9 0.003 99.2 0.003 93.9 0.003 98.5 0.003T able 9: Sim ulation res ults for the MI-GEE based on MNI and OIM metho ds (K = 3 -W ell-balanced distribution) 0% 10% 3 0% 50% MNI F CS OIM MNI F CS OIM MNI F CS OIM T N P arm RB(%) MSE RB(%) MSE RB(%) MSE RB(%) MSE RB(%) MSE RB(%) MSE RB(%) MSE 3 1 00 βx 137.2 0.298 140.8 0.296 131.0 0.315 131.0 0.307 118.6 0.3 27 115.8 0.308 βt 108.5 0.031 112.8 0.032 100.9 0.032 107.5 0.033 89.8 0.036 96.5 0.038 βtx 112.3 0.062 114.9 0.063 109.4 0.064 113.0 0.065 99.1 0.068 103.6 0.070 3 3 00 βx 112.9 0.091 115.2 0.090 104.1 0.096 106.7 0.093 102.1 0.0 97 100.8 0.093 βt 101.9 0.010 106.1 0.010 93.3 0.011 102.3 0.011 88.8 0.011 96.3 0.012 βtx 104.2 0.019 106.3 0.019 98.1 0.020 103.2 0.021 95.0 0.021 100.3 0.022 3 5 00 βx 97.4 0.053 99.4 0.052 99.6 0.054 100.7 0.053 92.6 0.058 92.9 0.055 βt 95.9 0.006 100.2 0.006 91.0 0.007 99.6 0.007 86.3 0.007 94.6 0.008 βtx 97.3 0.011 99.3 0.011 95.8 0.012 99.2 0.012 89.5 0.012 95.6 0.013 5 1 00 βx 122.0 0.147 122.5 0.146 117.9 0.150 116.7 0.150 118.4 0.1 54 120.0 0.152 βt 105.4 0.007 106.6 0.007 102.9 0.007 106.8 0.007 98.5 0.007 104.7 0 .007 βtx 103.6 0.011 104.4 0.011 101.0 0.012 103.1 0.012 98.7 0.012 102.6 0 .012 5 3 00 βx 115.1 0.049 115.4 0.049 114.0 0.049 117.1 0.049 116.4 0.0 50 118.3 0.051 βt 103.5 0.002 105.0 0.002 100.0 0.002 104.1 0.002 94.6 0.002 101.0 0 .002 βtx 102.3 0.004 103.2 0.004 100.2 0.004 103.0 0.004 98.0 0.004 102.5 0 .004 5 5 00 βx 98.9 0.030 99.8 0.030 97.9 0.031 99.6 0.030 93.6 0.031 97.1 0.031 βt 99.6 0.001 101.2 0.001 96.0 0.001 100.3 0.001 90.2 0.001 97.5 0.001 βtx 99.2 0.003 100.2 0.003 97.0 0.003 99.7 0.003 93.1 0.003 98.1 0.003
T able 10: Sim ulation re sults for the MI-GEE based on MNI and OIM metho ds (K = 4 -W ell-balanced distribution) 0% 10% 3 0% 50% MNI F CS OIM MNI F CS OIM MNI F CS OIM T N P arm RB(%) MSE RB(%) MSE RB(%) MSE RB(%) MSE RB(%) MSE RB(%) MSE RB(%) MSE 3 1 00 βx 73.6 0.318 77.7 0.312 63.0 0.332 70.8 0.317 67.0 0.368 72.9 0.340 βt 98.9 0.031 105.0 0.030 83.4 0.032 98.1 0.032 72.2 0.039 91.0 0.042 βtx 90.5 0.064 93.2 0.064 82.7 0.066 89.0 0.065 79.8 0.079 88.3 0.079 3 3 00 βx 93.2 0.098 96.6 0.097 92.5 0.109 101.1 0.104 84.9 0.119 98.1 0.111 βt 91.7 0.008 98.0 0.008 80.6 0.010 96.3 0.010 66.9 0.012 89.1 0.012 βtx 95.3 0.018 98.0 0.018 93.2 0.020 100.7 0.020 85.0 0.024 96.3 0.024 3 5 00 βx 100.3 0.057 104.4 0.056 94.2 0.059 103.5 0.057 81.4 0.067 95.1 0.063 βt 92.9 0.006 99.7 0.006 81.4 0.006 97.9 0.006 64.3 0.008 85.5 0.008 βtx 99.1 0.011 1022 0.011 93.4 0.012 101.3 0.012 85.3 0.014 96.6 0.015 5 1 00 βx 107.0 0.138 106.3 0.137 107.9 0.146 108.8 0.143 103.8 0.1 46 103.6 0.141 βt 100.9 0.006 102.4 0.006 97.9 0.006 102.7 0.006 90.1 0.006 98.0 0.007 βtx 103.4 0.011 104.3 0.011 102.1 0.011 104.5 0.011 97.5 0.011 101.7 0 .011 5 3 00 βx 110.3 0.047 110.9 0.047 110.0 0.048 110.0 0.048 103.1 0.0 52 104.1 0.050 βt 99.4 0.002 101.2 0.002 96.1 0.002 100.9 0.002 87.6 0.002 95.7 0.002 βtx 102.5 0.004 103.5 0.004 100.4 0.004 103.3 0.004 95.9 0.004 100.8 0 .004 5 5 00 βx 99.7 0.029 100.3 0.029 99.3 0.030 98.8 0.029 99.4 0.032 100.3 0.031 βt 97.7 0.001 99.6 0.001 93.9 0.001 99.0 0.001 87.9 0.001 96.2 0.001 βtx 99.8 0.002 100.9 0.002 98.0 0.002 100.8 0.002 95.0 0.003 100.0 0.003
T able 11: Sim ulation re sults for the MI-GEE based on MNI and OIM metho ds (K = 5 -W ell-balanced distribution) 0% 10% 3 0% 50% MNI F CS OIM MNI F CS OIM MNI F CS OIM T N P arm RB(%) MSE RB(%) MSE RB(%) MSE RB(%) MSE RB(%) MSE RB(%) MSE RB(%) MSE 3 1 00 βx 105.1 0.289 107.1 0.284 104.4 0.293 108.9 0.281 89.7 0.305 95.2 0.276 βt 99.4 0.028 105.4 0.028 87.6 0.030 102.0 0.031 76.1 0.032 97.0 0.034 βtx 94.4 0.056 96.7 0.056 88.6 0.057 93.7 0.057 81.3 0.059 90.0 0.058 3 3 00 βx 118.8 0.083 121.5 0.081 113.6 0.087 120.1 0.085 105.2 0.0 91 105.0 0.083 βt 103.3 0.009 109.5 0.009 90.9 0.010 108.3 0.011 76.0 0.012 94.3 0.012 βtx 99.8 0.016 102.3 0.016 94.0 0.018 100.7 0.019 86.3 0.020 93.4 0.020 3 5 00 βx 103.7 0.049 106.6 0.049 100.4 0.052 106.4 0.050 97.2 0.056 98.2 0.051 βt 98.8 0.005 105.1 0.005 87.7 0.006 105.4 0.006 74.3 0.007 92.9 0.007 βtx 97.7 0.010 100.1 0.010 92.9 0.011 99.6 0.011 87.8 0.012 94.9 0.012 5 1 00 βx 87.5 0.155 88.3 0.152 83.4 0.169 83.6 0.164 85.4 0.172 86.3 0.161 βt 94.3 0.005 95.6 0.005 89.9 0.006 94.1 0.006 85.8 0.006 94.7 0.007 βtx 96.7 0.010 97.3 0.010 94.2 0.011 96.3 0.011 92.2 0.012 96.2 0.011 5 3 00 βx 88.0 0.044 88.8 0.044 88.8 0.047 89.8 0.046 85.6 0.050 85.6 0.048 βt 99.3 0.002 100.7 0.002 95.7 0.002 101.7 0.002 88.1 0.002 99.0 0.002 βtx 98.0 0.003 98.8 0.003 96.2 0.003 99.3 0.003 92.7 0.004 98.1 0.004 5 5 00 βx 88.1 0.026 88.3 0.026 87.2 0.028 87.7 0.027 86.8 0.029 87.6 0.028 βt 98.8 0.001 100.2 0.001 94.2 0.001 100.0 0.001 88.4 0.001 100.1 0.001 βtx 98.2 0.002 98.9 0.002 95.7 0.002 98.8 0.002 93.1 0.002 99.1 0.002
T able 12: Sim ulation re sults for the MI-GEE based on MNI and OIM metho ds (K = 7 -W ell-balanced distribution) 0% 10% 3 0% 50% MNI F CS OIM MNI F CS OIM MNI F CS OIM T N P arm RB(%) MSE RB(%) MSE RB(%) MSE RB(%) MSE RB(%) MSE RB(%) MSE RB(%) MSE 3 1 00 βx 89.7 0.266 91.7 0.258 80.3 0.281 86.3 0.262 79.9 0.300 85.7 0.257 βt 81.1 0.029 90.7 0.029 60.7 0.033 77.4 0.033 40.7 0.038 64.6 0.037 βtx 95.0 0.051 98.3 0.051 87.5 0.053 94.3 0.052 84.0 0.060 89.0 0.057 3 3 00 βx 88.4 0.091 91.1 0.090 83.8 0.100 90.4 0.094 76.0 0.112 84.6 0.102 βt 78.6 0.011 86.7 0.010 62.0 0.013 81.3 0.012 37.7 0.017 61.9 0.016 βtx 92.2 0.018 95.0 0.018 86.7 0.019 93.1 0.019 80.9 0.023 89.6 0.022 3 5 00 βx 90.0 0.053 93.3 0.052 82.1 0.058 87.9 0.053 74.7 0.066 80.6 0.060 βt 81.4 0.005 89.9 0.005 63.7 0.007 83.5 0.006 38.1 0.011 63.0 0.009 βtx 92.6 0.010 95.7 0.010 85.8 0.011 92.3 0.010 80.3 0.013 87.5 0.013 5 1 00 βx 106.6 0.142 107.5 0.141 112.4 0.145 105.6 0.139 106.1 0.1 58 101.3 0.146 βt 99.5 0.005 101.8 0.005 96.0 0.005 100.1 0.005 89.0 0.006 94.6 0.006 βtx 100.1 0.010 101.3 0.010 99.1 0.011 100.4 0.011 94.6 0.012 97.3 0.012 5 3 00 βx 100.8 0.046 100.9 0.046 102.5 0.048 101.1 0.048 104.1 0.0 52 98.4 0 .051 βt 99.2 0.002 101.8 0.002 94.3 0.002 100.5 0.002 89.5 0.002 97.6 0.002 βtx 99.5 0.004 100.8 0.004 97.5 0.004 100.9 0.004 95.3 0.004 100.0 0.004 5 5 00 βx 98.0 0.027 98.2 0.027 101.0 0.029 99.3 0.028 101.3 0.031 98.10 0.030 βt 99.0 0.001 101.7 0.001 95.6 0.001 102.6 0.001 88.1 0.001 98.5 0.001 βtx 98.8 0.002 100.2 0.002 96.8 0.002 100.3 0.002 93.7 0.002 99.4 0.002
T able 13: Sim ulation re sults for the MI-GEE based on MNI and OIM metho ds (K = 2 -Sk ew ed distribution) 0% 10% 3 0% 50% MNI F CS OIM MNI F CS OIM MNI F CS OIM T N P arm RB(%) MSE RB(%) MSE RB(%) MSE RB(%) MSE RB(%) MSE RB(%) MSE RB(%) MSE 3 1 00 βx 104.2 0.680 104.4 0.685 101.0 0.673 101.3 0.687 104.2 0.7 06 106.1 0.744 βt 95.8 0.059 99.8 0.059 74.2 0.066 90.0 0.066 72.8 0.077 98.8 0.081 βtx 103.9 0.135 104.4 0.137 98.4 0.136 99.0 0.144 103.4 0.151 105.0 0.168 3 3 00 βx 103.8 0.214 104.3 0.216 102.9 0.210 104.0 0.217 101.3 0.2 17 103.6 0.233 βt 101.0 0.020 107.7 0.020 87.8 0.021 107.9 0.021 71.7 0.023 107.7 0.024 βtx 105.5 0.044 106.4 0.045 103.6 0.044 105.4 0.047 101.1 0.0 46 104.7 0.052 3 5 00 βx 101.9 0.120 102.3 0.121 100.8 0.118 102.1 0.122 100.7 0.1 14 102.9 0.123 βt 97.8 0.012 104.1 0.012 81.5 0.013 102.2 0.013 72.6 0.014 108.9 0.015 βtx 102.2 0.026 102.8 0.027 100.0 0.026 102.3 0.028 101.1 0.0 25 104.6 0.030 T able 14: Sim ulation re sults for the MI-GEE based on MNI and OIM metho ds (K = 3 -Sk ew ed distribution) 0% 10% 3 0% 50% MNI F CS OIM MNI F CS OIM MNI F CS OIM T N P arm RB(%) MSE RB(%) MSE RB(%) MSE RB(%) MSE RB(%) MSE RB(%) MSE RB(%) MSE 3 1 00 βx 100.4 0.366 100.0 0.368 100.5 0.355 98.00 0.353 103.0 0.3 40 99.4 0.333 βt 125.3 0.037 113.3 0.038 159.4 0.041 124.5 0.040 205.6 0.0 48 144.4 0.041 βtx 100.8 0.073 99.4 0.074 101.7 0.069 96.70 0.072 107.9 0.070 101.1 0 .075 3 3 00 βx 100.7 0.117 99.9 0.116 101.9 0.115 99.7 0.114 102.1 0.115 98.8 0.114 βt 123.5 0.013 109.6 0.013 155.5 0.016 116.9 0.014 199.8 0.0 23 129.3 0.015 βtx 101.8 0.024 99.8 0.024 104.5 0.024 99.0 0.025 105.8 0.024 97.7 0.026 3 5 00 βx 101.7 0.072 100.8 0.071 102.2 0.069 100.3 0.068 104.2 0.70 101.3 0 .070 βt 122.8 0.008 108.7 0.008 155.4 0.010 116.5 0.008 201.8 0.0 18 130.8 0.009 βtx 103.6 0.014 101.4 0.014 105.3 0.013 100.5 0.014 109.2 0.0 13 102.0 0.015
T able 15: Sim ulation re sults for the MI-GEE based on MNI and OIM metho ds (K = 4 -Sk ew ed distribution) 0% 10% 3 0% 50% MNI F CS OIM MNI F CS OIM MNI F CS OIM T N P arm RB(%) MSE RB(%) MSE RB(%) MSE RB(%) MSE RB(%) MSE RB(%) MSE RB(%) MSE 3 1 00 βx 109.3 0.298 107.3 0.289 111.7 0.325 106.4 0.303 117.8 0.3 38 108.7 0.303 βt 108.3 0.032 116.9 0.032 99.8 0.033 114.9 0.035 107.7 0.033 117.0 0 .036 βtx 109.4 0.060 107.3 0.060 111.8 0.065 106.7 0.068 121.1 0.0 68 111.1 0.070 3 3 00 βx 102.9 0.103 101.2 0.100 108.0 0.106 102.9 0.098 110.9 0.1 20 102.2 0.106 βt 91.6 0.011 100.6 0.011 90.4 0.010 107.2 0.011 96.9 0.011 113.0 0.011 βtx 101.4 0.020 100.1 0.020 108.5 0.019 103.6 0.019 113.0 0.0 22 103.1 0.023 3 5 00 βx 102.5 0.060 100.9 0.058 105.6 0.063 100.7 0.058 110.0 0.0 72 101.5 0.061 βt 91.9 0.006 101.8 0.006 86.2 0.006 103.7 0.006 96.2 0.006 112.3 0.007 βtx 102.2 0.010 101.1 0.010 105.2 0.011 100.6 0.011 112.4 0.0 12 103.1 0.013 T able 16: Sim ulation re sults for the MI-GEE based on MNI and OIM metho ds (K = 5 -Sk ew ed distribution) 0% 10% 3 0% 50% MNI F CS OIM MNI F CS OIM MNI F CS OIM T N P arm RB(%) MSE RB(%) MSE RB(%) MSE RB(%) MSE RB(%) MSE RB(%) MSE RB(%) MSE 3 1 00 βx 101.7 0.321 100.2 0.314 104.4 0.341 99.5 0.331 110.4 0.388 101.0 0.359 βt 84.2 0.029 92.1 0.029 73.4 0.034 87.0 0.035 61.4 0.038 70.7 0.040 βtx 101.3 0.060 99.9 0.060 105.6 0.067 100.0 0.069 115.0 0.080 103.2 0.082 3 3 00 βx 99.9 0.097 98.4 0.095 101.9 0.106 97.5 0.101 106.6 0.122 97.9 0.113 βt 86.8 0.009 94.4 0.008 73.8 0.010 87.9 0.010 63.2 0.012 76.3 0.013 βtx 100.9 0.019 99.4 0.019 102.5 0.021 98.0 0.021 110.2 0.025 99.1 0.026 3 5 00 βx 100.3 0.056 98.9 0.054 103.7 0.062 99.4 0.058 107.0 0.071 98.7 0.063 βt 86.4 0.005 94.9 0.005 77.1 0.006 91.4 0.006 62.5 0.008 76.7 0.008 βtx 100.3 0.011 99.1 0.011 104.7 0.012 100.2 0.012 109.5 0.014 99.3 0.014
T able 17: Sim ulation re sults for the MI-GEE based on MNI and OIM metho ds (K = 7 -Sk ew ed distribution) 0% 10% 3 0% 50% MNI F CS OIM MNI F CS OIM MNI F CS OIM T N P arm RB(%) MSE RB(%) MSE RB(%) MSE RB(%) MSE RB(%) MSE RB(%) MSE RB(%) MSE 3 1 00 βx 102.5 0.285 101.5 0.277 105.8 0.307 100.6 0.281 109.8 0.3 37 99.5 0.289 βt 81.6 0.028 91.2 0.028 69.2 0.030 88.9 0.029 52.6 0.032 76.7 0.032 βtx 97.4 0.056 96.8 0.056 102.8 0.060 96.4 0.060 109.3 0.066 95.1 0.064 3 3 00 βx 102.7 0.093 101.4 0.091 105.8 0.102 101.7 0.094 108.4 0.1 14 100.5 0.099 βt 92.1 0.008 100.9 0.008 78.2 0.009 102.5 0.009 57.4 0.011 88.0 0.010 βtx 102.8 0.016 101.8 0.016 106.6 0.018 102.2 0.018 110.4 0.0 21 99.6 0.020 3 5 00 βx 102.8 0.058 101.6 0.057 106.5 0.064 102.4 0.058 109.6 0.0 74 102.1 0.063 βt 88.9 0.005 97.8 0.005 76.3 0.006 99.9 0.005 56.5 0.008 88.7 0.006 βtx 102.6 0.011 101.4 0.011 107.4 0.012 102.8 0.011 112.9 0.0 14 102.6 0.013