1210 Brussels Belgium Tel.: +32 (0)2 224 04 70 Fax: +32 (0)2 224 05 02 etui@etui.org www.etui.org ...
Why have some countries become
more unemployed than others?
An investigation of changes in unemployment
in EU member states since 2008
—
Martin Myant and Agnieszka Piasna
...
more unemployed than others?
An investigation of changes in unemployment
in EU member states since 2008
—
Martin Myant and Agnieszka Piasna
Working Paper 2014.07
Brussels, 2014
©Publisher: ETUI aisbl, Brussels All rights reserved
Print: ETUI Printshop, Brussels D/2014/10.574/23 ISSN 1994-4446 (print version) ISSN 1994-4454 (pdf version)
The ETUI is financially supported by the European Union. The European Union is not responsible for any use made of the information contained in this publication.
Introduction ... 5
The current situation ... 7
Conflicting explanations ... 8
The consequences of a construction bubble and budgetary policies ... 10
Wage restraint does not preserve jobs ... 12
UK – low wages create employment? ... 15
Ireland – parallel growth of jobs and wages ... 17
Spain – no replacement for construction? ... 18
Germany – apparent stability ... 19
Italy – job growth on shaky foundations ... 21
Latvia – the flight of the unemployed ... 22
Conclusions ... 26
Appendix ... 27
Introduction
Unemployment has risen across the European Union since the crisis of 2008. Reducing that level is a prominent stated aim of policy makers across the political spectrum. However, the means advocated for achieving this vary widely with some focusing on restoring demand for labour by higher spending and investment (eg ETUC 2013) and others putting faith in flexibility in labour markets to achieve greater employment creation (eg BusinessEurope 2014). Various mechanisms have been postulated as to what the latter would mean, but the clearest in terms of economic theory equates flexibility with falling pay levels where demand for labour appears inadequate. Lower pay should then lead to higher employment as employers can profitably take on more employees and, in line with the thinking behind the approach of ‘internal devaluation’, as export costs are reduced and international competitiveness improved (eg ECB 2012). Although rarely presented so starkly, this was the clear message behind warnings of excessive unit labour costs in a number of EU member states put by ECB President Mario Draghi (2013).
The aim of this paper is to provide a basis for policy choices by investigating the causes of recent increases in unemployment. It uses data across EU member states to investigate links between employment changes and both sectoral developments and changes in earnings levels. The significance of the results is further elucidated by comparison of developments in six EU member states which have had different unemployment and employment experiences. This case-study approach makes it possible to follow changes in unemployment and employment in some detail, broken down by branches of activity, and to link it to other changes in the economy and to pay levels.
Focusing on a breakdown by sectors means that we do not rely on macroeco -nomic theories of unemployment which typically deal with a single variable for the whole economy (for a standard survey of the approach in economic theory to unemployment, see Summers 2008; for an overview of theories, see Layard
et al. 2005). That approach is not appropriate for present purposes for two reasons. The first is that we are looking at determinants of changes over a relatively short time period - albeit one already looking rather long to be described as a ‘short-run’ - and not seeking to explain differences in absolute levels between countries, a more complex and difficult task that would require more and different tools from those deployed here. That might indeed point to differences following from labour-market conditions. It would also require much more substantial analyses of institutional and structural features of economies. Focusing on changes and relating them to the most clearly identifiable element of flexibility, movements in pay levels, avoids the need for so broad an analysis.
The second, and related, reason for a sectoral breakdown to follow employment trends is that macroeconomic studies focusing on single variables for employment and unemployment levels, similarly to the standard text-book accounts of unemployment, implicitly assume a unified labour market such that all labour is interchangeable, at least once the ‘long-run’ has arrived (eg
Bernal-Verdugo et al2012). Someone losing a job in one activity should be able
easily to move to another. The behaviour of individual branches of economic activity would then be irrelevant to the total level of unemployment.
Over the time period considered here, unemployment may be overwhelmingly structural, meaning that it stems from changes in particular branches of activity and that labour is not easily transferable between branches. There is a wealth of evidence on cases of persistent, structural unemployment,
particularly from sociological studies after workplace closures (eg Bailey et al.
2012) and from investigations of depressed regions in which new economic activity has developed only gradually, with great difficulty and after very
considerable public policy support (eg Waddington et al. 2001). There is also
clearly evidence of changes in employment structures, albeit most obviously where those with higher levels of qualifications can transfer to new activities and higher pay levels. Rather than making assumptions for or against the possibility of speedy and automatic adjustment, our study is intended to investigate the extent to which these propositions approximate to reality. A key finding is that an explanation based on labour market flexibility, and hence a remedy focusing on reducing employment protection and pay levels, receives very little support from the evidence presented here. It cannot be refuted in total in all cases, but there is so much evidence from the comparative data presented that does not support this explanation as to cast serious doubts on its usefulness in any but exceptional cases. On the other hand, plenty of data supports an explanation based around sectoral changes in the economy alone, following from the effects of the financial crisis, from changes in public spending policies and from ongoing transformations towards economies based on higher skill and qualification levels. That therefore appears to be a better starting point for policy making.
The policy implications of the two approaches set out here will be rather different. If unemployment has been caused by specific structural problems and if it is not automatically reduced by market processes, then more active policies will clearly be required. These may include policies to restore investment levels, justified already by the extent to which they have fallen, and to help transformation of economies towards new activities. In current conditions, that means transformation towards activities requiring highly-qualified labour, which is also likely to be highly paid, rather than towards reducing pay levels in the hope that more employment opportunities will then appear.
The current situation
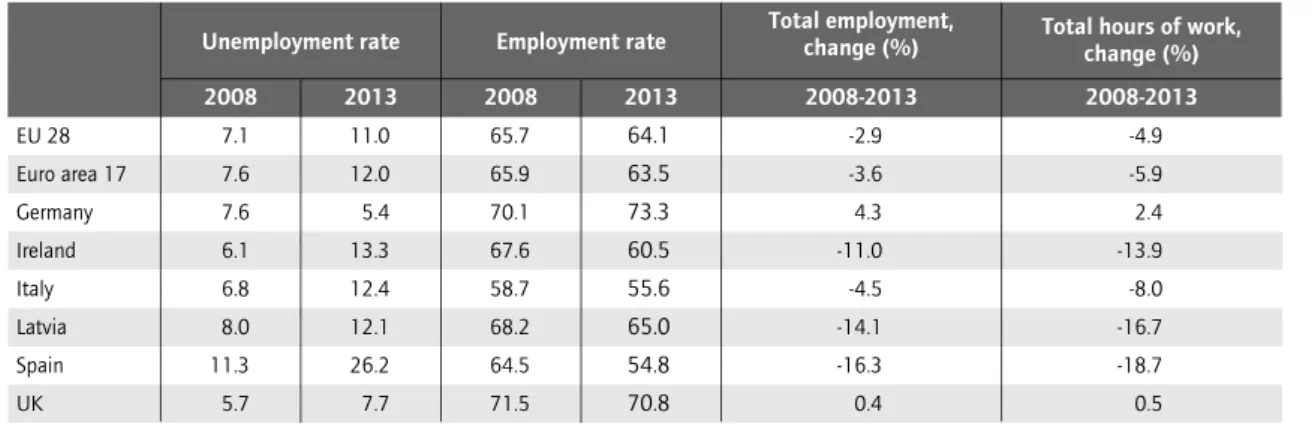
The head-line variable followed by policy makers is the level of unemployment. Table 1 shows how the level has increased in a selection of EU member states, which are used later as case studies, including some with very high levels, some with quite small increases and one with a decrease: they are also appropriate as they demonstrate a range of rather different experiences. However, there is in all countries a significant inactive population that does not appear as unemployed. Using survey-based methods for measuring unemployment, as in ILO and Eurostat data, does not eliminate the difficulties this causes, for example if individuals give up seeking work altogether. This factor may have changed to some extent over the 2008 to 2013 period not least due to a demonstrable increase in employment in the 50-64 age group: many of these could previously quietly have left the labour force. Indeed, early exit from the labour market of older workers was the policy solution to high unemployment levels in previous recessions (for the UK cf Department of Employment 1978). Unemployment levels can also be affected by changes in the total potential labour force, most strikingly because of emigration or immigration. The unemployment figure should therefore be read alongside figures for changes in activity rates and employment levels, as shown in columns 4 to 6 of Table 1.
A comparison confirms a link between rising unemployment and falling employment rates, but it is not exact. In fact, it rather appears that people have disappeared in some countries while in Germany one might expect a larger fall in unemployment in view of the recorded increase in employment. An important factor here is population movements and a striking case where these influence the labour market is that of Latvia, as indicated in a separate section below. A further complication is that following only numbers in work may disguise a shift towards working shorter hours, a trend that can be followed in aggregate from data on total hours worked. This is difficult to measure accurately and,
Table 1 Impact of the crisis on employment, age 15-64
EU 28 Euro area 17 Germany Ireland Italy Latvia Spain UK
Source: Eurostat (lfsa_ergan; lfsa_urgan; lfsa_eftpt; lfsa_ewhan2), own calculations. 2008 7.1 7.6 7.6 6.1 6.8 8.0 11.3 5.7 2013 11.0 12.0 5.4 13.3 12.4 12.1 26.2 7.7 Unemployment rate 2008 65.7 65.9 70.1 67.6 58.7 68.2 64.5 71.5 2013 64.1 63.5 73.3 60.5 55.6 65.0 54.8 70.8 Employment rate 2008-2013 -2.9 -3.6 4.3 -11.0 -4.5 -14.1 -16.3 0.4 Total employment, change (%) 2008-2013 -4.9 -5.9 2.4 -13.9 -8.0 -16.7 -18.7 0.5 Total hours of work,
although total hours are recorded in various statistical sources, there are doubts over the reliability of figures. The final column in Table 1 shows the percentage changes in total hours which can be compared with changes in employment levels. It is apparent that changes in the total number of employees explain almost all the variations in total labour input in a number of countries, while varying hours worked is more important especially in
Germany and Italy.1We do not know from these figures whether hours have
varied for people in full-time employment or whether full-time jobs have disappeared to be replaced by part-time. The two could have very different implications for the position of employees. Across the EU as a whole, there has been an increase in part-time employment, but there are wide and persistent differences in levels between countries.
Thus, to summarise, the available data show a significant increase in unemployment across the EU after 2008, but with quite large variations between countries. The key driver is changes in the levels of employment which is the figure now to be explained.
Conflicting explanations
The next stage is to set out two clearly alternative explanations for changes in employment levels and then to test them on individual countries, bearing in mind where appropriate the complicating factors set out above. The first focuses on structural changes in the economy while the second focuses on the functioning of the labour market without reference to other aspects of the economy.
1. In the first line of explanation the key is structural change. The most prominent element here that fits most clearly with observed differences in unemployment is the dramatic decline in the construction sector where it had previously benefited from easy finance. When that stopped, employment fell and unemployment rose. This is easily testable and can be compared across countries. The functioning of the labour market (at least as policy makers have understood it) is of limited relevance to this. Reducing pay levels does not create more jobs when construction activity has undergone a dramatic collapse. Other aspects of structural change in economies that are likely to play a significant role are changes in public sector employment, continuing reductions in manufacturing employment as production migrates between countries and new employment creation in expanding branches of industry and services. The policy implication is that reducing wage levels where
1. Figures for the UK in Table 1 show a reverse pattern than in other countries, with the number of working hours increasing more than the number of jobs. This is partly related to an overall increase in average actual hours worked in the UK, despite the shift towards part-time work consistent with the trend in other countries. The proportions reverse for the total population aged 15 years or more, with employment increasing more (by 1.6%) than working hours (1.4%) over the same period.
employment has fallen does not provide any solution. Instead, the need is for measures that increase employment, including public investment, support to structural changes in the economy and active steps to improve skill levels and bring them into line with the needs of new and growing sectors.
2. The second line of argument is that the key is labour market flexibility (eg BusinessEurope 2007; 2014). Thus structural changes may be taking place, but they should not lead to lower aggregate employment if employees move to where new employment opportunities can be expected to appear. The term flexibility has been used in a very broad way to justify changes that affect contractual arrangements and working hours and more indirectly pay levels. It has been linked to changes in a number of countries that include simplified procedures for both collective and individual dismissal and reduced notification periods and temporary removal of restrictions for non-standard employment. There have been changes to allow more flexibility in scheduling working time and active labour market policies have been weakened in a number of countries (Clauwaert and Schömann 2012; Lang, Clauwaert, and Schömann 2013; Meardi and Trappmann 2013). Such an approach can be understood from the side of preparing current or potential employees for available work or, as is often the case, in terms of financial incentives to employers to provide work and to potential employees to take what is available. Thus, in this line of argument, the unemployed would be able to find employment if they worked exactly as an employer wants and if wages were low enough. This is blocked by rules such as minimum wages, collective bargaining systems and extension of collective agreements across sectors. In concrete terms, the implication of this line of argument would be that unemployed construction workers could find alternative employment, either at lower pay in the construction sector or in newly-created jobs in other sectors. Similarly, the decline in other sectors would be compensated by growth elsewhere, if pay were low enough. Permanently high unemployment, it would therefore seem, reflects problems in the labour market that can be resolved by liberalisation and deregulation.
It is neither realistic nor necessary to try to test this line of argument by looking at changes in laws and regulations introduced since 2008. The point is rather to see whether apparently more flexible labour market forms allow for more rapid absorption of the unemployed back into employment. The key element that can be measured is the cost of labour to employers. If this can fall, so it is argued, it should be easier to find more employment places. Thus the obvious point to test, and the most clearly suggestive of support for this hypothesis, is whether lower pay is associated with recovery in employment levels. Other outcomes, such as wages and employment both rising or falling together or the absence of any consistent relationship across countries suggest that the hypothesis is likely to be false or, at best, that it needs to be supplemented with further explanations for apparent anomalies.
It should be added that conclusions reached from testing these two lines of argument do not demonstrate all the causes of differences in employment
levels or in how they have changed since 2008. We cannot demonstrate fully why some structural changes take place in one country and not another, but we can cast very substantial doubts on explanations that focus on labour markets alone. More evidence would be required to investigate other barriers to structural change, or factors that may make such change possible, beyond the labour market as normally understood. These could include active policies that are often used to bring about structural changes as are often applied to deal with situations after large-scale closures or in permanently depressed regions. Thus it often seems to be taken for granted that structural transformations do not take place spontaneously. Indeed, they may be partly blocked in those countries where financial and banking systems are functioning particularly badly and where public spending is the most constrained. Thus the issue is likely to be one of adaptability of the economy as a whole (including government policies and the financial system) rather than the labour market in isolation. Investigating such issues and incorporating them into a full explanation for changes in employment levels is beyond the scope of the current paper.
The consequences of a construction bubble and
budgetary policies
We start with a comparison across all EU member states of changes in employment to demonstrate the importance of particular sectors. The key ones are construction and various public sector activities. The link is very clear between overall changes in employment levels and construction-sector employment, particularly in those countries that experienced a pre-crisis construction boom. Changes in employment in the public sector are also country-specific, as financial and economic crisis had a far less direct impact than subsequent decisions about public spending and the extent of austerity pursued. Thus, as shown in Table 2, in all EU countries that experienced a decline in total employment as well as in construction sector employment, job losses in construction were out of proportion to the size of this sector. In Ireland, 60% of the overall job losses between 2008 and 2013 consisted of construction jobs while this sector employed only 11% of the workforce in 2008.
Although the construction sector accounted for a substantial share of job losses across the EU, it was affected by the crisis differently in different countries. One reason for such cross-country differences is the extent of a construction bubble before the crisis. In countries where employment in construction exploded between 2000 and 2008, largely fuelled by availability of easy finance, it also collapsed much more than in others. This is evident in the comparison of Latvia, Spain and Greece with Germany and Czech Republic, although not all countries fit the pattern. For instance, collapse in Portugal was not preceded by boom.
Another explanation is the skill composition of the workforce in construction. As a general pattern, the number of manual workers (i.e. craft workers,
operators and assemblers) dropped across the EU (except Belgium), even where construction saw overall growth. On the other hand, a number of jobs for white collar professionals (i.e. professionals, technicians and associate professionals) either increased or declined much less than among manual workers. It also seems that in countries where the construction sector was more oriented towards high-skilled white collar positions, it also fared better in the crisis. Orientation towards more complex and knowledge intensive activities is associated with less vulnerability of the construction sector to decreased access to credit, probably because it is more linked to larger-scale and often public-sector projects. This is likely also to be linked to the extent to which the orientation is towards construction of buildings, civil engineering (e.g. roads, railways, utilities) and specialised construction activities. It appears that orientation towards construction of buildings is related to the greatest sensitivity to availability of credit, expanding in the boom and collapsing in the crisis. In Spain 52% of construction workers worked in that domain in 2008, 75% in Latvia, 66% in Portugal and 48% in Ireland, while only 21% in Germany and 8% in the UK.
Table 2 Employment in construction, 2008-2013
Latvia Bulgaria Lithuania Romania Estonia Slovakia Spain Ireland Slovenia Sweden UK Greece Belgium France Italy Austria Finland Hungary Poland Netherlands Czech Republic Denmark Portugal Germany
(1) In countries where both the total number of jobs and jobs in construction declined between 2008 and 2013. Source: Eurostat (lfsa_egana; lfsa_egan2), own calculations.
2008 221 202 190 184 183 155 144 143 139 137 135 133 127 127 124 122 121 117 115 113 110 108 94 82 2013 119 123 121 170 131 139 60 61 112 140 109 57 130 117 99 121 113 94 110 91 95 87 51 88 Change in employment, 2000=100 2008 12 10 11 8 12 11 12 11 7 7 9 9 7 7 9 9 7 8 8 6 10 7 11 7 Share of sector in total
employment 2008-2013 39 32 42 : 63 24 43 60 15 : : 25 : 65 39 : 12 : 21 36 70 20 41 :
Job loss in construction as % of total job loss (1)
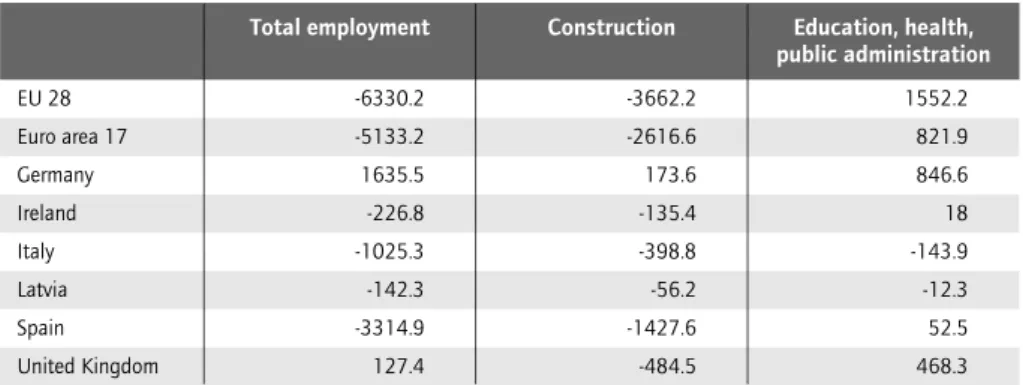
Table 3 includes data from various typically public sector activities which were both significant and differentiated across the EU. In countries where the greatest number of jobs were lost, and mainly in construction, the policies of budgetary discipline also hindered the growth in the public sector. On the other hand, employment growth in countries that appear to have performed relatively well in the crisis was largely due to the expansion of public services. The next section sets these employment changes against wage developments, aiming to shed light on the hypothesis that wage reductions where demand for labour has fallen might lead to employment growth.
Wage restraint does not preserve jobs
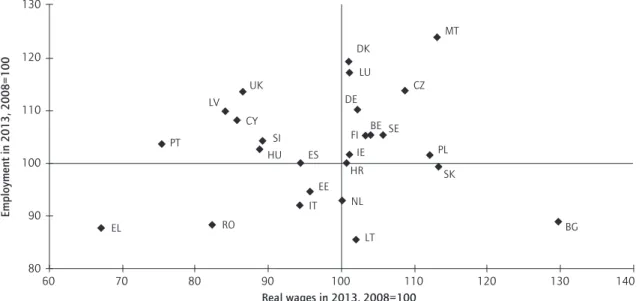
The figures below follow four sectors that were crucial for employment changes. Presenting data on scatter diagrams indicates in visual form the absence of any relationship between employment changes and earnings changes. It is clear that, for manufacturing and construction, in no EU country was a reduction in real wages accompanied by job growth (Figures 1 and 2). On the contrary, rare examples of growth in employment occurred only in parallel with wage growth (i.e. Austria, Germany, Sweden and Belgium), while real wages in manufacturing declined only in a handful of countries, including the UK, Lithuania, Portugal and Greece. This did not translate into different employment outcomes compared to countries with increasing wages. Thus, for example, real earnings in manufacturing and in construction declined in the UK and increased in Italy, yet employment declines between 2008 and 2013 in both countries were almost exactly the same. Considerable cuts in real earnings in Greece, by around 20 per cent over 2008-2013, led to no significant improvement in comparison to Spain that saw a small increase in wages. If any pattern emerges, it is rather a positive correlation. Smaller job losses were associated with moderately increasing real earnings at a sector level, while more substantial job shedding went hand in hand with wage cuts.
Overall, education and health sectors across the EU largely continued the pre-crisis growth trends, related to population ageing and prolongation of
Table 3 Change in employment (in ‘000s), 15-64 years old, 2008-2013
EU 28 Euro area 17 Germany Ireland Italy Latvia Spain United Kingdom Total employment -6330.2 -5133.2 1635.5 -226.8 -1025.3 -142.3 -3314.9 127.4 Construction -3662.2 -2616.6 173.6 -135.4 -398.8 -56.2 -1427.6 -484.5 Education, health, public administration 1552.2 821.9 846.6 18 -143.9 -12.3 52.5 468.3 Source: Eurostat (lfsa_egan2).
education, yet mostly at a much slower pace. Developments in these largely public sector activities show no clear connection between declining wages and employment growth (Figures 3 and 4). The health sector did not expand in Greece and Lithuania, where real wages declined, and nor did it expand in the Netherlands, Denmark, Sweden and Bulgaria, where wages increased. In 60 70 80 90 100 110 80 90 100 110 120 130 Real wages in 2013, 2008=100 E m p lo ym e n t in 2 0 1 3 , 2 0 0 8 = 1 0 0 EL ES DK SI SE SK IT IE BE EE LV FR BG RO FI NL CZ AT HU DE MT LU PL CY HR UK LT PT
Figure 1 Comparison of changes in real wages and employment in manufacturing, 2008-2013,
population aged 15-64
Source: Eurostat (lc_lci_r2_a; prc_hicp_aind; lfsa_egan2), own calculations.
40 50 60 70 80 90 100 110 70 80 90 100 110 120 130 Real wages in 2013, 2008=100 E m p lo ym e n t in 2 0 1 3 , 2 0 0 8 = 1 0 0 EL ES DK SI SE SK IT BE EE LV FR BG RO FI NL CZ AT HU DE MT LU PL CY HR UK LT PT IE
Figure 2 Comparison of changes in real wages and employment in construction, 2008-2013,
population aged 15-64
Greece, enormous cuts in wages in the health and education sectors did not prevent a decline in the number of jobs. Healthcare workers in Italy and the UK took pay cuts, which did not translate into significantly different job growth in comparison to Germany or Slovakia.
80 90 100 110 120 130 60 70 80 90 100 110 120 130 140 Real wages in 2013, 2008=100 E m p lo ym e n t in 2 0 1 3 , 2 0 0 8 = 1 0 0 EL ES DK SI SE SK IT BE EE LV BG RO FI NL CZ HU DE MT LU PL CY HR UK LT PT IE
Figure 3 Comparison of changes in real wages and employment in education, 2008-2013,
population aged 15-64
Source: Eurostat (lc_lci_r2_a; prc_hicp_aind; lfsa_egan2), own calculations.
90 100 110 120 130 50 60 70 80 90 100 110 120 130 Real wages in 2013, 2008=100 E m p lo ym e n t in 2 0 1 3 , 2 0 0 8 = 1 0 0 EL ES DK SI SE SK IT BE EE LV BG RO FI NL CZ HU DE MT LU PL CY HR UK LT PT IE
Figure 4 Comparison of changes in real wages and employment in health, 2008-2013,
population aged 15-64
These figures demonstrate no clear link between changes in wages and changes in employment, but they are not enough for any firm conclusions. There could be many other influences at work obscuring particular relationships. It is therefore valuable to look in more detail at individual countries. We therefore test our possible explanations with information from six countries; UK, Ireland, Spain, Germany, Italy and Latvia. This sample, as indicated in relation to Table 1, includes countries with very different unemployment and employment experiences.
UK – low wages create employment?
Real wages in the UK fell every year from 2008 to 2013 and employment appears to have done relatively well. The total number working, and also total hours, also started increasing in the UK from a low point in December 2009. The workforce in 2013 was larger than it had ever been before although, as indicated in Table 1, the employment rate had fallen slightly due to the effect
of a larger population in the relevant age group.2That would appear to support
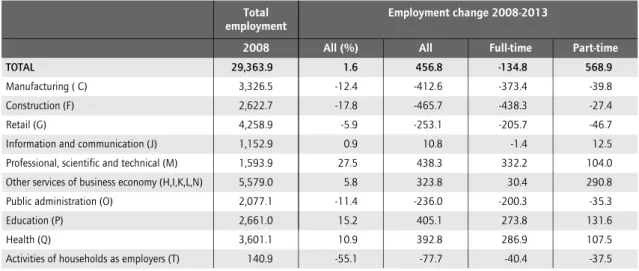
the view that labour market flexibility aids adjustment after economic crisis. The point could be made in a more negative way, with the expectation that high-quality jobs were replaced by casual and/or precarious work at lower pay, contributing to declining productivity, an aspect recorded in official statistics. There definitely are such precarious jobs and the data in Table 4 are consistent with their numbers increasing. Thus there was overall a decline in full-time jobs and an increase in part-time jobs and this was most marked in lower-paying service activities. However, the data also indicate other changes taking place, much of which amount to continuation of past trends towards an economy based on high skill and qualification levels. Two transformations appear to be taking place at the same time. This can be seen from following individual sectors.
The change in manufacturing employment was actually less than in the previous five-year period and broadly similar to that of other EU member states, with a few exceptions. The fall in construction, following the financial crisis, was also predictable and not as dramatic as in some other countries referred to below. The sources of higher employment in 2013 are health, education, professional services and administrative support services. Thus a significant part of this appears to have been public sector employment and a continued transformation towards an economy requiring highly-qualified labour, albeit with quite marked increases in part-time employment in those sectors too.
2. The workforce actually increased by more than is indicated in Table 1 owing to a significant increase in employment, both full-time and part-time, for those aged over 65 which coincided with the legal prohibition of age discrimination. These employees are included in the data in Table 4.
Relating these changes in employment to changes in earnings indicates again the important role of the changes in the public sector. While employment has increased in traditional public-sector activities, despite stated aims of reducing the public sector, pay levels there have shown the most substantial falls. The decline in real pay between 2008 and 2013 was most pronounced in education (13.5%), other services (17.4%), professional scientific and technical services (9.3%), construction (10.4%) and administrative and support service activities (10.9%) (Eurostat see table in Appendix). The last of these is relatively poorly paid, including call centres and security services in which there could be a good representation for forms of precarious employment. In general, real earnings declined in almost all sectors, the only exceptions being a few branches of manufacturing industry. A complete picture would require a more detailed breakdown of pay within sectors.
Thus, for the UK, the striking feature was stability of the total employment level with recovery in working hours as well as total numbers in employment from a post-crisis low point. The explanation of employment recovery in terms of lower earnings is neither refuted nor fully supported. However, it appears unconvincing when much of the employment increase is in relatively well-paid sectors and pay reductions in others do not obviously contribute to any employment expansion.
Table 4 Changes in employment (in ‘000s), by working time and selected sectors, age 15+, UK
TOTAL
Manufacturing ( C) Construction (F) Retail (G)
Information and communication (J) Professional, scientific and technical (M) Other services of business economy (H,I,K,L,N) Public administration (O)
Education (P) Health (Q)
Activities of households as employers (T)
Note: “Other services of business economy” include: Transportation and storage; Accommodation and food service activities; Financial and insurance activities; Real estate activities and Administrative and support service activities. Source: Eurostat (lfsa_epgan2), own calculations.
2008 29,363.9 3,326.5 2,622.7 4,258.9 1,152.9 1,593.9 5,579.0 2,077.1 2,661.0 3,601.1 140.9 Total employment All (%) 1.6 -12.4 -17.8 -5.9 0.9 27.5 5.8 -11.4 15.2 10.9 -55.1 All 456.8 -412.6 -465.7 -253.1 10.8 438.3 323.8 -236.0 405.1 392.8 -77.7 Employment change 2008-2013 Full-time -134.8 -373.4 -438.3 -205.7 -1.4 332.2 30.4 -200.3 273.8 286.9 -40.4 Part-time 568.9 -39.8 -27.4 -46.7 12.5 104.0 290.8 -35.3 131.6 107.5 -37.5
Ireland – parallel growth of jobs and wages
The figures for Ireland in Table 1 are consistent with the country experiencing outward migration without which the level of unemployment could be expected to have been higher. Structural change in employment is shown in Table 5. More than half of the fall after 2008 is explained by the fall in construction, down to a level that appears to have stabilised after 2012. That was a bigger drop than in the UK, but the explanation is simply the extent of the previous credit-financed construction boom. A comparison with the UK also suggests more rapid decline in manufacturing, a remarkably similar tendency for growth in health and, to a lesser extent, education and significant expansion in information and communication services.
Average real earnings over the same period fell slightly (by 0.2%, see Appendix). Tax changes would also need to be taken into account to see whether those who remained in employment, on average, did better than their counterparts in the UK. However, as wage reductions mainly concerned workers in public administration and health, the implication is that average labour costs to private employers were not reduced (the increase in average real wages across the private sector was 1.9%, see Appendix).
The data show no obvious sign of a positive impact from ‘internal devaluation’ or of a role for labour market institutions in explaining employment changes. The relationship between earnings and employment can be pursued around four points. The first is the decline in construction employment which was accompanied by a substantial pay reduction. The former was, as indicated, inevitable, and the latter need not have made any significant difference. Nor is there any sign of expanding employment that would be likely to be appropriate
Table 5 Changes in employment (in ‘000s), by working time and selected sectors, age 15+, Ireland
TOTAL
Manufacturing ( C) Construction (F) Retail (G)
Information and communication (J) Professional, scientific and technical (M) Other services of business economy (H,I,K,L,N) Public administration (O)
Education (P) Health (Q)
Activities of households as employers (T)
Note: For detailed service sectors, see Table 4. Source: Eurostat (lfsa_epgan2), own calculations. 2008 2,101.2 251.5 237.7 304.8 70.9 112.4 401.5 104.3 143.8 221.3 9.7 Total employment All (%) -10.5 -15.2 -57.1 -10.7 13.7 -2.5 -5.4 -8.5 1.8 11.3 -27.8 All -220.0 -38.3 -135.7 -32.5 9.7 -2.8 -21.6 -8.9 2.6 25.0 -2.7 Employment change 2008-2013 Full-time -283.8 -41.5 -144.3 -40.4 9.3 -7.3 -37.2 -6.3 -2.0 15.7 -1.7 Part-time 63.7 3.1 8.6 7.8 0.4 4.5 15.7 -2.6 4.6 9.3 -1.0
for unemployed construction workers. Developing sectors would all seem likely to require quite different kinds of skills.
The second is the fall in industrial employment. Ireland was a relatively high-wage country so that the movement of employment in mass production to lower-wage countries was a natural continuation of an existing trend. Wage reductions would have needed to be enormous to stem this and that is neither realistic nor necessary for an economy developing higher-skilled activities. The third is the increase in employment in largely public services which reflect pay reductions at best indirectly. Limitations to the state budget could be said to leave a choice between employment or pay reductions and the choice taken was the latter. The fourth point is the proportionate growth of new employment in export-oriented activities, albeit not to a very great extent. The big success story relative to other countries has been information and communication services, increasing from 5.7% of GDP in 2008 to 7.7% in 2013, with a strong export orientation. Earnings rose by 6.8% in real terms (see Appendix) and from 28%
to 39% above the average3. Evidently, relative success for this sector depended
not on low pay but rather on high enough pay to attract qualified employees. Thus there is even less evidence than in the UK of growth in employment that might be linked to low wages. There is evidence of lower pay across much of the economy and, in Ireland, evidence of expansion in a high-earning export-oriented sector that is happening independently of labour-market developments.
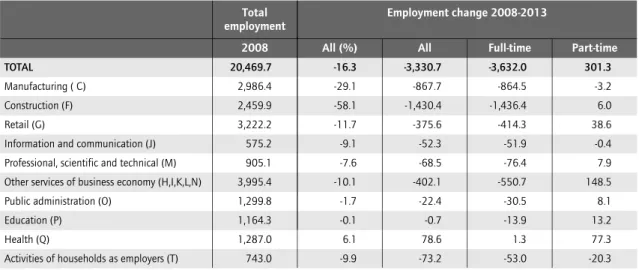
Spain – no replacement for construction?
As indicated in Table 6, Spain experienced a drop in total employment with the biggest fall in construction, followed by manufacturing. Hardly anything increased, the only significant exception being a little growth in private sector services and health that was due to part-time employees. Unlike the UK, or even to a small extent Ireland, no increase is recorded in the data used here from a well-paid, high-skill sector. Those seeking well-paid employment maybe had to emigrate.
Following pay level changes in sectors (which can be done at quite a detailed
level) shows no clear trend4. Real pay fell by 1% from 2008 to 2012, with some
variation between sectors. As in other countries, health and education both fell (4.7% and 3.0%) but, unlike Ireland, pay in the construction sector was roughly stable. Motor vehicle manufacture, an export-oriented sector, increased by 1.9%. There were big falls for pharmaceuticals (5.9%) and, remarkably, for Research and Development (10.4%). Thus in Spain the falling level of employ -ment across almost all sectors suggests that no low-wage sectors grew, taking advantage of low wages, and similarly high-wage sectors seemed to be failing.
3. Information on earnings are taken from Ireland’s Central Statistical Office, http://www.cso.ie/en/statistics/earnings/.
We can only speculate as to causes behind these developments. The decline in construction clearly reflects its previous dependence on credit. The poor showing for public sector activities is not surprising in view of austerity policies. The declines in employment in retail and other service sectors meant that there was little expanding employment for those leaving construction and manufacturing, should their skill profiles have found any match. Explanations are likely to include the demand-depressing effects of public spending reductions and the continued poor access to credit for the smaller businesses that dominate these parts of the Spanish economy (cf ECB 2013). Most remarkable of all is the failure of activities associated with transformation towards a more skill- and qualification-based economy. Public spending and credit availability may be important here too. Another factor could be the difficulty of retaining an adequately qualified labour force when higher pay, more security and altogether better working conditions are available in other EU member states.
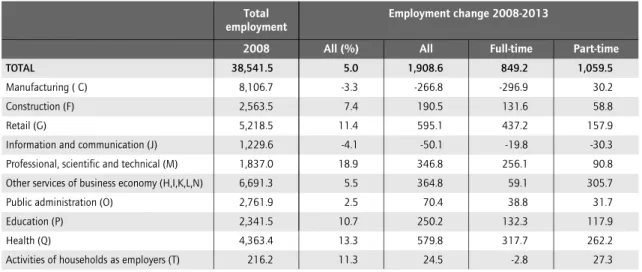
Germany – apparent stability
The striking distinguishing feature for Germany has been the increase in total employment alongside the small degree of structural change. Table 7 shows the changes between 2008 and 2013. Employment fell remarkably little in manufacturing, when set against long-term trends in advanced countries in general, and increased in construction. In this Germany differed from countries that had previously experienced construction booms based on credit.
Table 6 Changes in employment (in ‘000s), by working time and selected sectors, age 15+, Spain
TOTAL
Manufacturing ( C) Construction (F) Retail (G)
Information and communication (J) Professional, scientific and technical (M) Other services of business economy (H,I,K,L,N) Public administration (O)
Education (P) Health (Q)
Activities of households as employers (T)
Note: For detailed service sectors, see Table 4. Source: Eurostat (lfsa_epgan2), own calculations. 2008 20,469.7 2,986.4 2,459.9 3,222.2 575.2 905.1 3,995.4 1,299.8 1,164.3 1,287.0 743.0 Total employment All (%) -16.3 -29.1 -58.1 -11.7 -9.1 -7.6 -10.1 -1.7 -0.1 6.1 -9.9 All -3,330.7 -867.7 -1,430.4 -375.6 -52.3 -68.5 -402.1 -22.4 -0.7 78.6 -73.2 Employment change 2008-2013 Full-time -3,632.0 -864.5 -1,436.4 -414.3 -51.9 -76.4 -550.7 -30.5 -13.9 1.3 -53.0 Part-time 301.3 -3.2 6.0 38.6 -0.4 7.9 148.5 8.1 13.2 77.3 -20.3
Setting structural changes in the German economy in a comparative context points to three general conclusions;
1. There are striking similarities to the UK and Ireland in the growth in public services and in some highly-qualified activities. The difference is that the extent of growth was greater in Germany. There is also a similar trend towards more part-time employment in those sectors, although with substantial apparent variation between them.
2. The fall in employment in manufacturing was the smallest. This was associated with a relatively low pay level increase but, if pay is to be seen as the key factor, a worse performance than in the UK could have been expected. The opposite was the case. The explanation would appear to be that, as in other cases, higher pay comes with expansion and higher sales, with exports particularly important to German manufacturing. Other features may be important here, including specific policy measures in Germany to retain manufacturing employment through the crisis period, but the longer-term factor was the competitive level and structural composition of German manufacturing industry. As with high-quality exports from Ireland, its success was based on quality rather than low pay levels (cf Duval 2013).
3. There is no clear evidence from these figures that greater precarity or casualization contributed much to maintaining employment levels, but it cannot be ruled out in all cases. Germany experienced both an increase in total employment and an increase in total working hours, albeit with a gap indicating the contribution of a growing share of part-time work and effects of
working time reductions (Herzog-Stein et al2013). This could be associated
with movement towards a more casualised labour force (cf Holst and Dörre 2013).
Table 7 Changes in employment (in ‘000s), by working time and selected sectors, age 15+, Germany
TOTAL
Manufacturing ( C) Construction (F) Retail (G)
Information and communication (J) Professional, scientific and technical (M) Other services of business economy (H,I,K,L,N) Public administration (O)
Education (P) Health (Q)
Activities of households as employers (T)
Note: For detailed service sectors, see Table 4. Source: Eurostat (lfsa_epgan2), own calculations. 2008 38,541.5 8,106.7 2,563.5 5,218.5 1,229.6 1,837.0 6,691.3 2,761.9 2,341.5 4,363.4 216.2 Total employment All (%) 5.0 -3.3 7.4 11.4 -4.1 18.9 5.5 2.5 10.7 13.3 11.3 All 1,908.6 -266.8 190.5 595.1 -50.1 346.8 364.8 70.4 250.2 579.8 24.5 Employment change 2008-2013 Full-time 849.2 -296.9 131.6 437.2 -19.8 256.1 59.1 38.8 132.3 317.7 -2.8 Part-time 1,059.5 30.2 58.8 157.9 -30.3 90.8 305.7 31.7 117.9 262.2 27.3
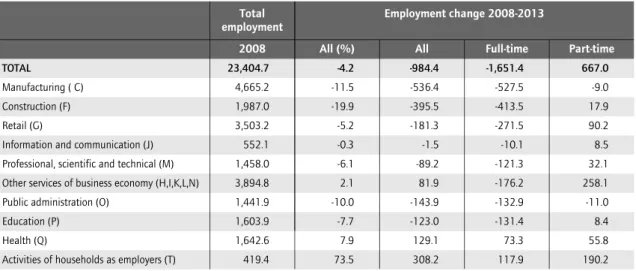
Italy – job growth on shaky foundations
In Italy, as shown in Table 8, the number in employment fell by 4.2% between 2008 and 2013, with full-time falling and part-time increasing. Moreover, actual weekly hours worked declined for both full-time and part-time workers so that the decline in employment in Italy in total hours worked amounts to 8% (Table 1). The biggest losses were in manufacturing, followed by construction and retail. Manufacturing had been a declining sector in Italy throughout the 1990s. After 2008 this accelerated. Construction saw increasing employment up to 2008 and then lost nearly all the jobs that had been added after 1998. Notable also is a decline in services after 2008 and, as in other countries, greater reliance there on part-time employees.
Although there are substantial similarities in changes in the employment structure in Italy with other EU countries, three developments stand out. First is a net contraction of public services, including health, education and public administration. Health did see some expansion, but there were big falls in education and public administration. The second development that contrasts with Germany, yet is similar to Spain, is the stalling of the shift towards highly qualified professionals, exemplified by the decline, and move towards more part-timers, in professional, scientific and technical activities. The third, and a feature almost unique to Italy among the countries considered here, is the growth in the category classified as households as employers. This includes employment of paid domestic staff directly by households, or production for own consumption where no formal transaction needs to take place. These new jobs were filled mainly by women, working part-time hours. Part of this could be explained by care services, compensating for the inadequacy, and cuts to, established social services (for an analysis of the impact of the crisis on
healthcare sector in Italy cf de Belvis et al. 2012).
Table 8 Changes in employment (in ‘000s), by working time and selected sectors, age 15+, Italy
TOTAL
Manufacturing ( C) Construction (F) Retail (G)
Information and communication (J) Professional, scientific and technical (M) Other services of business economy (H,I,K,L,N) Public administration (O)
Education (P) Health (Q)
Activities of households as employers (T)
Note: For detailed service sectors, see Table 4. Source: Eurostat (lfsa_epgan2), own calculations. 2008 23,404.7 4,665.2 1,987.0 3,503.2 552.1 1,458.0 3,894.8 1,441.9 1,603.9 1,642.6 419.4 Total employment All (%) -4.2 -11.5 -19.9 -5.2 -0.3 -6.1 2.1 -10.0 -7.7 7.9 73.5 All -984.4 -536.4 -395.5 -181.3 -1.5 -89.2 81.9 -143.9 -123.0 129.1 308.2 Employment change 2008-2013 Full-time -1,651.4 -527.5 -413.5 -271.5 -10.1 -121.3 -176.2 -132.9 -131.4 73.3 117.9 Part-time 667.0 -9.0 17.9 90.2 8.5 32.1 258.1 -11.0 8.4 55.8 190.2
With respect to wages, there has been a relatively steady growth in gross earnings during the past decade across the economy, but real wages across most sectors stagnated after 2008 and from 2010 began to decline (Eurostat lc_lci_r2_a; prc_hicp_aind). Wage moderation has been most pronounced in the service sector, which can be in part explained in terms of the changing employment structure. Overall, better paid positions have been cut while the lower paid segment of the labour force expanded. For instance, in retail between 2008 and 2013 the number of managers declined nearly fivefold (from 783,000 to 170,000), while the number of service and sales workers doubled (form 799,000 to 1.6 million). However, no apparent effect of decreasing labour costs on employment levels can be observed. The real wage decline is particularly visible after 2010 in professional, scientific and technical activities. Despite the decline by 8.3%, there was no job creation and employment in this sector has been steadily shrinking since 2008. In parallel to real wage cuts across the public sector after 2010, employment in public administration also begun to decline, while the long term growth in health sector stalled after 2012. On the other hand, in manufacturing real wages increased until 2009 and then stagnated, while in construction there has been a steady growth in real earnings. Perhaps surprisingly, although Italy and the UK showed very different wage developments in these sectors, the employment outcomes have been remarkably similar. Between 2008 and 2013, employment in manufacturing declined by 12% in Italy and 14% in the UK, while in construction by 20% and 19% respectively. Therefore, wage restraint pursued in the UK did not translate into obvious differences in employment outcomes.
Latvia – the flight of the unemployed
As indicated in Table 1, Latvia experienced one of the biggest net falls in employment and in hours worked, but an apparently unexceptional increase in unemployment. Thanks in part to this latter figure, Latvia has been
Table 9 Changes in employment (in ‘000s), by working time and selected sectors, age 15+, Latvia
TOTAL
Manufacturing ( C) Construction (F) Retail (G)
Information and communication (J) Professional, scientific and technical (M) Other services of business economy (H,I,K,L,N) Public administration (O)
Education (P) Health (Q)
Activities of households as employers (T)
Note: For detailed service sectors, see Table 4. Source: Eurostat (lfsa_epgan2), own calculations. 2008 1,054.9 156.4 124.1 168.6 24.3 26.3 173.2 83.9 86.8 48.2 3.8 Total employment All (%) -15.3 -19.6 -45.8 -20.9 0.0 30.8 -0.6 -26.9 9.0 -1.0 : All -161.0 -30.7 -56.8 -35.2 0.0 8.1 -1.1 -22.6 7.8 -0.5 : Employment change 2008-2013 Full-time -164.6 -30.6 -56.4 -38.8 0.7 4.8 -3.1 -21.0 6.1 0.2 : Part-time 2.0 0.0 -0.7 3.4 : 3.2 3.1 -1.5 1.6 -0.7 :
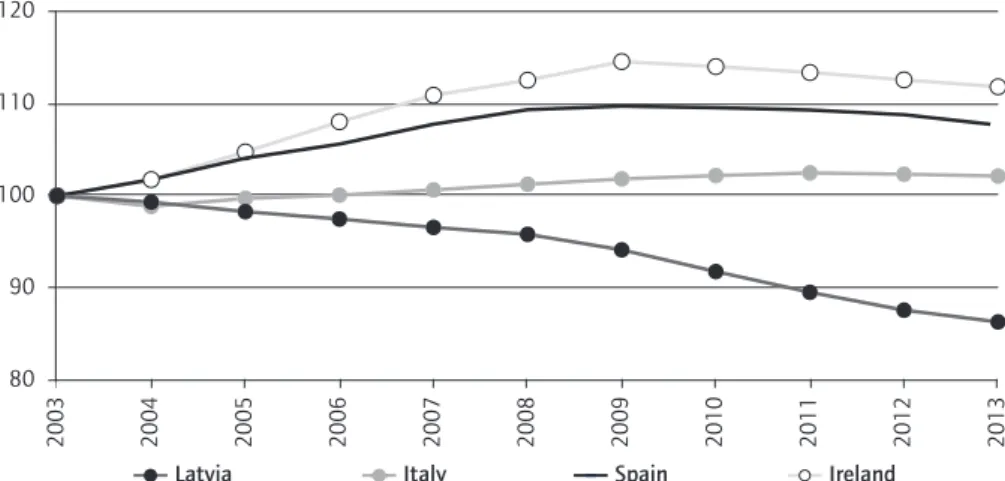
presented as a success story where austerity and internal devaluation produced the expected positive results while exchange rates remained fixed against the euro over the period after the crisis (Åslund and Dombrovskis 2011; IMF 2011). Indeed, employment rates that dropped after 2008 then increased considerably from 2010 and the unemployment rate fell sharply from 2010. However, comparisons of unemployment rates after 2008 in Latvia are highly problematic. Between 2008 and 2010, job destruction among the working age population (15-64) amounted to 180,000, while between 2010 and 2013 employment creation amounted to merely 38,000 jobs. More than in any other country, labour migration needs to be taken into account before discussing further changes in the employment structure. Figure 5 shows the comparative positions for changes in the working-age populations including other countries that experienced severe difficulties after the crisis. Latvia stands out among them.
There has been a steady outflow of working age population (15-64) from Latvia for many years, but it accelerated considerably after 2008. The Central Statistical Bureau of Latvia shows a decline by just over 4% over the period 2003-2008 and then of nearly 10% during five years after 2008. Taking this outflow into account, adjusting for mortality and assuming an unchanged number of jobs, in 2013 unemployment levels for all age groups would have been substantially higher than they were in 2010 (Table 10). Once that is taken into account, the behaviour of the Latvian labour market appears broadly explicable from comparisons with those of Italy and Spain, other countries hit hard by the crisis.
Focusing on the changes in employment, shown in Table 9 and Figure 6, trends appear reasonably similar to those in other countries hit hard by the crisis. Construction was the third largest sector in 2008 in Latvia, accounting for
Latvia Italy Spain Ireland
80 90 100 110 120 2 0 0 3 2 0 0 4 2 0 0 5 2 0 0 6 2 0 0 7 2 0 0 8 2 0 0 9 2 0 1 0 2 0 1 1 2 0 1 2 2 0 1 3
Figure 5 Population change (age 15-64), 2003=100
11.8% of jobs, a massive expansion in comparison to 6% of workforce employed in construction in 2000. In comparison to other EU countries, the construction bubble in Latvia was by far the biggest and 39% of the overall jobs lost between 2008 and 2013 were in the construction sector. Apart from construction, substantial numbers of jobs were lost in public administration, manufacturing and retail. In contrast to other countries hit by the crisis, education saw a
Table 10 Employed, unemployed and inactive as % of age group. Latvia
From 15 to 24 years From 25 to 49 years From 50 to 64 years Employed Unemployed Inactive Employed Unemployed Inactive Employed Unemployed Inactive Change in cohort size, 2008-2013 (1) -8.6 (-23,010) -9.6 (-74,066) -4.2 (-17,941) Prognosis without emigration, 2013 (2) 27.5 17.2 55.2 71.1 18.3 10.6 59.4 11.8 28.8
(1)Presumed size of emigration. Change in the size of each age cohort between 2008 and 2013, adjusted for mortality over this period. E.g. a size of
the age group 15-24 in 2013 is compared with the number of 10-19 year olds in 2008, minus deaths registered over the 5-year period.
(2)A situation predicted had there been no emigration in each cohort between 2008 and 2013. Based on the assumption that the number of jobs does
not change and all that emigrated are counted as unemployed. This assumption would be difficult to sustain in a good economic climate, but is fairly realistic in a depressed economy.
Source: Eurostat, own calculations.
2008 37.0 5.9 57.2 82.6 6.6 10.8 66.9 4.7 28.4 2010 25.4 14.4 60.3 73.3 16.0 10.7 56.1 11.6 32.3 2013 30.2 9.1 60.6 78.8 9.5 11.7 62.0 7.9 30.1 0 50 100 150 200 250 2 0 0 0 2 0 0 1 2 0 0 2 2 0 0 3 2 0 0 4 2 0 0 5 2 0 0 6 2 0 0 7 2 0 0 8 2 0 0 9 2 0 1 0 2 0 1 1 2 0 1 2 2 0 1 3
Agriculture Manufacturing Construction Retail Education Health
Figure 6 Changes in employment across selected broad sectors of economic activity, 2000=100, Latvia
Source: Central Statistical Bureau of Latvia. Classifications used for sectors of economic activity have a discontinuity between 2007 (NACE Rev 1.1) and 2008 (NACE Rev 2), but sizes of the broad categories used in the figure are largely consistent across the two classifications.).
significant increase, as did the professional, scientific and technical category, possibly holding out hopes for movement towards a more qualification-based economy. Somewhat surprisingly, there is less sign here than in any other country of a move towards more part-time employment.
The collapse of employment in construction was concentrated in a short period between 2008 and 2010, in parallel to real wages decline. After 2010 the trend reversed and a number of jobs increased alongside increases in real earnings. A very similar pattern emerges in the manufacturing, a sector that contributed
to an improving export performance (cf Blanchard, et al. 2013), as after initial
decline there are some signs of growth in both wages and jobs5. Developments
in the public sector do not follow any consistent pattern and similar wage cuts coincide with divergent employment outcomes. Overall, real wages in public administration, education and health sectors declined sharply (15-25%) between 2008 and 2010, and despite subsequent increases remain well below 2008 levels. Finally, resumed job growth in retail appears two years after real wages began to increase, while wages in the expanding professional and scientific activities continue to fluctuate.
5. For instance, manufacture of wood contributed the most to the job growth in manufacturing after 2010, while export of wood represented 20% of total exports from Latvia in 2010 (Source: World Bank, World Integrated Trade Solutions, http://wits.worldbank.org).
Conclusions
Comparisons between a small number of EU member states using data easily available from Eurostat and national statistical offices do not give strong support to arguments for so-called internal devaluation. Reducing wage levels was not clearly associated with increasing employment. This is not consistent with a view of a perfectly homogeneous labour market able to ensure automatic adjustment as the economic structure changes. It is in line with studies of changes in economic structures which require active intervention and support for desirable structural transformations to ensure high levels of employment. There are cases where higher employment has been associated with lower earnings, but much of this appears to be taking place in public sectors. Signs of lower pay encouraging private sector employers to take on more employees are scarce. There is evidence of a possible trend towards greater casualiza tion, indicated indirectly by a trend towards more part-time employment, but these are not the most striking areas of new employment expansion. There is also evidence that rising employment in particular activities is associated with rising earnings. This is not consistent with a view that low wages and downward flexibility in pay levels are the key to rising employment. It is consistent with the view that higher employment comes with higher qualification and skill levels, with transformation towards a more knowledge-intensive economy and with competing internationally with higher-quality products and services. A paradox is that this kind of transformation is least visible in the countries where policies to reduce earnings levels have been pursued with the most determination. Indeed, in a European and world context of ever freer movement of people, holding down earnings may work against such a transformation which depends on there being high enough pay levels and enough security and stability of employment to keep and motivate an adequate labour force. However, confirming this and other conclusions will depend on further research. The direction chosen here, looking at detailed changes and the breakdown within individual sectors, appears justified. This reveals more than staying only with macro-level variables. It now should be taken further, to explore pay and employment changes within the sectors, the effects of changes in policies within countries, for example relating to retirement, and the implications of the trends towards more part-time work. The evidence presented in this paper does not support the view that employment can be increased by focusing on labour market and pay-level flexibility. Further, and more detailed, research could help show more clearly where, how and why employment in some activities can be increased.
A u s tr ia B e lg iu m B u lg a ri a C ro a ti a C y p ru s C z e c h R e p . D e n m a rk E s to n ia F in la n d F ra n c e G e rm a n y G re e c e H u n g a ry Ir e la n d It a ly L a tv ia L it h u a n ia L u x e m b o u rg M a lt a N e th e rl a n d s P o la n d P o rt u g a l R o m a n ia S lo v a k ia S lo v e n ia S p a in S w e d e n U K T o ta l (1 ) (B -S ) : 1 0 4 .8 1 3 0 .5 9 0 .1 9 1 .6 1 0 6 .6 1 0 2 .3 9 8 .0 1 0 3 .9 1 0 2 .7 1 0 4 .0 7 5 .4 9 5 .1 9 9 .8 1 0 0 .0 9 7 .2 8 9 .6 1 0 4 .3 1 0 4 .5 9 9 .0 1 0 4 .2 8 7 .7 1 0 3 .4 1 0 2 .8 9 7 .0 9 7 .5 1 0 6 .4 9 1 .4 P ri va te se ct o r (B -N ) 1 0 5 .3 1 0 5 .3 1 3 3 .1 8 8 .7 9 3 .4 1 0 6 .8 1 0 2 .4 9 9 .5 1 0 3 .4 1 0 3 .2 1 0 3 .8 8 0 .7 1 0 0 .9 1 0 1 .9 1 0 3 .8 1 0 1 .8 8 8 .8 1 0 4 .8 1 0 2 .4 9 8 .9 1 0 3 .6 9 2 .1 1 0 9 .6 1 0 1 .4 9 9 .2 1 0 0 .3 1 0 6 .4 9 1 .9 M a n u fa ct u ri n g (C ) 1 0 2 .0 1 0 5 .7 1 2 5 .1 9 4 .5 9 2 .6 1 0 9 .1 1 0 1 .9 1 0 4 .2 1 0 2 .3 1 0 4 .9 1 0 3 .6 8 1 .5 1 0 4 .5 1 0 6 .5 1 0 5 .8 1 0 5 .6 9 3 .2 9 9 .7 9 9 .5 1 0 0 .4 1 0 4 .8 9 2 .3 1 1 6 .5 1 0 9 .0 1 0 6 .9 1 0 2 .4 1 0 8 .5 9 4 .0 C o n st ru ct io n (F ) 1 0 0 .5 1 0 7 .0 1 2 6 .9 9 3 .6 9 2 .5 1 0 3 .6 9 7 .0 9 4 .2 1 0 5 .2 1 0 2 .7 1 0 0 .9 7 4 .4 9 9 .2 9 7 .1 1 1 0 .2 9 9 .2 7 3 .9 1 0 3 .8 1 0 2 .1 9 9 .4 9 6 .7 9 8 .0 1 0 0 .4 1 0 3 .4 9 3 .9 1 0 3 .4 1 0 5 .3 8 9 .6 R e ta il (G ) 1 0 6 .1 1 0 6 .9 1 4 8 .5 6 0 .0 9 1 .1 1 0 5 .8 1 0 0 .2 9 6 .4 9 9 .3 1 0 2 .1 1 0 4 .7 9 3 .9 1 0 0 .8 1 0 4 .5 1 0 4 .2 1 0 3 .8 8 8 .5 1 0 6 .4 1 0 1 .3 9 8 .1 9 9 .9 9 5 .2 1 1 1 .9 9 3 .4 9 8 .4 1 0 0 .9 1 0 5 .3 9 5 .5 In fo rm a ti o n a n d c o m m . (J ) 1 1 0 .7 1 0 3 .9 1 5 0 .9 1 0 0 .8 9 6 .7 1 0 5 .7 1 0 7 .5 1 0 7 .9 1 0 5 .8 1 0 3 .0 1 0 7 .8 8 0 .3 9 5 .8 1 0 6 .8 1 0 1 .5 9 5 .6 1 0 7 .9 1 0 4 .8 1 2 0 .0 9 6 .4 1 0 2 .1 8 7 .3 1 0 9 .3 9 4 .8 9 0 .9 9 8 .0 1 0 3 .1 9 0 .9 P ro fe ss io n a l, s ci e n ti fi c a n d t e ch n ic a l (M ) 1 0 7 .0 1 0 4 .8 1 4 7 .5 9 5 .3 9 9 .4 1 0 4 .7 1 0 3 .3 1 0 0 .0 1 2 0 .4 1 0 1 .1 1 0 3 .0 7 6 .0 9 3 .5 1 0 0 .9 9 6 .0 9 8 .3 8 9 .1 1 0 4 .0 1 1 2 .5 1 0 1 .1 1 0 6 .9 8 8 .1 1 1 0 .2 9 7 .7 9 3 .0 9 9 .0 1 0 4 .1 9 0 .7 A d m in . a n d s u p p o rt se rv ic e s (N ) 1 0 6 .2 1 0 4 .9 1 3 8 .6 8 8 .1 9 7 .1 1 1 0 .7 1 0 2 .8 1 0 0 .5 1 0 2 .3 1 0 8 .4 1 0 7 .9 7 9 .8 9 0 .9 1 0 1 .6 1 0 6 .8 9 7 .2 8 8 .0 1 0 8 .2 9 6 .0 9 6 .2 1 1 6 .2 9 3 .4 1 1 0 .5 1 0 2 .2 1 0 0 .1 9 6 .1 1 0 7 .3 8 9 .1 P u b li c a d m in . (O ) : 1 0 5 .7 1 1 0 .3 8 9 .9 8 8 .1 9 7 .0 1 0 2 .7 9 1 .6 1 0 5 .5 : 1 0 6 .1 6 9 .1 8 2 .2 9 4 .0 9 4 .2 8 5 .5 8 3 .0 1 0 3 .9 1 1 2 .6 9 6 .5 1 0 1 .0 8 7 .1 8 7 .2 1 0 3 .1 9 2 .3 9 1 .1 1 0 5 .1 9 1 .0 E d u ca ti o n (P ) : 1 0 4 .0 1 2 9 .7 1 0 0 .7 8 5 .7 1 0 8 .7 1 0 1 .0 9 5 .7 1 0 3 .3 : 1 0 2 .2 6 7 .1 8 8 .8 1 0 1 .1 9 4 .3 8 4 .1 1 0 2 .0 1 0 1 .1 1 1 3 .1 1 0 0 .1 1 1 2 .1 7 5 .4 8 2 .3 1 1 3 .3 8 9 .2 9 4 .4 1 0 5 .7 8 6 .5 H e a lt h (Q ) : 1 0 4 .3 1 2 9 .4 9 2 .2 8 9 .4 1 1 3 .5 1 0 3 .1 9 6 .0 1 0 4 .4 : 1 0 4 .3 5 7 .2 7 3 .0 9 4 .9 8 9 .8 8 9 .7 8 8 .5 9 9 .5 1 0 9 .6 1 0 0 .8 1 0 2 .0 8 2 .1 9 6 .4 1 1 3 .2 1 0 0 .6 8 9 .3 1 0 7 .2 9 2 .8 (1 )A ll s e c to rs e x c e p t a c ti v it ie s o f h o u s e h o ld s a s e m p lo y e rs a n d e x tr a -t e rr it o ri a l o rg a n is a ti o n s a n d b o d ie s . S o u rc e : E u ro s ta t (l c _ lc i_ r2 _ a ; p rc _ h ic p _ a in d ), o w n c a lc u la ti o n s . Re al w ag e d ev el op m en ts b et w ee n 20 08 a nd 2 01 3 ac ro ss th e E U , b y m ai n se ct or s o f e co no m ic a ct iv ity , 2 00 8= 10 0
A
p
p
e
n
d
ix
References
Åslund A. and Dombrovskis V. (2011) How Latvia came through the financial crisis, Washington, DC, Peterson Institute for International Economics.
Bailey D., Chapain C. and de Ruyter A. (2012) Employment outcomes and plant closure in a post-industrial city: an analysis of the labour market status of MG Rover workers three years on, Urban Studies, 49 (7), 1595-1612.
Bernal-Verdugo L.E., Furceri D. and Guillaume D. (2012) Labor market flexibility and unemployment: new empirical evidence of static and dynamic effects, IMF Working Paper WP/12/64, Washington, DC, International Monetary Fund.
Blanchard O., Griffiths M. and Gruss B. (2013) Boom, bust, recovery: forensics of the Latvia crisis, Paper presented at the Fall 2013 Brookings Panel on Economic Activity, Brookings, Washington, DC, 19-20 September 2013.
BusinessEurope (2014) Reform barometer 2014: Spring 2014,
http://www.businesseurope.eu/content/default.asp?PageID=568&DocID=32780. BusinessEurope (2007) Position paper on Commission communication ‘Towards common
principles of flexicurity’,
http://www.coess.org/_Uploads/dbsAttachedFiles/BusinessEurope_response_Com munication_Towards_common_principles_of_flexicurity.pdf .
Clauwaert S. and Schömann I. (2012) The crisis and national labour law reforms: a mapping exercise, Working Paper 2012.04, Brussels, ETUI.
de Belvis A. G. et al. (2012) The financial crisis in Italy: implications for the healthcare sector, Health Policy, 106 (1), 10-16.
Department of Employment (1978) Measures to alleviate unemployment in the medium term: early retirement, Department of the Employment Gazette , 86 (3), 283-285. Draghi M. (2013) Euro area economic situation and the foundations for growth,
Presentation by Mario Draghi, President of the ECB, to the Euro Summit, Brussels,14 March 2013,
http://www.ecb.europa.eu/press/key/date/2013/html/sp130315.en.html. Duval G. (2013) Made in Germany : le modèle allemand au-delà des mythes, Paris, Le Seuil. ECB (2012) Euro area labour markets and the crisis, Occasional Paper Series 138, October
2012, Frankfurt am Main, European Central Bank.
ECB (2013) Monthly Bulletin, July 2013, Frankfurt am Main, European Central Bank. ETUC (2013) A new path for Europe: ETUC plan for investment, sustainable growth and
quality jobs, Resolution adopted at the meeting of the ETUC Executive Committee, 7 November 2013, http://www.etuc.org/sites/www.etuc.org/files/EN-A-new-path-for-europe_3.pdf.
Herzog-Stein A., Lindner F. and Sturn S. (2013) Explaining the German employment miracle in the great recession: the crucial role of temporary working time reductions, IMK Working Paper 114, Düsseldorf, Macroeconomic Policy Institute.
Holst H. and Dörre K. (2013) Revival of the ‘German Model’? Destandardization and the new labour market regime, in Koch M. and Fritz M. (eds.) Non-standard employment in Europe: paradigms, prevalence and policy responses, Basingstoke, Palgrave Macmillan, 132-149.
IMF (2011) Republic of Latvia: fourth review under the stand-by arrangement and financing assurances review, request for rephasing of purchases under the arrangement and request for waiver of nonobservance of a performance criterion, Washington, DC, International Monetary Fund,
Lang C., Clauwaert S. and Schömann I. (2013) Working time reforms in times of crisis, Working Paper 2013.04, Brussels, ETUI.
Layard R., Nickell S. and Jackman R. (2005) Unemployment: macroeconomic performance and the labour market, Oxford, Oxford University Press.
Meardi G. and Trappmann V. (2013) Poland: employment relations and the crisis… of its neighbours, CELSI Discussion Paper 13, Bratislava, Central European Labour Studies Institute.
Summers L. (2008) Unemployment, in Henderson D. (ed.) Concise encyclopedia of economics, 2nd ed., Library of Economics and Liberty,
http://www.econlib.org/library/Enc/Unemployment.html.
Waddington D., Critcher C., Dicks B. and Parry D. (2001) Out of the ashes? The Social impact of industrial contraction and regeneration on Britain’s mining communities, London, The Stationary Office and Regional Studies Association.