EN ELLER TO FODERBLANDINGER TIL DIEGIVENDE SØER?
TRINE FRIIS PEDERSEN
MASTER THESIS · AGROBIOLOGY · FEBRUARY 2015
Main supervisor:
Peter Kappel Theil, Department of Animal Science, Aarhus University
Co-supervisor:
PREFACE
The current thesis is completed as the final part of the master degree in Agrobiology at Aarhus Uni-versity. The thesis corresponds to 45 ECTS and includes a practical experiment and a review of published literature. The experiment was carried out during spring 2014 at the facilities of Aarhus University, Faculty of Science and Technology, Foulum. The practical experiment and results are presented in a manuscript, intended to be submitted to the Journal of Animal Science. As the manu-script only presents some results and a discussion of these, a separate section was made to present additional results and discus the results in general.
This thesis aims to clarify perspectives for feeding lactating sows with a new dynamic feeding re-gime composed of two diets. The target audience of this master thesis are students, pig farmers, advisors and scientists within the field of pig nutrition with special interest in feeding of lactating sows.
I would like to express my gratitude to my supervisors Peter Kappel Theil, Senior Researcher at the Department of Animal Science, Faculty of Science and Technology, Aarhus University, and Thom-as Sønderby Bruun, Project Manager at SEGES, Danish Pig Research Centre. Peter Kappel Theil for support, critical view and comments on the thesis and Thomas Sønderby Bruun for his practical view and comments.
A special thanks to team Theil: Peter, Christine, Uffe and Takele from the Department of Animal Science, Aarhus University, for helping with collection of data during the practical experiments. Furthermore, I thank Takele for instructions concerning calculations of nutrient balances and my aunt for proofreading this thesis.
There has been a long tradition for feeding lactating sows ad libitum (semi ad libitum) with a single diet (1-diet feeding regime). Despite numerous attempts to feed sows ad libitum, sows still lose weight throughout lactation which can have long term effects on the reproduction. It might there-fore indicate that the feeding strategy does not provide sows the right amount of nutrients or the right ratio among nutrients. Sows’ requirement for nutrients has, however, never been greater due to a rapid increase in milk production during the last 20 years.
The objective of the present study was to investigate whether sows should be fed a combination of two diets instead of one diet throughout lactation in order to separately take energy and lysine (Lys) (and nitrogen (N)) requirements into account. The 1-diet feeding regime represented the Danish feeding standards and recommendations whereas the new 2-diet regime supplied sows feed accord-ing to their individual requirement. The 2-diet regime was composed of a basal diet, formulated to cover the energy requirement for maintenance and a lactation supplement formulated to cover the increasing requirement for milk production.
The study showed that feeding lactating sows with a 2-diet feeding regime increased milk yield and mean piglet weight. Sows’ feed intake could also be reduced by feeding sows with a well-balanced diet in the right amount. It was not possible to supply the 2-diet sows with enough energy to reach a zero energy balance, and sows lost weight throughout lactation.
This study has opened for the option to feed sows more dynamically with a 2-diet regime and be able to take into account sows’ changing requirement for Lys and N relative to energy. The theoret-ically required ratio of Lys to energy throughout the lactation was found to increase from 0.38 on day 2 to 0.57 on day 28 of lactation, which corresponds to 4.8 and 7.2 g SID Lys/kg (12.56 MJ/kg), respectively. It could therefore be recommended to increase the Danish requirements for Lys from the present recommendation of 6.6 g SID Lys/Fe for sows fed a single lactation diet. Furthermore, sows fed the 2-diet feeding regime were over supplied with N, which was also supported by the increase in plasma urea concentration. Based on this it became evident that the requirement for non-essential amino acids does not follow the same increase in Lys requirement; it would therefore be beneficial to uncouple the dietary supply of Lys from N in diets for lactating sows.
TABLE OF CONTENTS
INTRODUCTION ... 1
Objectives and hypothesis ... 2
Abbreviation key ... 2
LITERATURE REVIEW ... 3
1 Practical feeding of lactating sows ... 3
1.1 Voluntary feed intake ... 4
1.1.1 Sow factors ... 5
1.1.2 Environmental factors ... 6
1.1.3 Diet factors and water supply... 7
2 Milk yield ... 8
2.1 Piglet characteristics influence on milk production ... 9
2.2 Sow characteristics influence on milk production ... 10
2.3 Environment characteristics influence on milk production ... 11
2.4 Diet characteristics influence on milk production and “push pull effects” ... 12
2.5 Inadequacies of sows’ milk production ... 14
2.6 Estimation of sows’ MY... 15
3 Nutrient requirement of the lactating sow ... 16
3.1 Energy requirement ... 17
3.2 Lysine requirement ... 18
3.3 Nitrogen requirement ... 18
4 Nutrient balances during lactation ... 19
4.1 Relation between plasma parameters and nutrient balances during lactation ... 22
5 Long term consequences of suboptimal feeding ... 23
6 Final remarks and conclusion of literature review ... 25
MANUSCRIPT TO BE SUBMITTED... 26
ADDITIONAL RESULTS AND GENERAL DISCUSSION ... 54
Accuracy of sows’ MY... 54
Nutrient balances and mobilization of body protein and fat ... 60
Intermediary metabolism of lactate, TAG and urea ... 63
CONCLUSION ... 65
PERSPECTIVES AND IMPLEMENTATION ... 66
INTRODUCTION
Productivity of lactating sows has improved significantly during the past decades and high pro-lific sows today give birth to on average 15.4 live born piglets per litter (Vinther, 2014). On av-erage sows raise 2.26 litter per year (Vinther, 2014) and can produce as much as 1 to 1.5 times their own body weight (BW) in milk in each lactation (Hansen et al., 2012b). Furthermore, mod-ern sows today produce double the amount of milk that sows produced 20 years ago. Breeding programs have also aimed to select for leaner pigs with lower body fat depots, which has unin-tendedly resulted in leaner sows with a lower voluntary feed intake (VFI) (Smith et al., 1991; Bergsma et al., 2009).
The lactation period of sows is an important phase of the reproductive cycle, due to the high re-quirement for nutrients to support milk synthesis, and because a high milk intake is crucial for survival and performance of piglets. The onset of lactation makes a very sudden and large meta-bolic demand and sows’ feed intake is normally insufficient to overcome the requirement. Sows are therefore often in negative energy balance during lactation due to mobilization of body re-serves to maintain milk production. To meet the high demand for milk production, the sow will start mobilizing body reserves, and it is common for sows to lose 20-30 kg during lactation (Theil et al., 2012; Christensen and Sørensen, 2013). It has previously been speculated that sows must mobilize nutrients from their own body to reach their potential for milk production. How-ever, more recent scientific evidence suggests that improved sow nutrition is able to both in-crease MY and greatly dein-crease sow mobilization (Flummer et al., 2014).
Milk production and VFI vary among sows. However today’s feeding system for lactating sows is not designed to cover the individual sow’s requirement including e.g. parity, litter size and body condition. A fixed energy and protein ratio in the lactation diet does not either match the shift in N, Lys and energy requirements which appears during the lactation period (Feyera, 2014b). Improper feeding of lactating sows can result in excessive weight loss, which is inap-propriate for the longevity of sows. Excessive tissue mobilization during lactation is undesirable because it can have long term effects on sow reproduction (Dourmad et al., 1994), sows’ wean-ing to estrous interval (WEI) will be extended (Zak et al., 1997). Furthermore, thin sows are more prone to developing shoulder lesions (Kaiser and Petersen, 2014). Extended weight loss is often compensated during the following gestation.
Objectives and hypothesis Objective of the study:
The objective of this master thesis was to investigate whether sows fed a combination of two diets perform better than sows fed a single diet throughout lactation.
The hypothesis of the study:
Uncoupling of the dietary supply of Lys and energy using a 2-diet feeding regime will improve MY and nutrient balances and reduce sows’ weight loss.
Abbreviation key Amino acid AA Back fat BF Body weight BW Crude protein CP Dry matter DM Lysine Lys Milk yield MY
Non-esterified fatty acid NEFA
Nitrogen N
Triglycerides TAG
Thermoneutral zone TNZ
Voluntary feed intake VFI
LITERATURE REVIEW
1
Practical feeding of lactating sows
Feed intake during lactation is important to ensure high performance of the sow and to avoid excessive weight loss. During lactation sows are fed to approach ad libitum feeding (semi ad libitum), where sows should have eaten up within a 30 min. range from feeding. This feeding strategy aims to ensure a high VFI to meet the elevated requirement for nutrients during lactation and furthermore to avoid feed waste. The Danish recommendation for feed allowance is to grad-ually increase the intake within the first and second weeks of lactation and hereafter reach a plat-eau (Hansen, 2012). Intake of feed and nutrients is illustrated in Figure 1. Sows receive approx-imately 3.3 kg of feed from parturition until day 3 of lactation. Feed intake around parturition is reduced compared to late gestation to avoid problems with e.g. MMA and birth complications (Dourmad et al., 1994; Danielsen, 2003). If feed allowance is too high in early lactation, sows will reach the peak in feed intake within a few days from parturition, which unfortunately trig-gers a major drop in feed intake (Sørensen, 2005). After day 3 and until day 10 sows’ feed sup-ply rapidly increases by about 0.5 kg per day and 0.2 kg from d 10-20. From lactation day 20 feed intake reaches a plateau of approximately 9 kg/day.
Feeding of Danish sows is in general limited to one lactation diet, fed from one week before par-turition until weaning, and consequently the protein and Lys to energy ratio is constant through-out the lactation period (Figure 1). Feed is normally distributed automatically 3-4 times a day as dry or liquid feed (Sønderby, 2013). The one diet system prevents the possibility to adjust the composition of diet according to the individual sow’s requirement. The feeding strength is thefore adapted from a standard feeding curve and does not take into account the differences in re-quirement for maintenance or milk production. In general there is only one or two feeding curves for all sows in the herd and the feed allowance is adjusted upwards if the sows have eaten up and licked the trough or downgraded in case of leftovers. Weight loss due to inadequacies in feed intake or allowance in the lactation period must therefore be reconstituted in the following gesta-tion period (Dourmad et al., 1996).
Figure 1 - Upper figure represents a standard feed intake curve for lactating sows expressed as kg/day (Danish Pig Research Centre). Lower figure represents intake of energy (- - -) in MJ/day, N (___) in SID g/day and Lys (….) in SID g/day based on typical contents (Theil, 2015).
1.1 Voluntary feed intake
The regulation of sows’ feed intake is controlled by a multifactorial system (Forbes, 1988). Recent reviews of Eissen et al. (2000) and Hansen (2012) showed that several factors can affect feed intake during lactation. These factors can be grouped into sow, environment and diet related factors and
0 1 2 3 4 5 6 7 8 9 10 1 3 5 7 9 11 13 15 17 19 21 23 25 27 Kg Day 00 20 40 60 80 100 120 140 00 20 40 60 80 100 120 140 160 180 1 3 5 7 9 11 13 15 17 19 21 23 25 27 MJ g S ID Day
1.1.1 Sow factors
Animal factors affecting feed intake during lactation are related to parity/age, BW and condition, length and stage of lactation, litter size and genetics (O'grady et al., 1985; Neil et al., 1996; Hansen, 2012).
The feed intake pattern varies individually for sows during lactation, but in general feed intake co-varies with milk production and stage of lactation (Koketsu et al., 1996a). After parturition the vol-untary feed intake (VFI) is low and starts to accelerate, and the sows will relatively quickly reach a high feed level within 3 days from parturition. After this rapid increase VFI drops and stays low for a few days before it slowly increases again and reaches the highest feed intake around day 11-16 of lactation (Sørensen, 2005). In contrast, milk production will reach a plateau around day 16-19 and feed will therefore not continue to be supplied in increasing amounts. The lower feed intake in early lactation has been reported to be correlated with size of gastrointestinal tract, which will adapt gradually to an increased feed intake (Dourmad, 1991). Increased feed intake induced by milk pro-duction corresponds to an additional feed intake of 45 g/day per 1 MJ milk output (Noblet and Etienne, 1989; Dourmad, 1991). This corresponds to an increase in feed intake of 225 g/day if MY is increased by 1 kg (1 kg milk with 5 MJ × 0.45 g/day).
The feed intake of sows with a greater litter size and milk production will increase due to a greater requirement. Noblet et al. (1998) demonstrated a relationship between feed intake and litter size. Feed intake was increased by 0.6 kg from 4.4 to 5.0 kg/day as litter size increased from 3 to 13 pig-lets. In contrast, O’Grady estimated an increase of 0.96 kg/day and indicated a limit for feed intake when litter size reached 14 piglets. The additional increase in VFI when litter size increases is, however, considered negligible compared with the increased requirement for nutrients to cover milk production (Noblet et al., 1998).
Feed intake has shown also to be dependent on sows’ parity (Noblet et al., 1998). Primiparous sows have a lower feed intake compared to multiparous sows. Koketsu et al. (1996a) calculated the rela-tionship between lactation feed intake and parity. From 1st to 9th parity feed intake increased by 0.81 kg/day, from 4.51 to 5.32 kg/day, respectively. Noblet et al. (1998) suggest the increase to be more appreciable from first to second parity, which is confirmed by Koketsu et al. (1996a) with an in-crease in feed intake of 55% from 1st to 2nd parity. The increased feed intake for higher parity sows is suggested by Eissen et al. (2000) to be due to an increased gastrointestinal capacity in older sows
with higher BW. Sow BW increases with parity and gastrointestinal capacity follows the BW and thereby affects the VFI.
Sows’ body condition at farrowing can affect VFI during lactation (Dourmad, 1991), which is in accordance with O'grady et al. (1985) who suspected that lactation feed intake seems to be more reliant on body condition than BW at farrowing. The reduced feed intake for fat sows is confirmed by (Revell et al., 1998a) who observed a 30% decrease in feed intake during lactation for sows with high body fat at farrowing. The mechanism of why fat sows respond by decreasing feed intake is not clear, but it is suspected to be related to a hormonal feedback system initiated in the adipose tissue. Woods et al. (1990) proposed the possibility that increased insulin concentration in plasma, due to adiposity, provides the signal for CNS to reduce feed intake. In contrast Revell et al. (1998a) proposed that fat sows might have fewer insulin receptors than lean sows and therefore the response would be lower. Explanations have also been suggested to be connected to insulin resistance and glucose intolerance (Eissen et al., 2000) or the increased leptin concentration in fat sows (Williams, 1998). High feed intake during gestation may cause insulin receptors to be insensitive or reduce the number of insulin receptors, which will inhibit the glucose response (Weldon et al., 1994). High feed intake before parturition may also cause a higher glucose intolerance by decreasing glucose receptors. Leptin is produced in the fat tissue and more fat may accumulate more leptin which will act on the CNS (Williams, 1998; Woods et al., 1998). Another reason for the lower feed intake of fat sows has been related to the capacity to secrete milk and the supply of endogenous substrates from body reserves (Revell et al., 1998a; Garst et al., 1999b). If the capacity to use stored energy for milk production is high, the feed intake will decline (Williams, 1998).
Lactating sows’ VFI is a heritable trait and can indirectly be changed by selection for production traits, which may also affect litter performance (Eissen et al., 2000; Bergsma and Hermesch, 2012). Selection for a high daily feed intake or daily gain will increase milk production by affecting VFI during lactation. Selection for increased VFI can be accomplished by direct selection or indirectly by selecting for factors related to daily gain or daily feed intake during the growth phase. Difference in feed intake may also be connected to different breeds, which mainly involves factors related to differences in BW and condition (Eissen et al., 2000).
1.1.2 Environmental factors
Environmental factors affecting sows’ feed intake during lactation are related to ambient tempera-ture, (O'grady et al., 1985; Hansen, 2012). Sows’ productivity is highly depressed with elevated
ambient temperature to above the thermoneutral zone (TNZ) (Black et al., 1993; Silva et al., 2009). The TNZ for lactating sows is between 12 and 22 °C. When the ambient temperature is above the TNZ, feed intake can be reduced by up to 40% and consequently milk production can be reduced by as much as 25% together with an additional inhibition of piglet growth (Black et al., 1993). When the temperature is above the TNZ, the sow will respond by decreasing feed intake to regulate body temperature. The sow maintains body temperature by heat production. To lower the heat production associated with digestion, absorption and utilization of nutrients sows will decrease their feed in-take. In the same context Black et al. (1993) suggested that a temperature above the TNZ increases blood flow to the skin at the expense of the udder, which may contribute to a decrease in milk pro-duction.
1.1.3 Diet factors and water supply
Feed intake can also be influenced by diet factors related to e.g. digestibility, composition, energy density, availability of water and feeding frequency (O'grady et al., 1985; Hansen, 2012).
Increasing energy density of the diet is one way to accomplish that sows’ feed intake meets the in-creasing demand for nutrients. Inin-creasing energy density will, however, decrease the feed intake (Noblet et al., 1998). Fiber content of the diet will also affect the digestibility of the diet and heat production of the sow. Diets containing high amounts of fiber could also limit the feed intake by changing the physical capacity of the gastrointestinal tract.
Increasing the feeding frequency has been studied, but with confounding results (Williams, 1998). Sørensen (2009) found no significant effect on feed intake when sows were fed 3 times a day com-pared with 5-8 times. The same author did, however, find an increased feed consumption when sows were fed ad libitum contra restricted (Sørensen, 2005) . Ad libitum feeding increased feed intake by 500 g/day and furthermore reduced sows’ weight loss by 7.4-9.1 kg. High feed intake (and hence fatter animals) during pregnancy has also been demonstrated to depress feed intake dur-ing the followdur-ing lactation (Mullan and Williams, 1989). This link seems to be associated with body reserves of fat and protein at the end of gestation as previously mentioned. Revell et al. (1998a) also demonstrated an increased feed intake of 0.8 kg/day in the 3rd and 4th week of lactation for sows fed high protein levels during lactation compared to sows fed the low protein diet.
Water supply during lactation is also important for maintaining feed intake. On average Kruse et al. (2011) found the average water intake of sows to be 27.5 kg/day during lactation and the
water-to-feed ratio was 4.9. Inclusion of fiber in the diet can also lead to increased water consumption, lead-ing to a lower feed intake.
2
Milk yield
Sows’ milk yield (MY) has increased significantly in the last 20-30 years (Noblet and Etienne, 1986; Feyera, 2014b) and today the best-performing sows produce 16.5 kg milk at peak lactation (day 17-21) (Hansen et al., 2012b). For a whole lactation period of 28 days sows produce around 350 kg of milk. The secretion of copious milk is initiated on the day after parturition (Theil et al., 2006) and starts to increase, especially during the first 10 days of lactation.
The increase in sows’ milk production after parturition is associated with an ongoing growth of the mammary gland and the MY is to a great extent determined by the number of mammary epithelial cells that produce and secrete milk (Theil et al., 2012). Mammary growth can be affected by lacta-tion stage, nutrilacta-tion, litter size and gland localacta-tion (Kim et al., 2000; Hurley, 2001; Nielsen et al., 2001).
Piglets’ nutrient requirement for survival and growth is solely covered by sows’ milk production during lactation until weaning. Piglets are also often offered creep feed, but the intake is rather low and will not contribute to meeting the requirement significantly. The availability and composition of milk are therefore the major factors contributing to litter weight gain. At the same time milk pro-duction is of high priority for the sow, and if feed intake is insufficient to meet the requirement for nutrient, the sow will start mobilizing body tissue to maintain milk production.
Sow milk is macrochemically composed of water, protein, fat, lactose, minerals and vitamins (Theil et al., 2012). The chemical composition of sow milk during a 28-day lactation period can be seen in Table 1. The greatest differences in composition occur in the transition period (until day 10 of lacta-tion). After d 10 the milk composition is rather constant (Theil, 2015).
Sows’ ability to produce milk at the expense of other body functions interacts with factors like litter size, parity and ambient temperature. The factors suspected to affect MY and composition will be described in the following.
Table 1- Development in milk composition during a 28-day lactation period (Klobasa et al., 1987).
Time after parturition [d]
Total solids [%] Fat [%] Protein [%] Lactose [%]
1* 17.3 5.6 6.4 4.6 2* 18.6 6.5 6.4 4.8 3* 19.0 6.7 6.1 5.2 7 18.3 6.7 5.4 5.6 14 18.2 6.4 5.1 5.9 21 18.7 6.6 5.2 5.8 28 18.1 6.1 5.4 5.8
* 24, 48 and 72 hours after parturition, respectively
2.1 Piglet characteristics influence on milk production
Sows’ milk production is related to the number of functional glands, the suckling intensity and milk removal from individual glands (Auldist et al., 2000). Functional glands are associated with litter size, whereas heavier piglets are associated with increased production per gland. Furthermore, milk production from individual glands may also be influenced by suckling frequency.
Litter size has been found to be the most important factor affecting sows’ MY (Auldist et al., 1998; Revell et al., 1998b; Hansen et al., 2012b). Noblet et al. (1998) calculated an increase in MY of 0.6 kg/day per additional piglet. In the same context, Auldist et al. (1998) found that when litter size increased from six to 14 piglets, the litter gain increased from 1.7 to 2.8 kg/day. However, increas-ing the litter size and thereby total litter gain will reduce milk intake per piglet, which corresponds to a decrease in average gain from 283 to 202 g/day. This relationship is also supported in a Danish report by Christensen and Sørensen (2013). The decrease in milk intake in litters with more piglets was hypothesized by Kim et al., (1999b) to be ascribed to a decrease in mammary gland size.
The relationship between increased MY and increased litter size is mainly suggested to be due to the increased number of functional teats (Auldist et al., 1998). The number of functional teats de-cides the quantity of milk, and when litter size is increased, more total milk will be removed (Hurley, 2001). In contrast if all the teats of the sow are not utilized, the potential for milk produc-tion is reduced and unused teats will undergo involuproduc-tion (Theil et al., 2006).
A positive relationship between the size of the piglet and the MY has been demonstrated by King et al. (1997). It is suggested that heavier piglets have a greater ability to stimulate the udder and re-move more milk resulting in increased mammary growth and higher MY (Kim et al., 2000). A new bout of milk is available for the piglets approximately within 35 min of the preceding suckling bout (Spinka et al., 1997). Piglets will therefore receive a similar amount of milk after 35 min and piglets suckling more frequently can obtain a greater amount than piglets suckling less frequently. In same context Auldist et al. (2000) and Auldist et al. (1995) (cited by King (2000)) were able to demon-strate that shorter suckling intervals result in greater total milk removal leading to an increase in MY. Sow MY could be increased by 14% when the suckling interval was reduced from 44.9 min to 34.9 min. Consequently, the nursing behavior of the sow and piglets may also control the frequency of milk let down (Fraser, 1980).
The results of Auldist et al. (2000) furthermore suggest that the frequency of suckling plays a role in mammary gland development and mammary gland size has previously been shown to correlate with MY. Nielsen et al. (2001) also found a correlation between piglet weight gain and the weight of the mammary gland. Heavier and more active piglets are also able to stimulate the mammary gland more, resulting in increased mammary gland growth. The intensity of udder massage was also found by Thodberg and Sørensen (2006) to positively influence mammary gland growth.
2.2 Sow characteristics influence on milk production
Sows’ milk production was previously described according to MY and milk composition at differ-ent lactation stages. Differences in milk composition and MY also appear between sows and among breeds (Zou et al., 1992; Mackenzie and Revell, 1998; Farmer et al., 2004). Dourmad et al. (1998) found individual differences among sows from 6.7 to 9.3 kg/d for lower-producing sows and high-er-producing sows respectively. Milk production can further be influenced by parity and sow body condition (King, 2000), which will be discussed below.
Differences in MY have been found for sows in different parities. In general milk production will be lower for primiparous sows than for multiparous sows. The maximum MY is reached between the second and fourth parity and will hereafter decrease (Salmon-Legagnur (1958), cited by Etienne et al. (1998)). This is supported by Christensen and Sørensen (2013) who found the highest litter gain of piglets for 2-4 parity sows. Beyer et al. (2007) reported that the MY of primiparous sows was 14% lower than that of multiparous sows in second parity. From second to fourth parity MY
was additionally increased by 10%., from 7.11 to 7.90 kg/day. A greater difference in MY from first to second parity has been found by Elsley (1971; cited by King (2000)), who suggested an increase of 25% from first to second parity. In contrast, it has been demonstrated by Boyce et al. (1997) that primiparous sows were able to produce the same amount of milk as multiparous sows if litter size and weight were identical.
Body condition is an important factor influencing sows’ milk production since sows are able to maintain milk production by mobilizing body reserves when feed intake is insufficient to meet die-tary requirement. Sows MY during early lactation seems to be affected more by the body condition of the sow at farrowing than by feeding level during lactation (King, 2000). The intensity of mobili-zation of body reserves can affect the composition of sow milk and MY (Noblet et al., 1998; Theil et al., 2012). Body condition influence on MY is rather complex because both thin and fat condition of sows will affect MY and should be minimized. Typically the effects of body condition on MY become more evident in the fourth week of lactation when body reserves become depleted. The effect on MY will depend on which nutrient is the limiting factor and whether the sow is able to buffer milk production by catabolism of body reserves (Theil et al. 2012). When sows are too thin, the body reserves will become depleted and MY will be compromised before well-conditioned sows. On the other hand Revell et al. (1998b) reported that fat sows produced 15% less milk than lean sows. In same context Head et al. (1991) and Head and Williams (1991) (cited by Eissen et al. (2000)) reported that fat sows, in comparison with lean sows, had a lower capacity to secrete milk because they had fewer milk secretory cells.
2.3 Environment characteristics influence on milk production
Environmental factors such as ambient temperature, construction of crates, noise and photo period may affect sows’ milk production. The impact of photo periods and noise stimuli from the environ-ment on MY can however be questioned (Fraser, 1980; Etienne et al., 1998; Farmer et al., 2004; Lachance et al., 2010). The key factor in question here will therefore be the effect of increasing temperature.
The productivity of sows is depressed when they are exposed to high ambient temperature as previ-ously mentioned. Silva et al. (2009) evaluated the effect of tropical humid climate on sows’ perfor-mance. The authors found a decrease in milk production by 16% from 8.1 to 6.8 kg/d when temper-ature was increased from 23.7 to 26.1°C. Milk composition content was also affected by
tempera-ture, milk fat content was higher and milk protein tended to be less when temperature was in-creased. A temperature about 23.7 °C is after all above the TNZ around 12-22°C, and milk produc-tion could be depressed even more when comparing with sows within the TNZ. This is confirmed by Black et al. (1993) who observed a reduction of 25% when ambient temperature was increased from 18 to 28°C. Black et al. (1993) developed the hypothesis that when sows are exposed to tem-peratures above the TNZ, blood flow is redirected from the mammary gland to skin. Decreasing blood flow to the mammary gland will result in reduced nutrient uptake and contribute to the re-duced MY.
The construction of crates, fixed vs. loose, and space allowance can affect the availability of the udder and the rate of udder massage (Moustsen and Pedersen, 2010). Pedersen et al. (2011) found that piglet weight gain can be increased by 11% when sows are loose housed rather than fixed, indi-cating an easier access to the udder and higher MY. Space allowance in fixed crates also seems to be important for the availability of the udder and thereby litter gain.
2.4 Diet characteristics influence on milk production and “push pull effects”
Feeding of lactating sows is important for the performance of sows and their litters (Hansen et al., 2012a). Mammary gland growth and thereby MY are influenced by energy and protein intake dur-ing lactation (Kim et al., 1999). Although the sow is able to maintain milk production by catabolism of body reserves, milk production still responds to dietary energy and protein intake during lacta-tion. Noblet and Etienne (1986) showed that the energy content in the diet affected milk produclacta-tion. In that experiment energy restricted sows were able to maintain the same MY as normally fed sows. Energy restricted animals were, however, able to increase milk fat and energy output in milk by mobilizing body reserves until day 17. Milk production is therefore reasonably independent of en-ergy intake unless body reserves become depleted. Theil et al. (2004) also demonstrated that sows fed energy above their maintenance requirement prioritize synthesis of lactose higher than covering of maintenance. Increasing the energy density in feed by inclusion of fat was proven by Lauridsen and Danielsen (2004) to increase the daily output of energy and fat in sow milk. The inclusion of different dietary fat sources also reflected the composition of fatty acid in the milk. Overall im-provements in MY have not been detected when energy intake was increased (Lauridsen and Danielsen, 2004; Theil et al., 2004). In contrast, energy restricted animals were able to maintain milk production (Noblet and Etienne, 1986). The milk production of sows must however be
com-promised when body depots become depleted as lactation progresses (Hansen et al., 2012a; Hansen et al., 2012b).
The same pattern has been observed when dietary protein and amino acids (AA) content in the diet was increased. Results of Dourmad et al. (1998) indicated that increasing dietary crude protein (CP) from 15.5-17.1% and lysine (Lys) from 0.66-0.87% did not affect MY or the output of energy and nitrogen (N) in milk. Milk composition was not affected by increasing CP and Lys content in diet either. In the experiment of Dourmad et al. (1998) the levels of protein and Lys were above the re-quirement, and the tested effect was a response of increasing CP and Lys above the requirement. Kusina et al. (1999) determined the effects of insufficient dietary protein intake on the lactation performance of the sow. In the latter experiment sows’ milk production was impaired by 13% (9.15-7.97 kg/day) when dietary CP content decreased from 19.99 to 8.36% during lactation. Re-ducing dietary protein also reduced protein and fat content in milk, and the effect seems to be more pronounced on day 18 of lactation than on day 8.
In the above section dietary energy and protein intake affecting MY has been illustrated. These fac-tors could contribute to the phenomenon “push pull” effects. This phenomenon has been explained by Theil et al. (2012) as a relationship between feed intake and MY. When sows are fed insuffi-ciently, the MY may be improved by increasing feed intake, which is known as a push effect. In contrast, MY cannot be further improved by increasing the feed intake when sows are fed optimal-ly. In this situation when sows are fed optimally, the relation between feed intake and MY is the reverse and a high yield will stimulate sows’ feed intake, which is known as a pull effect. The same picture is evident for energy and protein supplementation. Increasing the supply of energy and pro-tein cannot enhance the MY in well fed sows, but MY will be depressed in highly catabolic sows when body reserves are insufficient to support milk production.
Attempts to overfeed primiparous sows, the phenomenon super-alimentation, of (Pluske et al., 1998) clearly illustrate that sows’ milk production cannot be further enhanced by infusion of addi-tionally 38% energy above requirement. In the mentioned experiment primiparous sows were used, which may prioritize further growth compared to a multiparous sow. The results could then have been different if multiparous sows were being used instead. Addition of 38% energy above the re-quirement must, however, more than cover the supply for growth, and if milk production could be improved by increasing energy, it should have become evident. Alternatively when energy supply is
increased, protein and AA should follow too, which was not the case in the experiment of Pluske et al. (1998).
2.5 Inadequacies of sows’ milk production
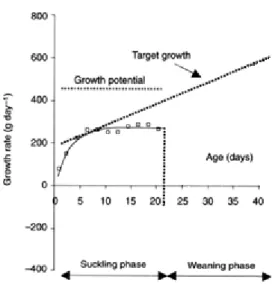
Sows MY is the most limiting factor for potential piglet growth during lactation (Hartmann et al., 1984; Harrell et al., 1993; Zijlstra et al., 1996). In an experiment with artificial rearing of piglets Harrell et al. (1993) found that sows’ milk production becomes insufficient to meet piglets’ energy demands on days 8 to 10 of lactation, which progressively increases through lactation. On day 21 of lactation the estimated milk requirement for all piglets in litters of 10 is 18 kg/day. Zijlstra et al. (1996) also found that piglets weaned and fed milk replacer from day 18-25 weighed 20% more than piglets suckled until day 25. Offering milk replacer ad libitum from day 1 to 21 (Azain et al., 1996) and day 4 to 21 (Park et al., 2014) increased the weaning weight by 16.4% and 11%, respec-tively. These results demonstrate the insufficiency of sows’ milk production to meet optimal piglet growth whether weaning occurs during the third or fourth week of lactation. Piglets’ growth poten-tial during lactation is illustrated in Figure 2. It is estimated that piglets’ biological potenpoten-tial for growth is 466 g/day from parturition until weaning on day 21 of age, which would require an in-crease of milk production by 43% each day (Harrell et al., 1993).
Figure 2 – Piglet growth potential during the lactation pe-riod (modified from Le Dividich and Seve (2001)).
Although sows’ milk production seems to be the limiting factor for piglet growth, sows’ milk pro-duction is on the other hand also affected by the nursing demand of the litter (King et al., 1997).
King et al. (1997) investigated the relationship between piglet BW and milk production in a cross-fostering experiment. The authors found that newly farrowed sows cross-fostering 2-week old piglets could increase milk production by 26% in the first week of lactation. Conversely, sows receiving newborn piglets after 2 weeks could decrease MY by 22% in the subsequent week. Auldist et al. (1998) also suggested that sows may be able to produce more milk and particularly in early lacta-tion when litter size increased. The results of the cross-fostering and litter size experiment support the view that sows have the capacity to produce more milk and that the capacity is influenced by the nursing demand. Also it seems more evident that milk production can be altered in early lactation when the sows’ milk production is not a limiting factor.
Attempts have been made by Garst et al. (1999b) and Garst et al. (1999a) to machine milk sows to determine the MY of sows. The above mentioned authors found that litter weight gain was de-pressed when sows were machine milked and taking care of piglets at same time. The results then indicate that sows are not able to compensate for piglets’ nursing demand by increasing the MY. Transgenic alteration of sow milk has, however, been proven to improve the lactation performance of sows (Wheeler et al., 2001). Noble et al. (2002) conducted an experiment with first-parity trans-genic gilts expressing bovine α-lactalbumin in their milk to improve piglet growth. The authors found that an increased lactose content leading to a higher MY increased piglet growth rate and weaning weight. MY was especially improved in early lactation (d 3-9) by 10-18% resulting in a weaning weight of 5.09 kg compared with 4.85 kg after a 21-day lactation period.
2.6 Estimation of sows’ MY
In practice, MY is predicted indirectly by measuring the milk intake of the piglets. The common way to measure MY has previously been the weigh-suckle-weigh (WSW) or D2Omethod. These methods are laborious and expensive to use so models have been established to estimate MY from the average litter growth (Noblet and Etienne, 1989) and a more recent model from litter growth and litter size (Hansen et al., 2012b). Older models only give vague estimations of the MY or pre-dictions of the average MY. Theil et al. (2002b) also found that milk production when using the WSW method was 12.7% lower than MY found by the D2O dilution technique. Hansen et al. (2012b) also found that MY was underestimated by approximately 20% when using the WSW method compared with the D2O dilution technique.
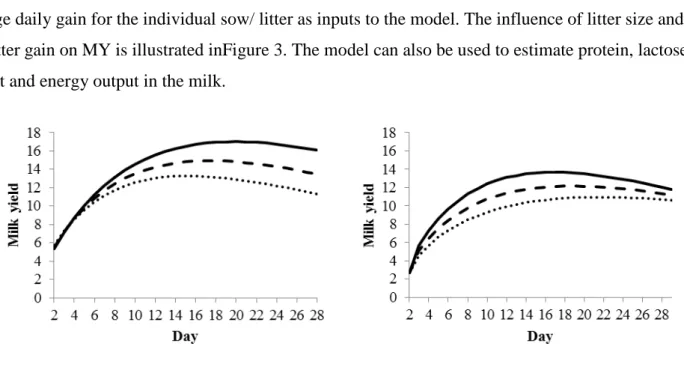
The recent approach to developing a model by Hansen et al. (2012b) was obtained from 18 studies published after 1980. The model estimates the lactation curve of sows by using litter size and aver-age daily gain for the individual sow/ litter as inputs to the model. The influence of litter size and litter gain on MY is illustrated inFigure 3. The model can also be used to estimate protein, lactose, fat and energy output in the milk.
Figure 3 - Left figure illustrates the effect of changing litter gain from 2.5 kg/day (….) to 3.1 kg/day (- - -) or 3.7 kg/day (___) and fixed litter size of 14 on MY. Right figure illustrates the effect of changing litter size from 10 (….) to 12 (- - -) or 14 (___) and fixed litter gain of 2.65 kg/day on MY. The figures are obtained from the equations of Hansen et al. (2012b).
3
Nutrient requirement of the lactating sow
The improved development in milk production over the years has increased sows’ requirement for nutrients. The VFI of the sow may become insufficient to meet the increasing demand for nutrients and the sow will compensate by mobilizing body depots to maintain milk production. Feyera (2014a) has also demonstrated that sows’ requirement for nutrient does not follow the same pattern. This shift in nutrient requirement is however not possible to cover with the one diet system, which will only provide a fixed ratio between energy and protein/AA throughout lactation.
During lactation sows’ nutrient intake should cover the requirement for maintenance and milk pro-duction. Requirement for maintenance will depend on age/weight whereas first parity sows will not be full-grown and have a larger nutrient requirement for body growth (Eissen et al., 2000). Older sows have a higher BW than young sows and therefore have a higher maintenance requirement. Furthermore, requirement for milk production and maintenance can be influenced by many factors as previously discussed in sections 1 and 2.
Lactating sows’ requirement for nutrients can be determined factorially according to their expendi-ture for milk production, growth and maintenance and the efficiency of nutrient utilization and/or catabolism of body reserves (Noblet and Etienne, 1987b). In the following section lactating sows’ requirement for energy, Lys and N will be described.
3.1 Energy requirement
Lactating sows’ requirement for energy (ME) can roughly be ascribed to the sum of energy re-quirement for maintenance, milk production and heat loss associated with milk production (Theil, 2015). Energy for milk production and maintenance accounts for 69% (54% secreted + 15% heat) and 30%, respectively (Feyera, 2014a). Sows’ requirement for energy can be determined by the following four equations:
Energy for maintenance (HE), MJ: BW0.75× 482 kJ Energy secreted in milk (ESM), MJ: MY × Energyconc
Energy associated with milk production (EMP): (ESM / 0.75) - ESM Total energy requirement (TER), MJ/day = HE + EMS + EMP
Energy requirement for maintenance is proportional to metabolic weight and has been estimated by Theil et al. (2004) at 482 kJ/kg0.75 per day. The requirement for milk production can be estimated by calculating the MY and measuring the energy concentration in milk. EMP can be calculated as the efficiency of energy utilization. Efficiency estimates for utilization of ME for milk production were found to be 0.72 by (Noblet and Etienne, 1987b) and 0.78 by (Theil et al., 2004). An average effi-ciency for energy utilization of milk production can be assumed to be 0.75. TER accounts for at least 95% of the energy required. The supply from regeneration of uterus during the first week and the requirement for mammary growth are left out from the equation because of negligible impact. The efficiency of utilizing body depots to sustain milk production has been calculated at 0.86-0.89 (Noblet and Etienne, 1987b). ME is retained with an efficiency of 0.74 (Strathe et al., 2012). Re-constitution of depots during subsequent pregnancy results in a utilizing efficiency corresponding to the efficiency of direct utilization of dietary ME for milk. The energy efficiency will therefore de-pend on whether energy is utilized from feed or depots:
Energy from feed Energy in milk = 0.75
The efficiency of utilizing energy is reduced when energy is restored in body tissues before it is being secreted in milk. Theoretically, it is therefore more efficient to supply sows optimally during lactation.
3.2 Lysine requirement
The Lys requirement for lactating sows can roughly be ascribed to the sum of requirement for maintenance and milk production. Requirement for Lys corresponds to 5% and 94% of Lys intake to cover the requirements for maintenance and milk production, respectively (Feyera, 2014a). Sows’ requirement for Lys can be determined by the following three compounds:
Lys for maintenance (LM), g SID: 2.46 SID g/day Lys secreted in milk (LSM), g SID: MY × Lysconc Total Lys requirement (TLR), g/day = LM + LSM
The amount of Lys required for maintenance is a table value from NRC (2012) for a 200 kg lactat-ing sow. The Lys requirement for milk production can be estimated by calculatlactat-ing the MY and measuring the Lys concentration in milk. After parturition regression of the uterus will supply ap-proximately 3.89 g/d from day 2-7, which more than covers the requirement for maintenance. In total Lys supply from the uterus accounts for approximately 13% of the Lys requirement from day 2-7 of lactation and should ideally be taken into consideration in the supply of Lys from day 2-7. The contribution of Lys from the uterus is only valid if the uterine degradation after parturition hap-pens uniformly, which is unlikely (Theil, 2015). The requirement for Lys given here accounts for at least 95% of the requirement. The requirement for mammary growth is a minor part and can be left out from these equations.
3.3 Nitrogen requirement
Lactating sows’ requirement for N is expressed on basis of net energy (feed units) in the Danish feed evaluation system. The dietary supply of N or CP also needs to meet the requirement for AA. Overall the requirement for N is not well defined, mostly because of the uncertainty about the sows’ requirement for individual essential AAs. Furthermore, urea will be secreted if there is an imbalance in the AA profile and if sows are fed an excess amount of N. It is therefore more appropriate to quantify the amount of N lost in the urine than to evaluate the amount of N required for mainte-nance (Hansen et al., 2014).
Roughly N intake should therefore cover the demand for milk production and maintenance correct-ed for N lost as urea. A factorial approach by Feyera (2014a) estimatcorrect-ed N requirement for mainte-nance based on N lost in urine and N required for milk production, which accounted for 29% and 70%, respectively. Sows’ requirement for N can be expressed as the following three compounds:
N for maintenance (NM), g SID: Loss in urine N secreted in milk (NSM), g SID: MY × Nconc Total N requirement (TNR), g/day = NM + NSM
The amount of N lost as urea can vary from 28-30 % during lactation and is dependent on dietary intake, because protein turnover will increase when the dietary supply of N increases (Theil et al., 2004; Theil, 2015). The N requirement for milk production can be estimated by calculating the MY and measuring the N concentration in milk. The requirement for N given here accounts for at least 95% of the N requirement. In addition an N supply of 10.89 g/d from regeneration of uterus during the first week must be incorporated into the endogenous pool because it contributes with 19-11 % of the N requirement from day 2-7, respectively (Feyera, 2014a). The requirement for mammary growth is a minor part and can be left out from these equations.
4
Nutrient balances during lactation
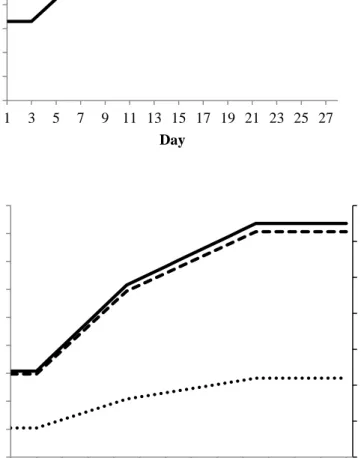
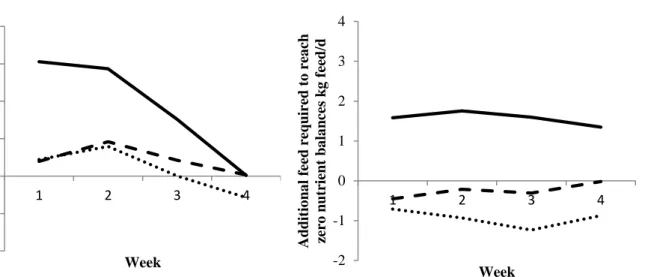
During lactation sows are in negative energy balance in early lactation when feed intake is insuffi-cient to meet the requirement for nutrients. The energy balance for sows can be seen in Figure 4; the upper figure illustrates the energy intake for traditionally fed sows in Denmark and a curve for re-quired energy. From the figure it appears that sows are in negative energy balance in early lactation until day 15 of lactation and become in positive energy balance from day 15 when feed intake is sufficient to meet the requirement. The lower graph in Figure 4 illustrates the required ratio between Lys and energy for lactating sows throughout the lactation period against the ratio sows obtain through feeding with a 1-diet system. The 1-diet system applied in Denmark will therefore only supply sows feed with a fixed ratio throughout lactation although the required ratio increases from approximately days 1 to 16 of lactation. It also appears from the figure that the ratio in a standard lactation diet will only provide sows the right ratio until day 4, after which the diet will be insuffi-cient in Lys relative to energy.
Figure 4 – Upper figure: Energy intake (- - -) is obtained from the feeding curves for-mulated by the Danish Pig Research Centre. Energy requirement (___) is based on re-quirement calculation for maintenance, heat energy associated with milk production (Theil et al., 2004) and requirement for milk production calculated from Hansen et al. (2012b) (input litter size = 14 and litter gain = 2.65 kg/day). Lower figure: Lys and en-ergy ratio in a traditional diet for lactating sows (- - -) and the required ratio (___) throughout the lactating period.
The supply of energy and nutrients for maintenance and milk production during lactation comes from feed and mobilized body tissues when feed intake is insufficient (Hansen, 2012). Because of the insufficient feed intake during early lactation high producing sows start mobilizing body
re-0 20 40 60 80 100 120 140 2 4 6 8 10 12 14 16 18 20 22 24 26 28 ME ( MJ ) Day 0.30 0.35 0.40 0.45 0.50 0.55 0.60 2 4 6 8 10 12 14 16 18 20 22 24 26 28 L y si n e: E n erg y ra ti o Day
serves to supply energy and nutrients for milk production (Mullan and Williams, 1989) and it is common for older sows to lose 20-30 kg during lactation (Theil et al., 2012).
Mullan and Williams (1990) investigated the energy balances of lactating sows in relation to feed-ing level and found that when sows were fed to appetite, sows will still lose both lipid (520 g/day) and protein (130 g/day); however, the loss was dependent on which feeding strategy was used for the sows during gestation. These results are comparable with the results of Theil et al. (2004) who found that sows fed a high amount of fat (384 g/d) still mobilize the same amount of body fat as sows with normal fat inclusion in the diet (80 g/d), 131 vs. 153 g/day, respectively.
In a recent study of Feyera (2014b) sows’ BW loss in response to four dietary treatments with two levels (high and low) of energy and Lys (HEHL, HELL, LEHL and LELL) was evaluated. LELL, LEHL, HELL and HEHL refer to insufficient amount of energy and Lys, insufficient amount of energy, insufficient amount of Lys, sufficient amount of energy and Lys, respectively. The weight loss, fat and protein loss for each dietary treatment are illustrated in Figure 5. This study underlines the fact that sows mobilize from body reserves to cover the requirement for milk production even though the energy and protein balances are positive. Sufficiently fed sows still lose 12 kg BW dur-ing the lactation period. The study also illustrates that the ratio between Lys and energy is crucial for weight loss, because apparently sows are not able to metabolize fat or protein when energy or Lys supplies are insufficient. Flummer et al. (2014) also concluded that in spite of large differences in feed Lys to energy ratio, only minor changes in the ratio between mobilized protein and energy were observed. The optimum ratio between Lys and energy to increase MY was estimated to be 53 g of SID Lys per MJ. Furthermore, it can be seen that LELL sows lose the same amount of protein and fat as sows receiving LEHL; the same pattern was seen for HELL and HEHL fed sows. Overall, it appears that an insufficient supply of energy is most crucial for mobilization from body stores. Furthermore, it is possible for the sows to be in positive energy balance and still mobilize fat be-cause there is an unfavorable ratio between protein and energy. This relation was also observed by Kusina et al. (1999) who found that weight loss and back fat (BF) were reduced when protein and Lys intake was increased.
Figure 5 - Weight loss (black column), protein (shaded column) and fat loss (grey column) during lactation in four dietary treatments (modified from Feyera (2014b)). LELL, LEHL, HELL and HEHL refer to low energy and low Lys, low energy and high Lys, high energy and low Lys and high energy and high Lys, respectively. Dif-ferent letters (a, b, c) within the same color differ significantly (P < 0.05).
4.1 Relation between plasma parameters and nutrient balances during lactation
During sows’ lactation substantial physiological changes occur, going from negative energy balance in early lactation to either zero or positive energy balance later in lactation (around day 15, Figure 4), which will affect the concentration of metabolites in plasma (Mosnier et al., 2010; Hansen et al., 2012a). When milk production is initiated, the requirement for milk synthesis rapidly increases and the feed intake can, however, not keep up with the increasing requirements for nutrients or the sows are not supplied enough. As a consequence sows become catabolic and start mobilizing nutrients to cover the requirement. The catabolism of body depots can to some extent be traced in blood plasma samples, and central plasma metabolites are described in the following:
In general plasma concentrations of insulin is closely tied to the circulating concentrations of glu-cose as insulin acts to lower gluglu-cose in plasma and keep gluglu-cose constant (Akers and Denbow, 2013). Furthermore, insulin acts to lower plasma concentrations of fatty acid and AAs and to pro-mote the conversion into storage (Cunningham and Klein, 2013). In contrast low plasma insulin will stimulate the catabolism of glycogen and mobilization of muscle and fat tissue, which will cov-er a part of the nutrient requirement. During the lactation pcov-eriod the gencov-eral intcov-erpretation of the
a a b b a ab bc c a a b b 0 5 10 15 20 25 30 35 40
LELL LEHL HELL HEHL
Kg
role of insulin is, however, too simple to explain the observed changes in plasma insulin and plasma glucose and no clear explanation exists. It has, however, been suggested to be related to an altered distribution of nutrients and lowered insulin sensitivity in peripheral tissues during lactation. This favors the supply of nutrients to the udder (which is insulin independent) at the expense of other body tissues (Theil et al., 2012). The plasma concentration of insulin was found by Mosnier et al. (2010) to increase 4 hours post prandial, after parturition (from app. 24 to 38 µUI/mL) and decrease from day 4 of lactation until reaching a plateau at weaning (app. 12 µUI/mL). For plasma glucose the concentration slightly increases in early lactation (app. up to 0.93 g/L) and reduces throughout lactation (app. 0.78 g/L at weaning). The decrease in plasma insulin and plasma glucose in lactation is in contrast with the general understanding of insulin, because when insulin levels are high glu-cose levels should be the reverse.
Negative energy balance is associated with increased plasma non-esterified fatty acid (NEFA), which indicates that energy is mobilized from fat tissue. The urea concentration in plasma is indica-tive of oxidation of AAs and high levels indicate either breakdown of muscle tissues (to cover the requirements for energy, protein or individual AAs) or oxidation of excessive AA (imbalances of AA profile) supplied in the feed. Triglycerides (TAG) and lactate are mainly a response controlled by feed intake as TAG represents the quantity of fatty acids taken up from feed and lactate concen-tration to some extent reflects the amount of starch converted by lactic acid bacteria. However, lac-tate can also originate from the conversion of N and propionate in the liver or anaerobic metabolism in the muscles.
5
Long term consequences of suboptimal feeding
Commercially housed sows lose large amounts of BW during lactation and excessive weight loss due to negative energy balance during lactation has an unfavorable impact on sows in subsequent reproductive cycles (King and Williams, 1984; Whittemore, 1996). The catabolism of body tissues for maintaining milk production instead of conserving nutrients as reserves for the next reproduc-tive cycle affects the weaning to estrus interval (WEI) and litter size in subsequent reproduction (Zak et al., 1997). Culling of sows in commercial farms often happens because of reproduction fail-ures (Vestergaard et al., 2004).
Reproduction problems as a consequence of excessive weight loss have been found to affect repro-duction in several ways, including increasing interval from weaning to estrus, an increased
inci-dence of anestrus, a decreased conception rate, lower ovulation rate and higher embryonic mortality (Zak et al., 1997). In contrast reproductive problems may also arise around farrowing due to in-creased weight and condition by overfeeding during late pregnancy (Dourmad et al., 1994). These problems may be related to farrowing complication and metabolic disorders and studies have found that increasing the feed intake during late gestation increased the occurrence of agalactia (Persson et al., 1989) and the number of still born piglets (Persson et al., 1989; Cools et al., 2014).
The reestablishment of a new reproduction cycle is initiated after weaning when suppression of LH increases (Kemp, 1998). LH stimulates the follicle maturation and is essential for ovulation. The reproductive process is dependent on nutrient availability because depletion of body reserves during lactation establishes a hormonal background which affects follicular growth (Baidoo et al., 1992). When sows’ feed intake is low during lactation, the concentration of glucose is low as is the secre-tion of insulin and LH (Koketsu et al., 1996b; Koketsu et al., 1998). As a consequence the low LH secretion will adversely affect the WEI. The WEI seems to be similar in different parities although primiparous sows generally seem to be more sensitive than multiparous sows (Whittemore and Morgan, 1990).
Prolonged WEI has also been proven to depend on which body tissue is being mobilized (Reese et al., 1984). Reese et al. (1984) suggest that the WEI is more affected by catabolism of body fat than catabolism of muscle tissue during lactation. In contrast, King (1987) found a critical daily level of energy about 45 MJ DE for which the WEI is affected. A more recent suggestion for lactating sows is to keep weight loss in the range of approximately 15-25 kg (Theil et al., 2012).
The longevity and long term performance of sows are best accomplished by avoiding severe body loss and extreme fluctuations in BW and fat reserves (Aherne and Kirkwood, 1985; Eissen et al., 2000). Koketsu and Dial (1997) also found that ensuring a greater feed intake of sows during lacta-tion will improve the reproductive performance and thereby the longevity of sows. Furthermore, thin sows are also more prone to developing shoulder lesions, which has been implemented in Dan-ish culling strategies (Kaiser and Petersen, 2014). Continued selection for lean pigs will further re-duce the body fatness of sows and rere-duce feed intake (Eissen et al., 2000). Selection for higher feed intake or at least average daily weight gain should therefore be considered in further breeding. Reconstitution of body tissue in the subsequent reproductive cycle is not energetically and econom-ically favorable. The efficiency is lower when feed is deposited as body reserves and later mobi-lized (during lactation) due to oxidation, section 3.1. As a rule of thumb, it takes 4 kg of feed to gain
1 kg of BW. Deposition of 1 kg protein is associated with additionally 4.2 kg water and 1 kg fat is associated with additionally 0.17 kg water (Noblet and Etienne, 1987a). The equation for weight and water loss is:
Weight loss = 5.20(± 0.12) x protein mobilization + 1.17(± 0.12) x fat mobilization Water loss = 4.20 x body protein loss + 0.17 x body fat loss
Recalling the weight loss of 37 kg from Figure 5 for the LELL sows composed by a protein loss of 5.31 kg and a fat loss of 13.9 kg, the following calculations are made:
Weight loss = 5.20(± 0.12) x 5.31 + 1.17(± 0.12) x 13.9 = 44 kg Water loss = 4.20 x 5.31 + 0.17 x 13.9 = 24 kg
With the equation obtained from Noblet and Etienne (1987a) it is possible to approximately esti-mate the weight loss from protein and fat loss. Furthermore it is possible to calculate how much of the weight loss can be ascribed to water loss.
6
Final remarks and conclusion of literature review
- There may be a potential to further increase sows’ MY by paying attention to non-nutritional factors (e.g. litter size, litter weight or nursing frequency)
- Sows’ requirement for nutrients is more diverse according to differences in voluntary feed intake and MY
- It should be possible to generate a feeding curve more adapted to the energy requirement of the sow to avoid excessive weight loss during lactation
- Sows can be fed closer to their requirements in early lactation, but practical experience shows that voluntary feed intake is greatly reduced.
- The 1-diet feeding strategy used so far for lactating sows is not well balanced with nutrients required to support milk production during the entire lactation
- Negative energy balance should be avoided to improve sows’ longevity
- Avoiding weight loss during lactation improves feed efficiency and feeding costs
The literature review indicates the need for a feeding strategy for lactating sows that takes into account the individual sow’s requirements to cover maintenance and milk production. This is, however, not possible with a 1- diet feeding strategy.
MANUSCRIPT TO BE SUBMITTED
12
Running head: Nutrition of lactating sows 3
4 5
A 2-diet feeding regime for lactating sows reduces nutrient deficiency in early lactation and 6
improves milk yield1 7 8 9 T. F. Pedersen* 10 11 12
*Department of Animal Science, Faculty of Science and Technology, Aarhus University, DK-8830 13 Tjele, Denmark. 14 15 16 17 ________________________________________ 18 1
The research project was funded by the Ministry of Food, Agriculture and Fisheries of 19
Denmark, grant no. 3405-11-0342 20
2
Corresponding author: [email protected]
21 22
ABSTRACT: The objective of the present study was to evaluate whether a new feeding re-23
gime composed of two diets throughout lactation could minimize sow weight loss and increase milk 24
yield (MY) and piglet weight gain. In total, 14 sows were included in the experiment from parturi-25
tion until weaning 28 d later. The sows were fed one of two dietary feeding regimes from lactation 26
d 2 and throughout the lactation period. The 1-diet feeding regime represented the Danish feeding 27
standards and recommendations and the new 2-diet regime supplied sows feed according to their 28
individual requirement. The 2-diet regime was composed of a basal diet, formulated to cover the 29
energy requirement for maintenance and a lactation supplement formulated to cover the increasing 30
requirement for milk production. Sows’ feed intake and weight loss were affected by an interaction 31
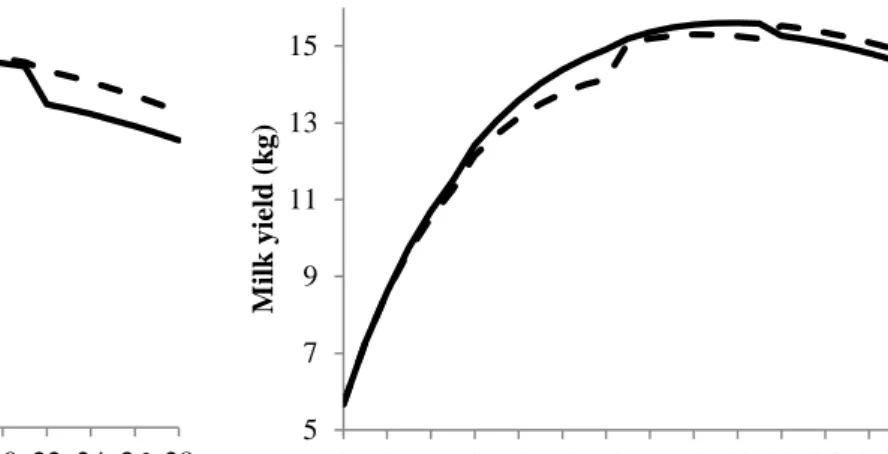
between diet regime and treatment. In lactation wk 4 sows fed the 1-diet feeding regime produced 32
less milk (13.0 kg/d) than the sows fed the 2-diet regime (14.9 kg/d). Piglet weight gain was numer-33
ically higher (P = 0.11) throughout the lactation period for sows fed the 2-diet regime. Sows in both 34
dietary regimes were in negative energy balance throughout lactation. Sows fed the 1-diet regime 35
were negative in N and Lys and reached a positive or zero balance in late lactation. For the 2-diet 36
feeding regime sows’ N and Lys balance was positive throughout lactation, and N loss was higher 37
for sows fed the 2-diet feeding regime. The concentration of urea in plasma was lower for sows fed 38
the 1-diet feeding regime. In conclusion feeding lactating sows with the 2-diet feeding regime 39
throughout lactation improved sows’ MY and mean piglet weight (as lactation progressed), and the 40
mobilization pattern was altered although the mobilization over the entire lactation period was not 41
affected. 42
Key Words: milk yield, nutrient balances, feeding regime, plasma metabolites. 43
44
INTRODUCTION
The lactation period is an important part of the sow’s reproduction cycle and is crucial for 46
the survival of piglets. Sows’ milk yield (MY) has increased during the past decades and sows are 47
today able to produce 1.5 times their own weight in milk (Hansen et al., 2012b). Sows’ MY is, 48
however, relatively insensitive to manipulation by feeding e.g. additional supply of protein or fat 49
(Dourmad et al., 1998; Lauridsen and Danielsen, 2004). 50
During lactation substantial changes occur, and sows mobilize great amounts of nutrients 51
from body reserves (Theil, 2015). Typically, commercial sows lose 10-30 kg of BW during lacta-52
tion even though they are fed ad libitum (Beyer et al., 2007; Smits et al., 2013; Cools et al., 2014), 53
but weight losses may be even higher (Kim et al., 2009).Excessive BW loss has an unfortunate 54
effect on the subsequent reproductive cycle by e.g. delaying return to estrus (King and Dunkin, 55
1986; Zak et al., 1997). Furthermore, in the long run, it is not energetically efficient to use body 56
depots to support MY instead of using energy directly from feed (k = 0.72-0.78) (Noblet and 57
Etienne, 1987b; Theil et al., 2004). The efficiency of utilizing body depots (k = 0.86-0.89) and re-58
taining energy (k = 0.74) in the subsequent gestation period reduces the efficiency to approximately 59
0.65 to sustain MY (Noblet and Etienne, 1987b; Strathe et al., 2012). 60
Lactating sows’ nutrient requirement is today covered by a single diet fed throughout lacta-61
tion. The 1-diet regime is not able to take into account the changing requirements of Lys, nitrogen 62
(N) and energy (Feyera and Theil, 2014). Sows’ requirement for energy is both determined by 63
maintenance and MY, while the Lys requirement is almost exclusively determined by MY (Theil, 64
2015). An increasing interest in using a dynamic 2-diet regime to cover lactating sows’ requirement 65
has therefore evolved, but experience is still scarce. 66
The objective of the present study was to evaluate whether a new feeding regime composed 67
of two diets throughout lactation could minimize sow weight loss and increase sow MY and piglet 68
weight gain. 69
70
MATERIALS AND METHODS
71
The experiment complied with the Danish Ministry of Justice, Act no. 253 of March 8 2013 72
concerning experiments with animals and care of experimental animals, and a license issued by the 73
Danish Animal Experiments Inspectorate. 74
75
Animals and Housing 76
77
A total of 14 cross-bred (Danish Landrace x Yorkshire) second parity sows were included in 78
the experiment from parturition until weaning 28 d later. The experiment was carried out at Aarhus 79
University, Foulum, Denmark in the period from March 2014 to May 2014. Sows and their litter 80
were individually housed in fixed farrowing crates (2.7 x 1.8 meter). Pen floor consists of one half 81
concrete floor and one half iron slatted floor. The temperature was kept around 20ᵒC around farrow-82
ing and then gradually reduced to 16 ᵒC throughout the experimental period. The piglets were pro-83
vided with heating lamps in the cave throughout the experimental period and floor heating was 84
turned on the first 14 d after farrowing. Sawdust was provided in the piglet cave before parturition. 85
Until 48 h after farrowing the light was on 24 h and for the rest of the experimental period the light 86
was on from 06-18 and again in connection with feeding from 00.30 to 01.00. 87
88
Diets and Feed Composition 89
90
Two different feeding regimes were supplied; a standard lactation diet (1-diet feeding re-91
gime) as a control diet or a basal diet and lactation supplement (2-diet feeding regime). The 1-diet 92
group represented the traditional feed composition and feeding strategy in Denmark, where feed 93
allowance increases in early lactation and is kept high in wk 3 and 4. The 2-diet group received a 94
basal supplement (which covered maintenance requirement) and a lactation supplement (covering 95
requirement for milk production). Dietary formulations of the 1-diet, basal diet and lactation sup-96
plement are shown in Table 1. Feed was provided automatically three times a d at 00.30 and 08.30 97
AM and 04.30 PM. Sows had free access to water. No straw was provided but sows were supplied 98
a rope for stimulation of nursing and rooting behavior. 99
100
Feed Regime Formulation 101
102
The control diet was formulated according to Danish standards and recommendations 103
(Jørgensen and Tybirk, 2010). Sows fed the 2-diet feeding regime received the energy required for 104
maintenance from the basal diet, and Lys and N content in the basal diet was kept low and formu-105
lated to match the requirement for gestating sows (Theil et al., 2004; NRC, 2012). Lactation sup-106
plement was formulated to cover the Lys requirement for milk production, and protein was included 107
to obtain the optimal Lys supply based on factorial calculations. And inclusion level of synthetic 108
Lys was the same as in the control diet. The CP content for basal diet and lactation supplement was 109
dictated by the Lys content. The energy content of the basal diet was comparable to that commonly 110
used for gestating sows, whereas the dietary energy in the lactation supplement was comparable to a 111
standard lactation diet. The energy content was elevated in the lactation supplement by addition of 112
soybean oil. The basal diet and lactation supplement was formulated to contain the same amount of 113
barley and wheat. The basal diet was, furthermore, formulated to contain more dietary fibers. 114
Feeding Level. The 1-diet regime sows were fed 3.3 kg from lactation d 1 to 3, from d 4 to 115
10 feed allowance increased by 0.5 kg per day to 6.6 kg. From lactation d 11 - 20 sows’ feed allow-116
ance increased to 9 kg and it was kept constant until weaning. The feeding level for sows fed the 2-117