Masoud Hassanpour Asheghabadi
Institute for Communication Systems (ICS)
Faculty of Engineering and Physical Science (FEPS)
University of Surrey
This dissertation is submitted for the degree of
Doctor of Philosophy
I hereby declare that except where specific reference is made to the work of others, the contents of this dissertation are original and have not been submitted in whole or in part for consideration for any other degree or qualification in this, or any other university. This dissertation is my own work and contains nothing which is the outcome of work done in collaboration with others, except as specified in the text and Acknowledgements.
Masoud Hassanpour Asheghabadi June 2019
To my life-teacher, my late father: because I owe all of my life and all of my achievements to you. I have really missed the nights that we spent hours on speaking about poems, old Persian stories and their meanings.
I would like to express my special appreciation and thanks to my Principal Supervisor Professor Rahim Tafazolli. I would like to thank you for supporting me and encouraging my research. I will never forget that without your supports, I couldn’t even start my PhD. I would also like to thank Professor Payam Barnaghi. I would like to thank you for all of your supports and interesting discussions. I will never forget our discussions on Quantum Mechanics. I would also like to thank my friend, my brother and my supervisor, Dr. Seyyed Amir Hosseini-Tabatabaei, because of your helps, supports and advices.
My sincere and special thanks to my true friends who made my stay in the UK memorable. Mrs. Sarah Mahvash, Mr. Khashayar Rahimi, Dr. Fatemeh Tahavori, Miss. Shima Abdollatif, Miss. Maliheh Aminian, Miss. Maryam Moeini, Dr. Shirin Enshaeifar, Dr. Soheil Soodmand, Dr. Soheil Payami and Dr. Mohsen Khalili, thank you all.
During this period, I have found five other brothers. Dr. Vahid Heydari Fami Tafreshi, Mr. Shahin Kiassat, Mr. Muhammad Heydari Fami Tafreshi, Mr. Basset Gholizadeh and Dr. Hosein Jahangiri. thank you for all your supports and encouragements.
Special thanks go to my beloved mother. Words cannot express how grateful I am to you. Thanks mom for all of your love and sacrifices. Also, this thesis would not be possible without the love and support of my sister Zahra, my brother Mansour and his wife Akram.
Masoud Hassanpour Asheghabadi May 2019
Owing to growth in the popularity of mobile phones, solutions for more efficient mobile network resource management have been increasingly demanded by network operators. Predicting the future state of the network and allocating the network resources based on the predicted state has been proposed as an effective method for efficient management of the network resources by the research community. One of the major factors that changes the future state of network is changes in the behavior of users. As the result, to forecast the future state of network, a major task is to predict the future behaviors of users. This task is accomplished by User Behavior Prediction Models (UBPrMs). In order to maintain the quality of the service, such methods are expected to provide sufficiently accurate prediction. However, the existing methods often are not able to meet this performance requirement.
The accuracy of a predictive model is affected by two distinct sources of error, namely
Modeling Error (ME) andSampling Error(SaE). As the result, one ought to consider both sources of error while improving the performance of a model. To do this, this thesis aims to study and alleviate the impact of the mentioned sources of error on the performance of a UBPrM.
To treat the ME, we propose a novel group-level user behaviors prediction framework as a more accurate alternative for population-level user behaviors prediction models and a more computationally efficient alternative for individual-level user behaviors prediction. The novel framework is calledEvent Profiling Method(EPM). To diminish the impact of ME, the proposed event-based method takes advantage of similarities amongst users’ behavior and the existing underlying patterns that repetitively occur in the network.
To evaluate the proposed framework, EPM method needs to be implemented in real-world scenarios. Video popularity prediction is considered as a suitable use case for EPM. For this purpose, this thesis utilizes the ideas of EPM framework to propose a novel approach for enhancing the video popularity prediction models. Using the proposed approach, we enhance three popularity prediction techniques that outperform the accuracy of the prior state-of-the-art solutions. The major components of the proposed approach are three novel mechanisms for "user grouping", "content classification" and "dominant-follower users identification". The user grouping method is an unsupervised clustering approach that divides the users into
an adequate number of user groups with similar interests. The content classification approach identifies the classes of videos with similar early popularity trends. The dominant-follower identification technique divides the users in each group into two distinct subgroups based on their reaction time to the released videos. To predict the popularity of the newly-released videos, our proposed popularity prediction model trains its parameters in each user group and its associated video popularity classes and user subgroups. Evaluations are performed through a 5-fold cross validation and on a dataset containing one month video request records of 26,706 number of BBC iPlayer users. Our analysis shows that the accuracy of the proposed solution outperforms the state-of-the-art including S-H, ML, MRBF models on average by 59%, 27% and 21%, respectively.
Afterwards, this thesis proposes a novel combination technique for multi-dimensional user profiles that is able to treat the SaE. In doing so, the proposed technique considers the samples of other users’ behavior (or in general, other items) as a biased approximation of each user (or an item). The method utilizes two conditions on the magnitude and sign of the estimated bias between two users to decide on combining their profiles or not. The proposed technique is evaluated against synthesized and real-world datasets. Our results show that the proposed method provides better estimations of the statistics of the synthesized datasets than the standard method. To test the proposed method in the real world, we utilize one-month content request records of 787 users of BBC iPlayer. We show that our proposed method performs on average 15% better than the standard method.
List of figures xiii
List of tables xv
Nomenclature xvii
1 Introduction 1
1.1 Error sources affecting the accuracy of UBPrMs . . . 2
1.2 Approaches used in the existing UBPrMs . . . 4
1.3 Motivation . . . 7
1.4 Research approach . . . 7
1.5 Contributions . . . 9
1.6 Thesis structure . . . 10
2 Background and related works 13 2.1 Factors affecting UBPrMs . . . 14
2.1.1 Predictability of user behaviors . . . 16
2.1.2 Predictability of the user spacial movements . . . 17
2.1.3 Predictability of the users’ activities in World Wide Web . . . 19
2.1.4 Underlying similarities between user behaviors . . . 22
2.1.5 Application of user similarities in foreseeing user locations and movements . . . 24
2.1.6 Aggregated behaviors . . . 26
2.1.7 Content Popularity as an illustrative example of users’ aggregated behaviors . . . 26
2.1.8 Time dependency of the user behaviors . . . 28
2.1.9 Social ties between users . . . 30
2.1.10 Social mobility models . . . 30
2.1.12 Factors used in EPM . . . 34
2.1.13 Factors used in the proposed combination method . . . 36
2.2 Popularity prediction: A use-case for EPM . . . 37
2.2.1 Content popularity prediction models . . . 37
2.2.2 Types of web content . . . 38
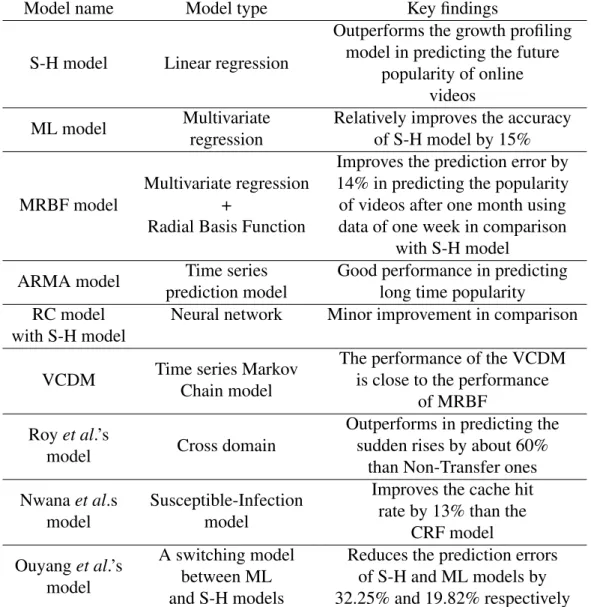
2.2.3 Online video popularity prediction models . . . 40
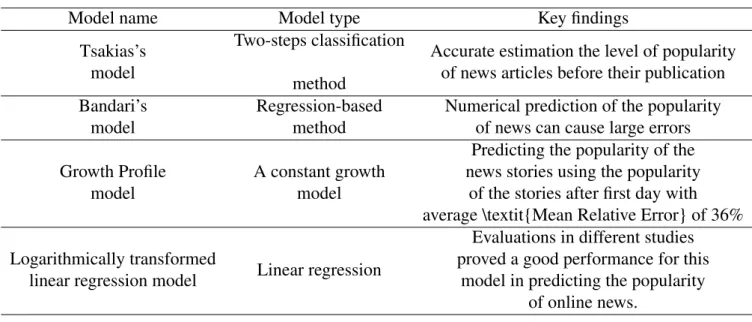
2.2.4 Online news . . . 46
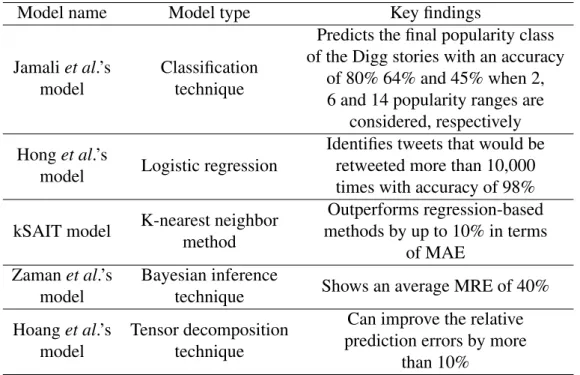
2.2.5 Content published in the online social networks . . . 48
2.3 Techniques to treat Small Sample Size problem . . . 50
2.3.1 Minimum requirements for the size of a sample . . . 51
2.3.2 Feature selection techniques . . . 52
2.3.3 Proposing new modified formulas for statistics estimation to reduce the error caused by SSS . . . 54
2.4 Summary and discussion . . . 57
3 Event Profiling Method 59 3.1 Methodology of EPM . . . 61
3.1.1 Ordered steps of EPM . . . 62
3.1.2 EPM versus individual user prediction methods . . . 66
3.2 EPM in wireless communication networks . . . 67
3.3 Content popularity prediction as an illustrative use-case for EPM . . . 69
3.4 Summary and discussion . . . 70
4 Impact of EPM on the performance of video popularity prediction models 73 4.1 Model justification . . . 77
4.2 Overview of the proposed approach . . . 79
4.3 Grouping users based on their interests . . . 82
4.3.1 Existing entropy-based grouping techniques . . . 82
4.3.2 Our proposed grouping technique . . . 83
4.4 The proposed content classification technique . . . 85
4.5 The proposed dominant-follower identification technique . . . 90
4.6 Training model parameters as a function of user groups, subgroups and popularity classes . . . 91
4.6.1 Enhancing Szabo-Huberman model . . . 92
4.6.2 Enhancing Multivariate Linear (ML) model . . . 94
4.6.3 Enhancing MRBF model . . . 95
4.7.1 Dataset . . . 98
4.7.2 User groups . . . 99
4.7.3 Content popularity classes . . . 101
4.7.4 5-fold cross validation results . . . 101
4.7.5 Discussion . . . 102
4.7.6 Improvements in terms of cumulative error . . . 106
4.8 Summary and discussion . . . 108
5 A combinational technique to improve users’ profile 109 5.1 The combinational model design . . . 110
5.2 The implementation . . . 112
5.3 The proposed combination method . . . 113
5.3.1 Notations . . . 113
5.3.2 Mathematical formulation of the proposed method . . . 113
5.3.3 The proposed combination method for biased samples . . . 117
5.4 Evaluation results . . . 118
5.4.1 Evaluation by synthetic data . . . 118
5.4.2 Evaluation by real-world data . . . 121
5.5 Impacts and limitations of the proposed technique . . . 122
5.6 Summary and discussion . . . 123
6 Conclusions 125 6.1 Key achievements . . . 125
6.2 Implications to improve Potential Applications of V-PPM . . . 127
6.3 Future steps . . . 129
6.4 Publications . . . 133
References 135
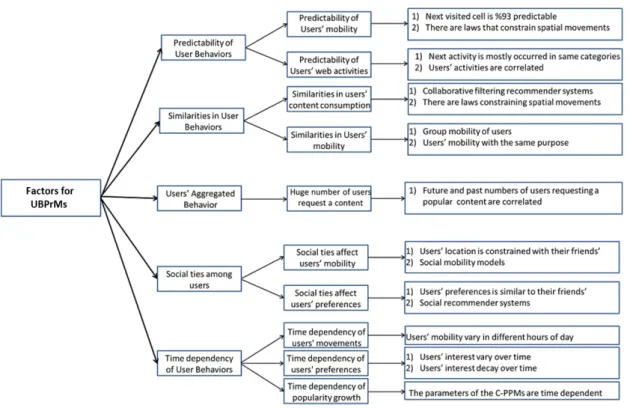
2.1 Factors that are useful for building a UBPrM . . . 35
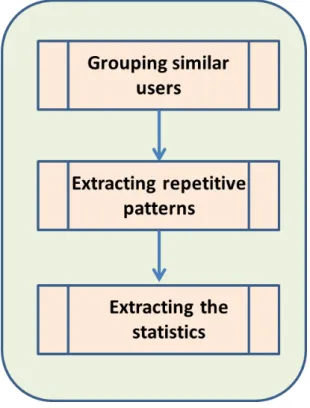
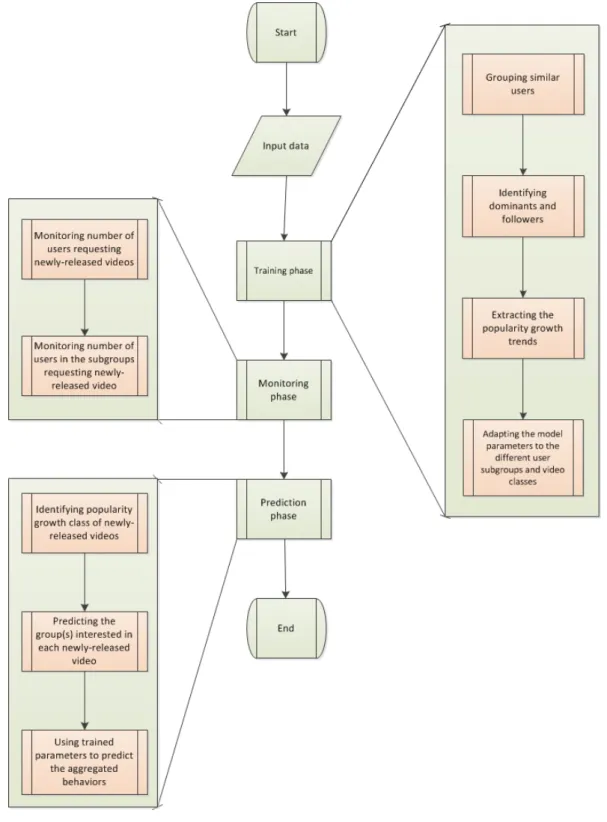
3.1 Training phase . . . 64
3.2 Monitoring phase . . . 65
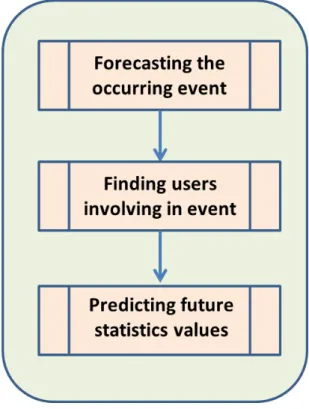
3.3 Prediction phase . . . 66
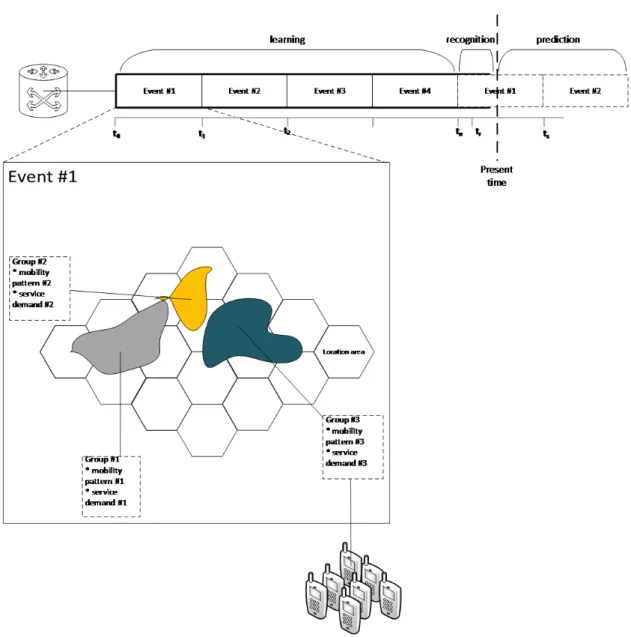
3.4 EPM in wireless networks . . . 69
4.1 Overview of the proposed approach for improving the V-PPMs . . . 76
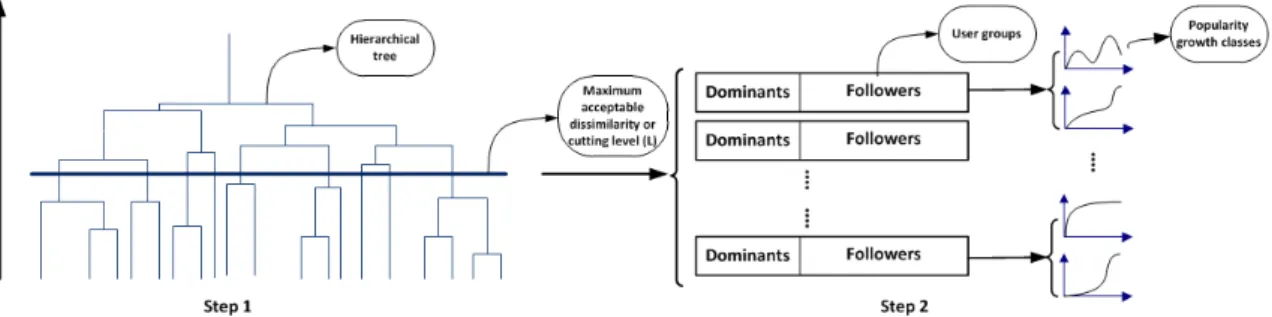
4.2 Different steps of the proposed approach for predicting the popularity of the released videos . . . 81
4.3 Angles between representer vectors of different groups . . . 100
4.4 Box plot ofRSEs of predictions . . . 104
4.5 Box plot of RSE ratios of all the predictions . . . 105
4.6 Accumulated miss-predicted requests . . . 107
5.1 Combining two biased variables . . . 111
5.2 Graphs representing PoIs of normal variables . . . 120
2.1 Online video popularity prediction models . . . 45
2.2 Online news popularity prediction models . . . 48
2.3 Popularity prediction models for predicting the popularity of online contents in SNs . . . 50
4.1 Groups’ characteristics . . . 101
4.2 Relative improvements in terms of median . . . 103
4.3 Mean relative improvements . . . 106
5.1 Notations and Symbols . . . 113
5.2 The range of the values of simulation parameters for normal distribution . . 119
5.3 The range of the values of simulation parameters for binary distribution . . 120
A.1 The impact of the data cleaning process on the performance of SH and ML models in terms of median . . . 152
Acronyms / Abbreviations
ABC Approximate Bayesian Computation
C-PPM Content Popularity Prediction Model
CF Collaborative Filtering
EPM Event Profiling Method
GeSoMo General Mobility Model
HCMM Home Cell Mobility Model
kSAIT Top-k Similar Author-Identical historic Tweets
MAE Mean of Absolute Error
MAP Maximum a Posteriori
MER Mean of Error Ratios
ML model Multivariate Linear model
MRBF Multivariate Radial Basis Function
MRE Mean Relative Error
MRSE Mean Relative Square Error
NC mobility model Nomadic Community mobility model
NTT-FGM Noise Tolerant Time-varying Factor Graph Model
PCA Principal Component Analysis
POF Post-Filtering
POI Point Of Interest
PoI Percentage of Improvement
PRF Pre-filtering
PSMM Periodic Social Mobility Model
RBF Radial Basis Function
RC Reservoir Computing
RE Relative Error
RPGM Reference Point Group Mobility Model
R Representer vector
RSE Relative Square Error
RS Recommender Systems
RV Request Vector
S-H model Szabo-Huberman model
SaE Sampling Error
SE Standard Error
SI model Susceptible Infectious model
SN Social Network
SRFRM Social Regulatory Factor Model
SR Social Recommender
SSS Small Sample Size problem
SVM Support Vector Machine
TD Time Decay
UBPrM User Behavior Prediction Model
UGC User Generated Content
V-PPM Video Popularity Prediction model
Introduction
In the recent years, the number of telecommunication network users has experienced an expo-nential growth and this has led to a significant growth in the demand for telecommunication network services. For instance, the Cisco report has predicted that the mobile traffic that users need will experience an increase by 700% from 2016 to 2021 [1].
As the result, one of the most important challenges in front of the next generation of mobile networks is to manage the above-mentioned ever-growing demand. To address this challenge, different solutions have been proposed in the literature. Cognitive networks [2–4] and Software Defined Networking (SDN) [5–7] are two well-studied examples of the proposed solutions. Despite the power of such solutions, they do not completely consider the amount of the predictability of the next state of the network; so, they may not be able to accurately estimate the next state and rely more on optimizing the network based on current state. As a result, they may react to an emerging state of the network with some inaccuracy. This can negatively affect the network performance and managing this is important especially when the future state of the network drastically vary with the current state. To treat this problem, researchers’ attempts have focused on proposing solutions that somewhat consider future state of the network. In doing so, they have searched for major components that explains the changes in the state of the network.
One of the major components of the telecommunication networks that affects the (future) state of the network is how users interact with network. In this realm, all the persons that utilize the telecommunication networks for any particular purpose are considered as the users of the network. As the result, predicting the future behavior of users has been proposed as an effective way to predict the future state of cellular networks. The user behaviors are defined as all the actions that the users of a network perform when they are using the network. For example, for the specific case of cellular networks, the set of user behaviors contains the
spacial movements (which determines the location) of the users, and services , e.g. calls and texts, that the users demand.
The predicted future state of network can be utilized by optimization and management processes to optimize the performance of cellular networks and efficiently allocate the network resources to the appropriate services. The performance of the described optimization and management processes is directly dependent on the accuracy of estimating the future state of network; and since the state of network is affected by user behaviors, the performance of the mentioned processes directly depends on how accurate we can foresee the future behavior of users.
The above-described task of predicting the users’ future behaviors is accomplished by User Behaviors Prediction Models (UBPrMs). Any UBPrM can be considered under the umbrella term of predictive profiling. To be more precise, we define the procedure of extracting the underlying patterns, including similarities or underlying patterns, existing in user behaviors as user profiling. When the extracted patterns are utilized to predict the next behavior of users, the procedure is called predictive profiling.
The discussed dependency between the accuracy of the employed UBPrM and the performance of the network optimization process has led to a great demand for more accurate UBPrMs and searching for the factors that affect the accuracy of a UBPrM. The accuracy of a UBPrM is affected by two major sources of error, includingModeling Error(ME) and
Sampling Error(SaE). In the next section, we discuss these two error sources that have negative impact on the accuracy of a UBPrM.
1.1
Error sources affecting the accuracy of UBPrMs
The field of user behaviors analytics and modeling contains a wide range of models and techniques. Mobility prediction [8], recommender systems [9], users’ activity recognition [10] or activity tracking [11] are some of the most well-known models in this field. As the ultimate goal, these studies aim to develop and propose more accurate models and algorithms.
As mentioned earlier, there are two different error sources that may affect the performance of a model or algorithm developed for modeling user behaviors. The sources include the
Model Error(ME) and theSampling Error(SaE). In [12], a complete mathematical discussion on these sources of error can be found. In what follows, we separately discuss each source of error.
• Model Error: The ME is the direct result of the lack of fitness of a model to the actual behavior of the existing variables. This error can be decreased by proposing a more
precise mathematical model that considers more complete set of factors that affect the behavior of the parameters of a model. The factors enable the model to better capture the actual exiting patterns in the behavior of the parameters.
The above factors are mostly the same for different user behaviors. For illustration, the behavior of a user can be constrained by the behavior of the other users who are in the social relationship with the target user (e.g. social mobility models [13, 14] and social recommender systems [15, 16] benefit from this idea to improve their results). However, the impact of each factor can differ from one behavior to another one. Therefore, the first complexity to diminish theMEis to find the level of the impact of each factor on a specific user behavior that is to be modeled by a UBPrM.
On the other hand, there are various techniques to equip a UBPrM with the above factors. For example, researchers have proposed different techniques to utilize the social ties of users or the similarities between user behaviors in their proposed UBPrM. Due to the variety of the existing techniques, finding the most suitable technique for integrating each factor into a UBPrM is the other complexity in front of alleviating
ME.
• Sampling Error:TheSaEis the result of the limited number of the available samples for a variable in a dataset. The reason behind this error can be explained byCentral Limit theorem. According to this theorem, the sample size can affect the accuracy of the estimation of the actual value of a variable. When we are estimating the mean of a variable, theSampling Error, which also is calledStandard Error(SE), is directly proportional to theStandard Deviationof the sample and inversely proportional to the square root of the size of the sample.
In the literature, the problem resulted from the effect of limited number of samples on the performance of a model is called as the Small Sample Size (SSS) problem. Researchers have proposed a number of different solutions to treat the SSS problem. Three of the important ones arefeature selection techniques[17–19],providing a set of minimum requirements for the size of a sample[20–22] and proposing modified formulas for finding statistics to reduce the error caused by SSS[23–26]. Principal Component Analysis(PCA) [27] and Linear Discriminant Analysis(LDA) [28] are examples of feature selection techniques. Mundfrom et al. [20] empirically studied the minimum necessary sample size and provided a set of requirements to determine it. Wan et al. [23] modified the mean formula by several terms that depend on the sample size, median and quartiles. Maximum a Posteriori(MAP) adaptation technique has
been proposed as another technique to modify the formulas of the statistical parameters [24].
While, in some occasions,SaE can cause a relatively large error in the performance of a predictive or classification model [29], most of the efforts in the field of the user behaviors analytics and modeling have focused on reducing theME. So, studying the
SaEand proposing a method to reduce it seems important for improving user behaviors modeling.
Increasing the number of the unbiased samples can be considered as a straightforward solution to reduce theSaE; but, it is sometimes impossible that we increase the number of unbiased samples of user behaviors. Considering this, one of the main objectives of this thesis is to study the negative impact of SSS problem on the performance of UBPrMs and proposing a solution to alleviate its negative impact. To do this, this thesis considers to answer the research question whether there is any situation in which we can add information extracted from the samples about other users’ behavior to the samples of a specific user’s behavior to obtain more accurate profile for the target user.
Apart from the accuracy of a UBPrM, the computational efficiency of a UBPrM is crucial for telecommunication network optimization. The efficiency of a UBPrM depends on the prediction approach that the model has used. There are two distinct approaches used in the existing UBPrMs in the literature. The approaches include user-level and population-level prediction models. Each of the mentioned approaches have their own computational complexity and are suitable for a subset of applications in network and service management domain. In addition, they are differently affected by the above-discussed error sources. The next section first discusses the approaches that have been employed in existing UBPrMs. After that, we compare the mentioned approaches in terms of their major error source and computational complexity. Then, we discuss their main advantages and disadvantages in telecommunication network management domain.
1.2
Approaches used in the existing UBPrMs
In this section, we describe both user-level and population-level approaches and discuss their advantages and shortcomings in comparison with each other. We also provide a discussion on the impact of the afore-explained error sources on these approaches. Next, we shed light on the motivations of this research and their links to the mentioned shortcomings.
User-level modeling: The user-level predictive models contain all the UBPrMs that aim to model and predict the behavior of each individual user. Some of the individual UBPrMs
take a set of the behaviors of each individual user into consideration (e.g. item-based recommender systems [30]); and extract the existing underlying patterns in this set of user behaviors. while some others consider the behaviors of the similar users to each individual user as the extra input information in addition to the information about the behavior of individual users for the predictive model (e.g. collaborative filtering recommender systems [31, 32]). The extra information makes the history of individual users more accurate. We call the set of the user behaviors as the history of the users. The ultimate goal of the user-level prediction models is to extract the hidden patterns existing in the users’ history and utilize the extracted patterns to predict the next behaviors of users.
The user-level prediction models contain a wide range of studies. To name some of them, the existing mobility prediction models that aim to predict the next location of the individual users [33–35]; and users click-streams prediction models that aim to foresee the next web-page that users may be interested in or request [36–38] are two well-studied examples.
Population-level modeling: The population-level UBPrMs contains those predictive models that aim to predict the behavior of a population of users. Therefore, one of the statistics that this type of the predictive models have a focus on is to predict the number of users that are going to perform a particular behavior. Content popularity prediction models (C-PPMs) are the familiar examples of the population-level user behavior modeling [39–41]. There is a number of popularity prediction models that aim to predict the number of users who are going to request a video [42, 43] or a number of other models that attempt to forecast the number of users who are going to view an online news [44].
The above-discussed predictive approaches have advantages and disadvantages in compar-ison with each other. To clarify these advantages and disadvantages, we provide a comparcompar-ison between them in the following.
• The population-level approach has more number of applications in the domain of the telecommunication network resource management and allocation than the user-level approach. This is down to the point that during the time periods in which network receives a huge demand for a service, network resource management becomes more important and essential. The population-level predictive models are able to predict the mentioned time periods. To be more precise, the population-level models are designed to directly predict the time in which a relatively large number of users request a particular service.
• When there is enough historical data about users, the user-level prediction approach is able to capture more patterns that exist in the behavior of users than population-level
one. As the direct result, the user-level prediction models provides more accurate predictions. The accuracy of the population-level models directly depends on the level of the similarity between users. If all the users were completely similar, the accuracy of population-level approach would be equal to the accuracy of the user-level approach. However, since there is always dissimilarity in the behaviors of users, the predictions made by population-level approach usually are less accurate than user-level approach.
• Since the user-level prediction approach requires to separately process the data of the individual users to extract the patterns existing in the user behaviors, this approach is more computationally complex than the level approach. The population-level approach finds the hidden patterns existing in the behaviors of the population of all users; so, this approach needs to perform the process for each users once. As the result, this approach requires less computations when making its final predictions.
• The user-level prediction models provide more personalized results about users than the population-level ones; so, the results can be analyzed to extract information about the personal characteristics of users. The users’ personal characteristics can be utilized to personalize the services offered to the users.
• Since the user-level prediction approach needs to have enough historical data about each individual user, this approach is more sensitive to the SSS problem [12] than the population-level approach. The SSS problem occurs when there is not enough historical data about users and causes noise in the prediction results. For individual-level models, the input data is the profile of each individual user. On the contrary, for population-level models, the input is the collective profile of all users. The collective profile consists of the profile of all individual users. In collective profile, insufficient number of samples for an individual user may be compensated by samples of other users. As the result, the probability of confronting a situation in which the profile of a subset of individual users does not contain enough number of samples is greater than the probability of confronting a situation in which the collective profile contains insufficient number of samples.
• The error of the models with the population-level approach is resulted fromMEmore thanSaE; while, theSaEhas bigger contribution in the error of the models equipped with user-level approach. It does not mean thatSaE does not affect the performance of a population-level predictive model; while, it means that the performance of a user-level predictive models is more affected byME.
• In some occasions, users may not follow their everyday behavioral patterns. For instance, the behavior of users may change due to different emotions of users. The user-level prediction models are more sensitive to the occasional variations or anomalies in the user behaviors than population-level prediction models. This may cause some inaccuracies in the prediction results of the user-level prediction models.
1.3
Motivation
Considering the discussed points until now, a UBPrM needs to have a number of properties to be applicable in telecommunication network management. The properties can be listed as follows.
• The UBPrM ought to be able to make accurate predictions.
• The UBPrM ought to be able to predict the situations in which there is a huge demand for network services.
• The UBPrM ought to be able to make fast and efficient predictions.
The motivation of the present research is to develop a UBPrM that meets the above requirements. In other words, the goal of the present research is to develop and test an accurate and fast UBPrM that is able to predict the huge demands.
To respond to the demand for an accurate UBPrM, in this thesis, we search for the main sources of error that affect the accuracy of a UBPrM. In doing so, we first search for the factors that the user behaviours are correlated to. The factor can considerably reduce the ME. Considering the found factors, one may develop a novel method that results in a significant improvement in the prediction results in comparison with the current state-of-the-art models. As the other source of error, we need to study the impact of SaE on the accuracy of UBPrMs, To accurately predict the situations in which network confronts a huge volume of demand, we propose group-level prediction approach as a more accurate alternative for the population-level prediction models and a more computationally efficient alternative for the user-population-level prediction models. A group-level prediction approach can be defined as a prediction approach that aims to predict the behaviour of groups of users. The group-level prediction approach is also able to make fast predictions in comparison with user-level approach.
1.4
Research approach
• In order to make group-level prediction, this thesis proposes a general framework which is calledEvent Profiling Method(EPM). As indicated above, one of the sources of error that affects the performance of the population-level prediction models is dissimilarities between the behavior of different users. We propose that grouping users based on the similarities between their behaviors and finding the behavioral patterns in the group behaviors can improve the performance of the population-level prediction models. On the other hand, since each user group contains users with similar behaviors, the group behaviors can be considered as a good estimation for the behavior of the individ-ual users in that group. In this regard, the group-level approach provides quite accurate results but requires less computations in comparison with the user-level approach. To test and evaluate EPM, we choose video popularity prediction as a use-case for this approach. To do this, we utilize the proposed group-level prediction framework to develop a novel video popularity prediction model (V-PPM).
To accomplish the design of the video popularity prediction model based on the group-level prediction approach, we develop three novel techniques. The techniques include,
1. A method for enhancing the existing clustering techniques that finds the best number of user groups such that the predictability of the user groups is maximized. 2. A classification technique that classifies the contents based on the existing
under-lying patterns in the popularity growth trends.
3. An identification method that identifies those users who request a content earlier than other users in each user group.
The proposed group-level framework and the proposed V-PPM developed based on this framework have a wide range of applications in the network resource management, network optimization, content caching, content broadcasting and marketing industries. The applications are discussed in chapter 6.
• To reduce the noise resulted from the SSS problem in the prediction results of a UBPrM, we propose a novel combinational technique. According to the discussion presented in the previous section, the SSS problem affects the accuracy of a user-level predictive model more than a population-user-level one. As the result, although our proposed combinational technique can be used to improve the accuracy of all types of UBPrMs, it potentially results in greater improvements in the user-level UBPrMs. Due to this, in chapter 5, we evaluate the impact of the combinational technique on the accuracy of individual users’ profiles.
In brief, the combinational technique considers other users as the biased samples for each individual user. The technique benefits from two conditions. According to the conditions, the proposed technique decides about the profile of which users can be combined with a user to make the profile of that user more accurate and less noisy. This process is able to diminish the effect of SSS problem in the prediction results of a UBPrM. Since the SSS problem affects more on the performance of user-level prediction models, the impact of the combinational technique on the prediction results of user-level prediction models is more than this impact on the prediction results of the population-level ones. Nevertheless, the proposed combinational technique can be employed to improve the performance of the population-level prediction models, as well.
1.5
Contributions
Based on the discussed points in this chapter up to now, Our contributions in this thesis can be summarized as follows,
• We propose a general framework, called EPM, that can provide group-level prediction results. EPM can be used to enhance almost all population-level UBPrMs and is suitable to be used in all applications in the domain of network resource management and optimization.
• Using the EPM framework, we propose a novel approach to enhance the existing Video Popularity Prediction Models (V-PPMs). Regarding to this, this thesis has a number of contributions that are listed below.
– The approach contains three novel steps:
* We propose to group users based on their interest as an effective factor for predicting the group popularity of online videos. In doing so, we propose an unsupervised technique to determine the optimal number of user groups. The optimal number of user groups is determined such that the predictability of the user behaviors in the constructed groups is maximized.
* We propose to classify videos into the classes with similar popularity growth trends. For this purpose, we develop a novel content popularity classification technique that minimizes the mean and range of the prediction errors. * We propose to classify users based on their reaction time to the
identi-fication technique that finds the underlying patterns existing in the users’ reaction time to the newly-released videos.
– We elaborate on our approach and show how the user grouping, user identification and content classification techniques are used to enhance a popularity prediction model by considering the parameters of the popularity prediction model as a function of the user groups, user subgroups and popularity class number.
– We present an extensive evaluation to test the impact of the proposed approach on the performance of the state-of-the-art popularity prediction models.
• We propose a novel combinational technique that is able to treat the SSS problem in multi-dimensional datasets. The basic idea behind the combination method is that this method considers other variables as a biased estimation of each variable. We provide an extensive evaluation for the combination method through synthesized and real-world datasets. We also show that how our proposed combinational technique is able to improve a user-level predictive model.
1.6
Thesis structure
This thesis consists of 6 chapters. We initially provide an extensive state-of-the-art review. Within our literature review, we compare our proposed models with the exiting models and discuss the novelties of our models. Then, theEvent Profiling Method(EPM) is introduced as a framework for predicting the group behavior of users. EPM aims to find the factors affecting the performance of a group-level UBPrM and utilizes the factors to improve its performance. Next, we consider video popularity prediction as a use-case for EPM. Using the EPM framework, we develop a novel approach for predicting the future popularity of videos. After that, we focus on SSS problem and its contribution on the error of a UBPrM. To treat the SSS problem, we propose a combinational technique. Finally, we conclude this thesis in chapter 6. In the following, we provide more details on the contents of each chapter.
Chapter 2 Background and related works: This chapter is dedicated to discuss the related studies to our proposed models. By reviewing the existing predictive models for different kinds of user behaviors, we extract the factors that have impact on the behavior of different users. The components are introduced as factors that can be used by a UBPrM. Then, we discuss the connection between our proposed models and each factor.
After that, we review the existing content popularity prediction models. Through our review, we discuss the existing methods for different types of contents. We also discuss the novelties of our proposed approach in comparison with the existing models.
The last part of chapter 2 is dedicated to discuss the existing techniques in the literature to treat the SSS problem. A discussion on the novelties of our proposed combinational technique is also provided.
Chapter 3 Event Profiling Method: In chapter 3, EPM is proposed as a general frame-work for foreseeing the group behavior of users. EPM looks for more underlying patterns in the group behavior of users and exploits them to make more accurate predictions. This results in a reduction in theMEof UBPrM. Chapter 3 also discusses how the telecommunica-tion networks can take advantage of EPM. In the last part, we introduce content popularity prediction as a real-world use-case for EPM and explain how EPM can be utilized to develop a model for predicting content popularity.
Chapter 4 Impact of EPM on the performance of V-PPMs:In chapter 4, we employ EPM to develop a novel approach for predicting the popularity of online videos. In this chapter, we also explain the above-explained techniques that are essential parts of the proposed V-PPM. The techniques include
• A technique for finding the best number of clusters,
• A content classification technique for finding the popularity growth trend classes,
• A user identification technique for identifying those users who mostly request newly-released videos before others.
To test the performance of our proposed approach, we utilize a real-world dataset con-taining content requests of BBC-iPlayer. Through an extensive evaluation, we show the improvements that are resulted from our approaches in the prediction results of three well-known popularity prediction models.
Chapter 5 A combinational technique to improve users’ history: Chapter 5 focuses theSampling Error(SaE) as another important source of error in the final results of a UBPrM. It discusses how SSS problem can cause error in the performance of a UBPrM. Then, a combinational technique is proposed to alleviate the negative impact ofSaEon a model’s accuracy. Using both synthesized and real-world datasets, we evaluate the impact of the proposed combinational technique on the improving the estimated statistics of a dataset.
Chapter 6 Conclusions:Chapter 6 provides a complete summary of the research and discusses the limitations of our proposed models and future steps to extend the models and continue this research.
Background and related works
Researchers have utilized a wide range of approaches to efficiently predict the future be-haviours of users. The term of user behaviour can be defined as all the actions that a user does while interacting a system. Examples of actions of a user of the telecommunication networks include moving to different locations, making calls, messaging and connecting to the Internet. Similarly, examples of the actions of a user of the Internet include checking her e-mail and requesting different videos. Such actions are performed by users and considered as the behaviours of users. The approaches in developing more efficient User Behaviors Prediction Models (UBPrMs) can be categorized into two distinct categories. The categories include,
• Reducing the ME:In doing so, researchers have employed two approaches. The first approach aims to search for a set of factors that shape or explain the user behaviors. As the result, considering the factors has an impact on the performance of a UBPrM; and they can be utilized to develop more accurate models. Therefore, the initial step for developing a UBPrM is to search for a set of factors that influence the behavior of users. The factors may affect some particular user behaviours and may be observed in a number of studies; and so, we also call them as the proven observations affecting the particular user behaviours.
The second approach used by researchers is to develop new techniques that are more able to extract the underlying patterns in the user behaviors. The techniques are highly dependent on the specific behavior that is to be modeled by a UBPrM. One of the main objectives of this thesis is to propose a framework for predicting the aggregated behaviors of users. We define the aggregated behavior of users as the behaviors performed by a large number of users. The framework contains a number of novel techniques that enables us to capture more underlying patterns in the users’ aggregated
behaviors. To evaluate the proposed framework, we utilize the framework to develop a C-PPM.
• Reducing the SaE:To do this, researchers have proposed a wide range of different methods. The methods can be potentially employed to alleviate the SaE in the data sets containing user behaviors.
Inspired by the above discussion, our literature review is divided into three main sections that are listed in the following.
• Factors that can be employed as a starting point of any UBPrM:This section is dedicated to review and explain the main factors that are exploited by existing UBPrMs in the literature. The section also discusses how we have utilized the discussed factors to develop our novel UBPrM as well as our novel combination method to treat the SSS problem.
• Content popularity prediction models: The section provides a discussion on the main methods utilized in the existing Content Popularity Prediction Models (C-PPMs). In doing so, the section categorizes the existing UBPrMs into three categories. The categorization is performed based on three distinct types of online contents that include
online videos,online news andonline contents published on social networks (SNs). In addition, the section also discusses the novelties of our proposed video popularity prediction model in comparison with the existing works.
• Existing techniques to treat Small Sample Size problem: The third section dis-cusses the existing solutions in the literature to treat the Small Sample Size (SSS) problem. In the section, we present a discussion on the main novelties of our proposed combination method in comparison with the existing methods in the literature.
2.1
Factors affecting UBPrMs
Similar to any other theory or model, a UBPrM lays its foundation on a number of factors. The factors are considered as the starting point of the model; and as the result, the validity of the model is entangled with how truely the factors have been found. Moreover, since well-selected set of factors has a significant impact on the performance of a UBPrM, the initial step of developing a UBPrM is to search for the most complete set of factors.
According to the above, we start our state-of-the-art review with a discussion on the factors that are employed by existing UBPrMs or observed in different studies. Within the
discussion, we present evidences to support each factor by discussing the improvements resulted from considering the factor in different UBPrMs. Finally, we summarize the factors that we have used in our proposed models, which are the group-level prediction model and the combination method.
The scientifically observed factors that are used in the literature for modeling user behaviors can be listed as follows.
• The user behaviors are predictable: The most basic factor behind all the UBPrMs is that there are underlying repetitive patterns in the behaviors of users. The repetitive patterns make the behavior of users predictable. The more repetitive patterns in the user behaviors, the more predictable user behaviors. To develop a predictive model, one needs to extract such repetitive patterns and utilize them to foresee the future behaviors of users.
• There are underlying similarities in the behaviors of users: Recent studies have proved that there are groups of users that perform quite similar behaviors. For instance, users may move in groups with similar mobility patterns [14, 45] or have similar video interest [46, 15].
Considering the above-discussed similarities, a UBPrM can monitor the behavior of users who are similar to a specific user to obtain extra information about her. The proposed models in this thesis both take the similarities between users into considera-tion. The proposed group-level prediction model utilizes the similarities to foresee the future aggregated behaviors of users. The proposed combination technique uses the similarities to obtain more historical data about each user.
• Sometimes a group of users show an aggregated behavior: The previous factor stated that there are groups of users that have similar behaviors. Therefore, the user groups most of the time show similar behaviors in different occasions. In some occasions, it is possible that the described user groups show a similar behavior in a quite short time interval. We previously defined this kind of user behaviors as the aggregated behaviors of users. Familiar examples of users’ aggregated behaviors are crowd movements of users (e.g. see [47]) or requesting a specific video by a large number of users (e.g. see [48, 49]).
According to the above, we propose that there are some situations in which user groups perform aggregated behaviors. Our group-level prediction model considers the mentioned factor to propose a novel technique for predicting the aggregated behaviors of users.
• The social ties between users constrain their behaviors: Recent studies have pro-posed the social ties between users as one of the important factors that has a significant impact on their behaviors. To be more specific, the behavior of a user is often in-fluenced by those users who are in the social network of the user. As a result, any UBPrM needs to take the social ties as a factor that constrains the user behaviors into consideration1.
• The user behaviors are time dependent:The behaviors of users may vary in different times and different occasions. For illustration, a user’s search activities in the day hours may be different from her activities in the nights. As a result of this, every UBPrM needs to take the time dependency of users into consideration.
In the rest of this section, we provide supportive evidences from different studies to justify the trueness of the above-discussed factors. In doing so, we review the models that have utilized these factors to improve the accuracy of their predictions about the future behaviors of users. In brief, to support the predictability of user behaviors, we provide the results of a number of studies that show that the behaviors of users are highly repetitive and predictable. Next, we discuss the existing similarities in the user behaviors and how existing UBPrMs benefit from these similarities. After that, we review the studies that focus on the impact of considering social ties on the performance of UBPrMs. Next, we discuss a number of works that justify the time dependencies of the user behaviors. Finally, we discuss how our proposed models in this thesis benefit from the discussed factors.
2.1.1
Predictability of user behaviors
In spite of all variations in the user behaviors [50, 51], their behaviors show repetitive and periodic patterns. Recent studies have observed periodic patterns in the users’ mobility [52, 53] or their search activities [54, 55]. Observing many behavioral patterns that periodically repeat in the user behaviors indicates that the behaviors are highly predictable. Any UBPrM aims to extract the mentioned periodic patterns and employ them to propose a number of factors that govern the user behaviors.
To find the underlying patterns in the user behaviors, researchers’ attempts can be categorized into two different approaches. The approaches are,
• Studying the statistical properties of the user behaviors: In this approach, re-searchers analyze and calculate the statistics of the user behaviors and sometimes,
1Due to the privacy concerns, access to real-world datasets containing social context of users is difficult.
their attempts have focused on finding the probability distribution that is best fitted to these statistics. For illustration, it has been shown that the popularity of online videos approximately follows a power-law distribution [56]; or the distribution of jump2size obeys a power-law distribution modified by an exponential cutoff [57]. The existence of such distributions suggests that the user behaviors are not completely random and can be constrained by a set of underlying factors. Extracting the underlying factors is the objective of the second approach.
• Searching for a set of factors that have impact on the behavior of users: In this approach, researchers attempt to find a set of factors that constrain the behaviors of users. Examples of such factors include
– Users tend to move in groups [14],
– Users’ interest tend to be similar to the interests of users that are in social relationships with them. [58].
The existence of the above factors on the one side constrains the user behaviors and on the other side shows a relatively high level of predictability for user behaviors.
In what follows, we review main studies that utilize the above-mentioned approaches to study the level of the predictability of different types of the user behaviors.
2.1.2
Predictability of the user spacial movements
• Statistical analysis: The statistical analysis of the users’ movements prove a high degree of predictability in their mobility. As a good supportive evidence, studying the entropy of the users’ mobility patterns of 50,000 users in macro cell scale, Song
et al. [59] showed that the next cell that the users will go to is 93% predictable. The authors also proved that there is not any clear differences between various genders or age groups as well as working days and weekends.
In another study, Choet al. [53] performed an extensive analysis to find statistical properties of users’ mobility. They showed that social relationships cause 10 to 30% of the users’ movements and regular patterns in people’s movements can explain 50 to 70% of people’s movements. The authors also investigated what percentage of user movements are for the purpose of meeting a friend. They found that this depends
2Jumps in users’ movements are those movements that are relatively longer than the usual movements. To
illustrate this, users’ long trips are considered as jumps that are relatively longer than commuting from home to work.
on the length of the users’ travels and the probability of a movement for meeting a friend is 2.5 times greater than meeting a new person. In addition, they studied users’ movement periodicity and showed that users often commute between home and work sites.
As a quite different approach to study the statistical analysis of the users’ mobility, researchers have also focused on finding the probability distributions that well explain the statistical characteristics of user movements. Studies show that the displacements of users can be well approximated by a power-law distribution truncated by an exponential cut-off [57, 60, 61].
The most significant indication of the above findings is that the users’ mobility does not follow a completely random (uniform) distribution; so, there should be a number of underlying factors that constrain their mobility.
• Proposing a number of factors that limits user movements: Recent studies show that the users’ spatial movements can be explained by a number of factors. The factors can be summarized as follows.
1. Users mostly prefer to move in the short paths [62].
2. The next locations to be visited by users are correlated to their previously visited locations [63, 64].
3. There are places that are frequently visited by users [65, 45]. The places are called users’ locations or points of interest.
4. Users move in the groups [66–68].
5. The mobility and location of a user are constrained by the mobilities and locations of the users that are in social relationship with the user [53, 14, 69].
6. Users are attracted to each other based on their social relationship strength [70, 53, 14].
Each of the above-listed factors has their own impact on the movements of users; and as the result, any user mobility prediction model ought to consider these factors to make relatively accurate estimations about the next locations of users.
However, the recently-proposed mobility prediction models mostly consider a subset of (not all of) the above factors. In what follows, we introduce the well-known mobility models that consider all or a number of the above factors.
1. Users’ movements are correlated to their previous locations 2. Users return preferentially to their formerly visited places
HMM[69]: HMM is a mobility model that considers the location of a user’s friends as a factor that limits the destination of the user (Hermann’s model [71] is another model that utilizes this factor to propose a more accurate mobility model).
Home Cell Mobility Model (HCMM)[62]: HCMM takes three of the above-listed factors, including short path preferences, social and location attractions into consid-eration. The HCMM model completes an old version called CMM [13] which just assumes that people’s destination are only determined by social attraction.
General Social Mobility (GeSoMo) model[14]: GeSoMo is a mobility model that considers more complete set of the realistic properties of users’ movements than the above-presented mobility models. The properties considered by GeSoMo model can be listed as,
1. Users are attracted to each other based on their social relationship strength. 2. Different anchor points have different attracting powers to different users. 3. Users prefer to move in groups.
4. Sometimes, users prefer to move to a location with less population.
All the above-introduced studies perform a simulation-based analysis to evaluate their proposed mobility model and show that considering the above factors is able to better model the statistical characteristics of users’ spatial movements. For example in [63], the authors benchmarked their model against a real-world dataset consisting cell tower records of mobile phone users and showed that the simulation results of their model agrees with real statistical properties of the user movements. The success of these models is a result of considering realistic factors for describing users’ mobilities. According to the above, one can conclude that there is a quite high level of predictabil-ity in the users’ movements. This conclusion is resulted from observing the above governing factors in the mobility of users.
2.1.3
Predictability of the users’ activities in World Wide Web
At the following, we review some models that exploit the history of users’ activities in World Wide Web (WWW) to extract the repetitive patterns in their activities. The history of users contains all the searches and requests of a user and her location and time in which she does
her search. Through our review, we also discuss how the findings of the presented studies can be considered as supportive evidences for the predictability of the user activities in WWW.
• Statistical analysis: In the literature, various aspects of the statistical properties of user activities in the WWW have been studied. The common initial step for this analysis is to categorize the activities into a number of classes.
To categorize the activities, Kumaret al. [72] classified the user activities in WWW into three main classes includingcontent(e.g. news or videos),communication(e.g. email or forums) andsearch(main search or item search).
Statistical analysis of the above classes shows that more than 50% of the user activities belongs to content category [72]. Moreover, on average about 81% of the web-pages that a user visits have been visited at least once before and most of the users visit two web-pages more often than other pages [73]. The purpose of more than 60% of the activities is to go to a specific web-page; while purpose of 25% of the activities is to access to a specific data, e.g. weather related measurements, from any web-page [74]. Some other studies have limited their analysis to analyzing the statistics of the activities of users in Social Networks (SNs). As a generic result, it has been shown that the users’ activities in SNs increases in the middle of day; however, users do not continuously interact with their SNs in the long log-in periods (i.e. more than 30 mins) [75]. Similar to the above-mentioned studies, the studies on the user activities in the SNs also categorized the activities into a number of categories [52, 75].
As an illustrative example, Benevenutoet al. [52] introduced 9 categories of customary behaviors of users, namely Universal search, Scrapbook, Messages, Testimonials, Videos, Photos, Profile & Friends, Communities and Others (e.g. account log in). Firstly, Benevenutoet al. studied the session length, inter request time distribution and inter session time. The authors showed that power-law distribution is well-fitted to the aforementioned time distributions. The authors also investigated the statistics of the sequential activities that are performed within and between categories. Their findings showed that 77% of transitions from one activity to another one happen within similar categories (which is in agreement with the findings of [75]). Schneideret al. [75] proved the existence of the repetitive activity sequences in the interaction of users with SNs.
The above-presented findings show that there exist a number of underlying patterns that frequently repeat in the users’ activities in the WWW.
• Proposing a number of factors that limits user activities in WWW:To predict the user activities in WWW, some models benefit from a set of basic factors that are able to explain the reasons behind of performing those activities by users. In what follows, we discuss some of the well-known factors employed by existing works.
1. Graph theory provides a mathematical tool to represent and model the ac-tivities of users in WWW and SNs. Graph theory based models has been proposed as a powerful tool to represent and model the connections between users and correlations between their activities in WWW, particularly in SNs. To do this, researchers have employed two types of methods, namelyundirected graphsanddirected graphs[76].
The first method makes an edge without specifying any direction between two users; e.g. when there is a friendship [77] between them. While the second one considers a directed edge to show a social interaction in SNs between two users. For example, visiting the webpage of user 1 by user 2 is considered as an interaction between them; and to represent the interaction, an edge with direction from user 2 to user 1 is constructed between them.
For illustration, Wilsonet al. [78] used undirected graph to construct a social graph between users. The authors examined whether social links in users’ SNs can be considered as a sign of interaction amongst users. Considering wall posts and photo comments as a indicative sign for social interactions, the authors found that users have interaction with only a small group of their friends.
Jianget al. utilized the directed graph method to model the main graph theoretical characteristics, e.g. average path length that connects two users and social degree distribution, of SNs’ users. The authors considered visiting a user’s profile by another one as an indicator for an interaction between users. The interactions determine a directed edge in the constructed social graph.
Ghoshet al. [79] considered a bipartite graph theory model to represent and model the evolution of inter-group relationships and spreading information amongst users in different groups. They defined two different sets. One set consists of popular social networks and the other set contains the users of the social networks. Directed edges are created between a user and the social networks in which the user is a member.
2. There is a correlation between the future activities of users to their previous activities as well as their acquaintances’ activities:As the first example of the models that utilize the mentioned consideration, Raghavanet al. [55] proposed a
model that take advantage of a first order Markov model to correlate the future activity of users to their previous behaviors and the current behaviors of the users. The authors used a dataset collected from Tweeter to test their model. Their results show that their proposed model is able to well describe the statistical properties of inter-tweet durations.
As the second example, Tanet al. [80] presented a “noise tolerant time-varying factor graph model” (NTT-FGM) that is able to model and predict users’ next activities in SNs. The NTT-FGM model is a graph theory based model that corre-lates each user’s activity to the attributes of the user and her previous activities as well as other users’ current and previous activities. Tanet al. evaluated the performance of their proposed model in predicting the future activities of users. The findings reported in [80] show that NTT-FGM outperforms weighted-vote relational neighbor (wvRN) and SVM-light models.
As the last example, using the impact of a user’s activity on the activity of other users (i.e. correlation between), Trusovet al. [81] developed and empirically tested a solution to identify active users. Active users are defined as the set of those who keep a social network attractive and have impact on other users’ activities. More specifically, the authors investigated whether increase or decrease in the active time of a user can cause changes in the time period of others’ activity or not. Results in [81] show that the proposed model is able to identify active users with accuracy of 92%.
In this section, we discussed the degree of predictability of the user behaviors by consid-ering both their statistical properties and underlying factors governing their behaviors. In doing so, we utilized two familiar examples, which are users’ mobility and user activities in WWW. Since these examples cover relatively a big subset of user behaviors, the observed predictability can be generalized to other kinds of the behaviors performed by users.
2.1.4
Underlying similarities between user behaviors
Recent studies have shown that there are groups of users that behave similarly in different situations [82]. For illustration, there are groups of users who have similar visited locations [45, 83], content preferences [84, 85], music taste [86], interactive behaviors [87] and so on.
Knowing the current behaviors of the users who have previously performed behaviors similar to the behaviors of a specific user, one may increase the probability of guessing the next behavior of the specific user.
Such information can be utilized as the extra input data for a UBPrM to improve the accuracy of the predictions made about user behaviors. For instance, the similarities between users can be used to better estimate the preferences [32] and next locations [57] of users. In what follows, we review a number of studies that take the similarities between users into consideration to improve the performance of their proposed models.
Application of user similarities in estimating user preferences
Recommender systems are the most well-known predictive models that aim to estimate the preferences of users. To do this task, most of recommender systems utilize Collaborative Filtering (CF) technique. The CF-based techniques predict desirable items for a specific user by looking at the consumed items by other users that have an analogous taste to the target user. More specifically, the CF-based techniques employ the similarities between ratings given by the users to different items to identify the users with analogous taste. Then, the techniques estimate a user’s rating for an item by using the ratings of similar users to the target user.
The CF-based methods can be classified into two types, including model-based and history-based [9].
Using the history of the selected or consumed items by users in the past, the history-based CF methods first find a set of users with similar taste for each individual user. After that, they estimate the ratings of each user to the unrated items by direct aggregation of the ratings of similar users to the items. The history-based models utilize various techniques to aggregate the ratings.
The model-based methods first construct a user-item ranking matrix and use this matrix to measure the similarity between users based on a similarity metric. Euclidean (EUC) [88], Pearson Correlation [31], Cosine [89] and Spearman Rank Correlation [90] are some well-known examples of the metrics that are used to measure the similarity between users.
After finding the similarities between users, the model-based CF methods fit a mathemat-ical formula or model to relate the ratings of the users to each others. These methods usually define a set of latent parameters and use them to correlate the ratings of similar users to each other. They attempt to capture latent characteristics and dependencies between different users’ ratings for items.
Matrix Factorization [91, 92] and random walk based methods [93] are two of the most famous model-based CF recommender systems. The mentioned methods aim to find a
function that gets the user-item matrix3as input and generates the unknown rating values for each user.
Recently developed recommender systems utilize a sociological fact mentioning that people who are in a social relationships are more similar than those who are not in a relationship. This fact is used to better estimate the similarities between them [94, 15]. We call the similarity that is calculated by using the social relationships of users as social similarity and the recommender systems that utilize the social similarity as social recommender systems.
The social similarity based methods impose a condition on the ratings (or preferences) of users that are in the same social group to have close ratings to each other [95]. The same as before, the approaches used in the social recommender systems can be classified into history and model based approaches.
SR1 [96], SR2 [96] and SoRec [97] are three model-based recommender systems that take the social similarity into consideration. The evaluation of these three models shows that all of them outperform the item-based recommender systems that do not consider the similarity between users.
In addition to the above, TidalTrust [98], MoleTrust [99] and Trustwalker [100] are three well-known history-based models that utilize social similarities to improve their recommen-dations. The mentioned models use a trust matrix to determine the correlation between the users’ ratings. Using the trust matrix, each model finds a set of trustable neighbors for each user. TidalTrust, MoleTrust and Trustwalker models estimate the unknown ratings of the users by looking at the set of their trustable users. Considering the social similarities between users enables the TidalTrust, MoleTrust and Trustwalker models better estimate the user ratings to items than item-based recommender systems [91].
2.1.5
Application of user similarities in foreseeing user locations and
movements
One of the well-studied aspects of the user movements, which is discussed in the present section, is that there exist similarities in the mobility patterns of users. For illustration, there are groups of users that move together (e.g. [67, 101, 102]) or have a common "location of interest" [103].
Considering the common mobility paths or destinations, researchers have proposed a number of group mobility models in which individuals follow quite similar paths or go to the same destinations. It has been shown that the group mobility models are more able to capture the realistic properties of user movements, particularly in the situations in which there is a
correlation between the decisions of users about their next locations [104]. In what follows, we review some of the well-known group mobility models.
• Nomadic community mobility model (NC) [105]: In the NC model, users, which are considered as mobile nodes, tend to move together and follow similar paths. The model is suitable for the mobility of people in a conference or mobility of a number of students visiting a museum.
• Pursue mobility model [105]: This model mimics the situations in which several nodes (persons) track a specific node (person) to capture her. In this case, the nodes have the same purpose or destinations for their movements.
• Reference point group mobility model (RPGM) [106]: In RPGM model, users initially are assigned to a number of groups; next, a leader or logical center is selected for the constructed user groups. The logical center determines the paths that the center of her group should move on. Other individuals in that group move randomly around the center of group. Both movements of the center of the user groups and individuals in each group are implemented via the Random Waypoint Mobility Model [107].
• Community based mobility model [101]: This model divides nodes into friend and non-friend communities and utilizes a probability distribution of nodes’ which considers social relationships amongst them. The nodes need to have social interactions with their friend community. To capture the social interactions, the model utilize an interaction matrix. The social interactions impose users to select the paths that are more probable to meet their friends.
• A general social mobility (GeSoMo) model [14]: The GeSoMo model considers group movements and social attraction as the main factors affecting human mobilities. The model determines certain locations calledanchor pointswhere nodes can have the social interaction with others. The anchor points causes a social attraction to the users. The direct result of this is that GeSoMo forces users to move in groups and have quite similar destinations.
All the above-presented models better estimate the statistical characteristics of the user movements. It can be concluded that observing better performance in estimating the statistics of the users’ movement is a result of considering similarities in either the users’ paths and destinations.