DOI: 10.1093/jxb/erg262
REVIEW ARTICLE: FIELD TECHNIQUES
Gas exchange measurements, what can they tell us about
the underlying limitations to photosynthesis? Procedures
and sources of error
S. P. Long1,* and C. J. Bernacchi2
1Departments of Crop Sciences and Plant Biology, University of Illinois at Urbana-Champaign, 379 Edward R Madigan Laboratory, Urbana, IL 61801, USA
2USDA-ARS, ERML 190, 1201 W Gregory Dr, Urbana, IL 61801, USA Received 1 May 2003; Accepted 10 July 2003
Abstract
The principles, equipment and procedures for meas-uring leaf and canopy gas exchange have been described previously as has chlorophyll ¯uores-cence. Simultaneous measurement of the responses of leaf gas exchange and modulated chlorophyll ¯uorescence to light and CO2concentration now
pro-vide a means to determine a wide range of key bio-chemical and biophysical limitations on photo-synthesis in vivo. Here the mathematical frameworks and practical procedures for determining these par-ametersin vivoare consolidated. Leaf CO2uptake (A)
versus intercellular CO2 concentration (Ci) curves
may now be routinely obtained from commercial gas exchange systems. The potential pitfalls, and means to avoid these, are examined. Calculation of in vivo maximum rates of ribulose-1,5-bisphosphate (RuBP) carboxylase/oxygenase (Rubisco) carboxylation (Vc,max), electron transport driving regeneration of
RuBP (Jmax), and triose-phosphate utilization (VTPU)
are explained; these three parameters are now widely assumed to represent the major limitations to light-saturated photosynthesis. Precision in determining these in intact leaves is improved by the simultan-eous measurement of electron transport via modu-lated chlorophyll ¯uorescence. The A/Ci response
also provides a simple practical method for quantify-ing the limitation that stomata impose on CO2
assimi-lation. Determining the rate of photorespiratory release of oxygen (Rl) has previously only been
pos-sible by isotopic methods, now, by combining gas
exchange and ¯uorescence measurements, Rl may
be determined simply and routinely in the ®eld. The physical diffusion of CO2 from the intercellular air
space to the site of Rubisco in C3 leaves has long
been suspected of being a limitation on photosyn-thesis, but it has commonly been ignored because of the lack of a practical method for its determination. Again combining gas exchange and ¯uorescence provides a means to determine mesophyll conduc-tance. This method is described and provides insights into the magnitude and basis of this limita-tion.
Key words: Electron transport, ¯uorescence, mesophyll conductance, photorespiration, photosynthesis, Rubisco, stomata.
Introduction
Previously, the theory of infrared gas analysis, as used in plant physiology, and its incorporation into portable open gas-exchange systems for the measurement of leaf and canopy photosynthetic and water vapour exchange has been described. In this previous paper, the measurement of the maximum quantum yield of CO2 uptake and the construction and use of ®eld systems for measuring stand photosynthesis was also described (Longet al., 1996). At the time of the earlier paper a series of commercial, portable, open gas exchange systems with options for controlling CO2, humidity, temperature, and light had entered the market place (e.g. LI-6400, Li-Cor Inc.,
* To whom correspondence should be addressed. Fax: +1 217 244 7563. E-mail: [email protected] Abbreviations: for a list of abbreviations, see Appendix.
Lincoln, Nebraska, USA; CIRAS-II, PP Systems, Hitchin, UK; LCA4 ADC-Biosciences, Hoddesdon, UK). These off-the-shelf portable systems provide real-time measure-ments of CO2 uptake (A), transpiration (E), leaf con-ductance (gl), and the intercellular CO2mole fraction (Ci). The precision of measurement possible has meant that custom-built ®eld and laboratory systems have largely been replaced. Whereas 15 years ago many measurements would be made with systems constructed by their operator, today over 95% of measurements of photosynthetic CO2 uptake in ISI listed journals use commercial off-the-shelf systems (Long and HaÈllgren, 1993; Longet al., 1996). The ease of measurement, which allows the operator to obtain
A,E,gl, andCiat the push of a few buttons and without any prior experience, does have its pitfalls, as is shown later. In parallel with the development of portable gas exchange systems has been the development of further instrumen-tation that is greatly extending the ability to interpret the basis of change in CO2uptake in vivo. In particular, the further development of modulated chlorophyll ¯uorimetry, differential oxygen analysis and higher resolution infrared gas analysers suited for the measurement of non-steady-state changes in CO2 ¯uxes (Bloom et al., 2002; Laisk
et al., 2002; Maxwell and Johnson, 2000). This paper extends upon Long et al. (1996), focusing on the meas-urements now possible through combining gas exchange and ¯uorescence. It also highlights some of the pitfalls of the off-the-shelf gas exchange systems.
Off-the-shelf gas exchange systems: some pitfalls
By contrast with earlier custom-built gas exchange systems, the modern commercially available systems enclose small areas of leaf, typically less than 10 cm2 and often as small as 2 cm2. This has the advantage that, given variability across leaf surfaces, the measurements will be less prone to errors in calculations resulting from spatial heterogeneity of stomatal conductance and photo-synthetic capacity (Cheeseman, 1991). It also has the advantage that the exact area is known, with the exception of small or narrow leaves which do not ®ll even these small chambers. The downside is that a small area, by de®nition, will have a larger edge-to-area ratio. In the older chambers typically used in custom-built systems, the entire leaf was enclosed and sealed at the petiole. In commercial cham-bers, a portion of the leaf is sealed into the chamber. A seal is achieved with closed cell foam gaskets appressed to both surfaces of the leaf isolating a small area. Much has been learned from the application of these systems in measuring the response of leaf respiration to elevated [CO2], but it has also been learnt how misleading results from these systems can be if attention is not given to potential errors. Ten years ago there appeared to be overwhelming evidence, most from commercial portable gas-exchange systems, that
elevation of [CO2] would immediately depress leaf respiration (Amthoret al., 1992; reviewed in Drakeet al., 1997). Today it is realized that this conclusion was largely, if not wholly, an artefact of the way these measurements were made (Amthor, 2000; Jahnke, 2001; Jahnke and Krewitt, 2002). The commercial systems were designed for measuring larger ¯uxes of CO2associated with photosyn-thesis. Errors that might have a small effect with high rates of photosynthesis will have a large impact on measured rates of respiration. These errors will apply equally to photosynthesis at low ¯uxes, for example, during meas-urements at low light and low [CO2], or of stressed plants or plants with inherently low photosynthetic rates. What are some of the problems associated with these commer-cial leaf chambers?
Leaks
Some CO2can escape through the gasket, this may not be a constant and will vary with the leaf. It is worse among leaves with prominent veins where small air channels may form between the gasket and the sides of the vein. This is particularly signi®cant at low ¯uxes when errors due to artefactual apparent ¯uxes will have their greatest effect and in the measurement of A/Ci responses, when differ-ences between the air outside and that within the chamber are greatest. A partial solution, recommended commonly by manufacturers is the measurement of ¯ux in the absence of a leaf. Here, when the chamber is closed, a perfect seal should give a zero ¯ux, regardless of the difference in [CO2] between the inside and outside of the chamber. However, gaskets have some permeability and may release or absorb some CO2 (Long and HaÈllgren, 1993). These leaks may be measured and used to correct ¯uxes. However, when the leaf is placed in the chamber additional leaks may be introduced. There are two partial solutions. (1) Use a dead leaf, formed by rapidly drying a live specimen and establish the rate of leakage at each [CO2] that will be used in constructing an A/Ci response. (2) Enclose the chamber in a container ®lled with the gas mixture that is being introduced into the chamber. One means to achieve this is to supply the outer container with the exhaust air from the system.
Edge effects
Because the gasket has a ®nite thickness it and any other wall structure above the leaf will affect radiation in the chamber, unless the light source is a parallel beam at 90°to the leaf surface. In the ®eld, the lower the sun angle the greater this shading effect may be. The problem is alleviated if an arti®cial light source is placed above the chamber. The gasket will also cause the photosynthesizing surface to be surrounded by tissue in darkness that is respiring. This respired CO2 will decrease the measured net ¯ux. This problem may be decreased by maintaining a pressure above atmospheric in the chamber and by
minimizing gasket width (Pons and Welschen, 2002), although this may, in itself, cause other errors (Jahnke and Krewitt, 2002).
Lateral ¯ux through the leaf air space
Another source of error is a ¯ux of air between the chamber and surrounding air via the internal air space of the enclosed leaf. This will only be an issue with homobaric leaves, i.e. those with a continuous internal air space. In this case, the only complete solution will be enclosure of the entire leaf (Jahnke and Krewitt, 2002). Otherwise, minimizing the pressure gradient between the leaf chamber space and the outside air will minimize this error.
Practical interpretation of the A/Ciresponse The model of Farquhar et al. (1980) has provided a tried and tested means quantitatively to partition biochemical and stomatal limitations on photosynthesis, from the response of CO2 uptake to intercellular mole fraction of CO2 (A/Ci). Simultaneous measurement of chlorophyll ¯uorescence now extends this analysis, providing a means to determine the partitioning of energy between photosyn-thesis and photorespiration, and to determine Rl in vivo. Within the mesophyll, biochemical and diffusion limita-tions may now be separated.
TheA/Cicurve
Two of the most commonly reported responses of CO2 uptake are the responses of A to photon ¯ux (Q) and to intercellular CO2mole fraction (Ci). The measurement and interpretation of the A/Q response has been described previously (Longet al., 1996; Long and HaÈllgren, 1993). TheA/Ciresponse is determined by measuringAandEat a series of ambient CO2 concentrations (Ca) and a de®ned leaf-air vapour pressure de®cit (D). By assuming that CO2 diffuses from the ambient air passing over the leaf to the substomatal cavity, via the pathway by which water vapour escapes the substomatal cavity, the leaf diffusive con-ductance for carbon dioxide (gl) can be determined fromE,
D, and the diffusivities of CO2and water vapour (Long and HaÈllgren, 1993). From measurements of both the CO2 concentration surrounding the leaf (Ca) andA,Cican then be calculated.
Ci=Ca±A/gl (1) The response of A to Ci may then be constructed by measuring these values at a range of CO2concentrations. The response of A to Ca by itself cannot be interpreted easily since it is affected by boundary layer, stomatal, and mesophyll processes; the response of A to Ci, however, eliminates the effect of the boundary layer and stomata, depending solely on mesophyll processes. How the A/Ci response is determined depends on the purpose of the
study. The most common purpose is to state in vivo
apparent Rubisco activity (Vc,max) and the maximum rate of electron transport used in the regeneration of RuBP (Jmax), under ambient conditions. A decrease inCibelow ambient will lower A and the pools of Calvin cycle intermediates, which can affect the activity of Rubisco and other enzymes. These changes may, in turn, alter in vivo
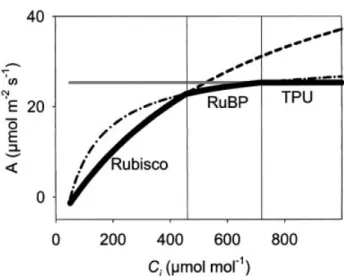
Rubisco activity and the capacity for RuBP regeneration. It is therefore important to complete the measurements, particularly at lower [CO2], as rapidly as possible to avoid signi®cant changes in activation. The response ofAtoCi describes two, sometimes three, phases (Fig. 1). AsCi is increased from its minimum concentration,dA/dCiis high and determined by Rubisco activity. With a further increase, there is an in¯ection to a lower dA/dCi that approaches zero, where RuBP-regeneration is limiting. In some instances, a further increase in Ci may result in another transition to a plateau or a decrease inAwith an additional increase inCi (dA/dCi <0) if triose-phosphate utilization (TPU) becomes limiting. These phases are mathematically predicted by the model of Farquharet al. (1980), as modi®ed to account for TPU-limitation (von Caemmerer, 2000). By ®tting these phases, as mathemat-ically de®ned (von Caemmerer, 2000) key biochemical kinetic variables determining photosynthetic rate can be determinedin vivo, speci®cally:Vc,max,JmaxandVTPU. The model of Farquharet al. (1980)
Both CO2and O2compete for the Rubisco binding site in the processes known as carboxylation and oxygenation, respectively (Farquhar et al., 1980). To account for the competitive inhibition between CO2 and O2, A is math-ematically expressed as:
Fig. 1. Idealized A/Ci response. The rates of photosynthesis that
would be achieved depending on whether Rubisco, RuBP or TPU are limiting are indicated. The actual photosynthetic rate (solid line) at any given Ci is the minimum of these three potential limitations.
Parameters used: Vc,max=70 mmol m±2 s±1, Jmax=130 mmol m±2 s±1, VTPU=9.1mmol m±2s±1,Rd=2mmol m±2s±1.
Avcÿ0:5voÿRd vc 1ÿGC i
ÿRd 2
The term (1±G*/Ci) is used to take account of the proportion of recently assimilated carbon that is released in photorespiration. The photosynthetic compensation point (G*) is the CO2 concentration at which the photorespiratory ef¯ux of CO2 equals the rate of photo-synthetic CO2uptake (i.e. whenvc=2vo). It is distinct from
G which is the CO2 compensation point, i.e. the CO2 concentration at which vc=2vo+Rd. A method for deter-miningG* from gas-exchange is provided by Brooks and Farquhar (1985).G* is de®ned by:
G0:5O
3
where t, the Rubisco speci®city factor, is derived from Rubisco kinetics as
Vc;maxKo
Vo;maxKc 4 and appears a very highly conserved quantity among the Rubisco's of higher plants (Bainbridge et al., 1995; Bernacchi et al., 2001). The actual rate of carboxylation at Rubisco is determined by the minimum of three potential rates (Farquhar et al., 1980; Harley and Sharkey, 1991; von Caemmerer, 2000):
vc= min {wc,wj,wp} (5) Substituting forvcinto equation (2) yields
Amin{wc;wj;wp} 1ÿGC i ÿRd 6 where: wcC Vc;maxCi iKc 1O=Ko 7 wj4:5C JCi i10:5G 8 wp 3Vtpu 1ÿG Ci 9
wc,wjand wpare the potential rates of CO2assimilation that can be supported by Rubisco, RuBP-regeneration and triose-phosphate utilization, respectively. The model assumes that RuBP regeneration is limited by potential whole chain electron transport rate (J) under the given conditions of light and temperature and corrected for partitioning between oxygenation and carboxylation of RuBP. At light saturation, Jis equal toJmax, but at lower light levelsJmay be estimated from photon ¯ux (Q) from a non-rectangular hyperbola (von Caemmerer, 2000):
J Q2Jmaxÿ
Q2Jmax2ÿ4QPSIIQ2Jmax
q
2QPSII 10
whereQPSIIrepresents a curvature factor andQ2represents the incident quanta utilized in electron transport through PSII:
Q2=QalFPSII,maxb (11)
where al is the leaf absorptance, FPSII,max is maximum quantum yield of photosystem II andbis the fraction of absorbed light that reaches photosystem II (von Caemmerer, 2000). Variability in the parameters of equations 10 and 11 with leaf and growth temperature are described by Bernacchiet al. (2003).
EstimatingVc,max,Jmax, VTPUfrom theA/Ciresponse To deduce the quantities of Vc,max, Jmax and VTPU, it is important to obtain measures of Ain all three phases, if present, of the response toCi. Frequently, TPU will not be a limitation at anyCiand so only two phases may be seen. Figure 1 shows a typicalA/Cicurve identifying each of the three potential limiting processes. In practice, it has been found that the initial slope of the A/Ci response, repre-senting photosynthesis limited byVc,max(equation 7), will change within 5 min of leaf exposure to a low Ca, while points above the in¯exion seem less affected by the duration of exposure to increased Ca. A protocol com-monly used in determining this A versus Ci response (Ainsworth et al., 2002) is as follows. (1) Induce photo-synthesis at the growth CO2concentration and at saturating
Q until A is steady-state; where steady-state in practice means that A shows no systematic decrease or increase (62%) over a 5 min period. This is important to ensure a steady-state activation of Rubisco. Values ofAandCiare then recorded andCais decreased to 300mmol mol±1. As soon asCais stable (cv <0.7%), but not necessarily steady-state,AandCiare recorded. This procedure is repeated for
Cavalues of 250, 200, 150, 100, and ®nally 50mmol mol±1. With practice, each measurement in this series can be completed within 2 min. Upon completion of the meas-urement at a Ca of 50 mmol mol±1,Cais returned to 370
mmol mol±1to check that the originalAcan be restored. If this is achieved thenCais increased stepwise to 450, 550, 650, 800, and 1000 mmol mol±1. Steady-state photosyn-thesis need not be obtained at each step, and indeed could introduce errors if the purpose is to determine capacities under the ambient growth conditions. It is critical to choose values ofCathat suit your material. First, the use of pilot studies is recommended to determine theCiat which the transitions between Rubisco- and RuBP-limited photo-synthesis and between RuBP- and TPU-limited photosyn-thesis occur. Then ensure a minimum of ®ve points either side of these. Equation 6 may then be ®tted to the whole curve (Wullschleger, 1993). Alternatively, the
subcompo-nents may be ®t to different portions of the curve. For example, by substituting equation (7) into (6),Amay be ®t toCiwithRdas they-axis intercept, in whichKcandKoare assumed constants at any given temperature (Bernacchi
et al., 2001):
Kcexp 38:05ÿ79:43= R Tl273:15 12
Koexp 20:30ÿ36:38= R Tl273:15 13 whereTlis the leaf temperature (°C). There are relatively few measurements of the temperature responses of Ko,Kc andG* and the extent to which they vary between species. They are commonly considered to be constant among terrestrial C3species for the purposes of the Farquharet al. (1980) model (Wullschleger, 1993). Since these param-eters depend on the properties of Rubisco, some inter-speci®c variation should be expected even among terres-trial C3species. Medlynet al. (2002) review and evaluate different temperature functions for these parameters.
The two unknownsVc,maxandRdcan be solved using a non-linear maximum likelihood best-®t (Sigmaplot 2000, SPSS Inc.). Alternatively, A may be plotted as a linear function ofCi:
A=f¢Vc,max±Rd (14)
whereVc,maxis the slope andRdthe intercept.f¢is obtained from equations 6 and 7 and expressed as
f0 CiÿG
CiKc 1O=Ko 15 Because of the highly temperature-dependent nature of
Vc,maxit is commonly expressed at a common temperature, 25°C. TheAthat would have been obtained at 25°C may be determined from the functions of Bernacchi et al. (2001). Vc,max reports the apparent activity of Rubisco
in vivo, which will vary both with the amount of Rubisco and its activation state. It is important to note that even in healthy well-illuminated leaves under optimal conditions Rubisco is rarely 100% activated. Above 35 °C a further loss of activation may occur due to high-temperature effects on Rubisco activase (Spreitzer and Salvucci, 2002). Similarly,Jmaxmay be obtained by ®ttingAto Ciwith equations (6) and (8), assuming thatwjis limiting. This can also be made amenable to linear regression with
g0 CiÿG
4:5Ci10:5G 16
This may be written as:
A=g¢J±Rd (17) An important consideration when calculating Jmax, as the slope in equation (17), is that the small errors in the higher rates ofAassociated with RuBP-limited
photosyn-thesis may introduce large errors in estimates of the intercept,Rd. Therefore, a common practice is to solve for
Vc,maxandRd®rst and to use the value ofRdfrom equation (14) as a ®xed parameter when estimating J in equation (17). This approach assumesRdis constant in the light over all CO2concentrations. Given the small magnitude ofRd this would have little effect on estimates of Vc,max. Alternatively, Loreto et al. (1999) provide a combined gas-exchange and mass isotope approach to determineRd, which can be used at numerous light ¯uxes. For all curve ®ts,G* is assumed a constant at any given temperatureÐan estimate may be obtained from Bernacchiet al. (2001):
G exp 19:02ÿ38:83= R Tl273:15 18 Brooks and Farquhar (1985) present a gas-exchange method for the direct measurement of G*. While wj is limiting,Ashould continue to increase slightly with further increases inCi. A lack of increase inA, indicates TPU is limiting.VTPUin its most simple form is represented by:
VTPU= (A+Rd)/3 (19) Often, however, a decrease in A is observed at higher [CO2]. In these cases, a more complex representation of
VTPUis given as:
VTPU ARd Ciÿ 13g=2G
3 CiÿG 19a where agrepresents glycolate carbon not returned to the chloroplast and is linked with the release of phosphate. This more complex variation of TPU-limited photosyn-thesis is discussed in detail elsewhere (Harley and Sharkey, 1991; von Caemmerer, 2000). Because the transition to TPU-limited photosynthesis, if present, may occur at highCiit is dif®cult to separate graphically
RuBP-Fig. 2. Using the same parameters as in Fig. 1, electron transport (J) is predicted for photosynthesis and photorespiration assuming Rubisco, RuBP or TPU limitation. The actual electron transport rate at any given Ci is the minimum of these three potential limiting
from TPU-limited photosynthesis. Here, parallel measure-ments of modulated ¯uorescence to determine JPSII provides important con®rmatory information. As Ci increases it follows from equation (6) that JPSII will increase if Rubisco is limiting, stay constant if RuBP-regeneration is limiting, and decrease if TPU is limiting (Fig. 2).
Assessing stomatal limitation
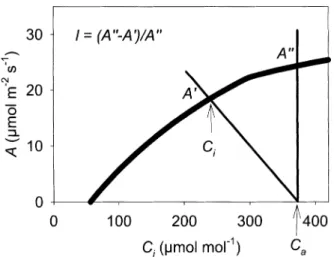
It is frequently seen that leaf conductance decreases with any factor that decreases photosynthesis. However, this does not necessarily mean that stomata are any more limiting to photosynthesis. But do stomata contribute to the decrease in photosynthesis? Several methods have been suggested to quantify the limitation that the combined stomatal and boundary layer conductances (gl) impose on leaf CO2 uptake (A) (see Jones, 1998, for a detailed consideration of alternative approaches and their limita-tions). Farquhar and Sharkey (1982) provided a very simple graphical method that makes further use of theA/Ci response. If a leaf is considered with photosynthetic rateA¢ and gl at the ambient atmospheric CO2 concentration (Fig. 1), a prediction can be made of the the hypotheticalA
(A¢¢in Fig. 3) that would be obtained if the mesophyll had free access to the CO2in the ambient air (i.e. gl=`) then
Ci=Ca. The limitation (l) imposed byglis given by:
l= (A¢¢±A¢)/A¢¢ (20)
Assessing photorespiration in vivo
A measured by gas exchange in C3 plants is the rate of carboxylation less the release of CO2from photorespira-tion and mitochondrial respiraphotorespira-tion (equaphotorespira-tion 6). The rate of
electron transport through PSII (JPSII), less any ¯ux to alternative sinks, is the sum of ¯ux both to photosynthesis and photorespiration. Given the electron requirements to support photorespiration and photosynthesis, the rate of photorespiration may be calculated via simultaneous measurement ofAandFPSII.
To make these measurements it is ®rst necessary to determine alternative electron sinks. This may be achieved by determining the responses of A andFPSII to Q under non-photorespiratory conditions (i.e. 10 mmol mol±1O
2). Note, though, that the sensitivity of infrared gas analysers to water vapour and to CO2are affected by absorption line broadening when the composition of air is changed, this includes altering the O2content (Burchet al., 1962). It is therefore essential to recalibrate the analyser for 1% O2. Leaf absorptance (a) must also be determined, using an integrating sphere and in the same light source that is used for measuring AandJPSII(Bernacchiet al., 2003). From these measurements, the quantum ef®ciency of CO2uptake (FCO2) is calculated as:
FCO2= (A±Rd)/(aQ) (21) When measured in 1% O2, the relationship of FPSII to
FCO2is linear (Gentyet al., 1989):
FPSII=kFCO2+b (22) wherekis the slope of the line and represents the apparent number of electrons needed to ®x one CO2. The intercept,
b, represents the fraction of electrons going to alternative electron sinks at in®niteQ. In theory,kshould be 4, which is the number of electron equivalents needed to reduce one molecule of CO2. In reality, combining measurements of gas exchange and chlorophyll ¯uorescence does not yield such a low number. As such, it is necessary to `calibrate' the value ofFPSII(Valentiniet al., 1995). With the above measurements ofFPSIIin 10 mmol O2mol±1the calibrated quantum ef®ciency of PSII,Fe, is calculated as
Fe= 4FCO2 (23) Equations (22) and (23) can be combined and rearranged as: Fe= 4(FPSII±b)/k (24) Equation (24) will hold true regardless of whether photorespiration is present. Because the termbis included in this equation,Ferepresents only electrons being used by photosynthesis and photorespiration. If there is perfect agreement between chlorophyll ¯uorescence and gas exchange, then the 4 and the k in equation (24) would cancel.
The total rate of electron transport though photosystem II to photosynthesis and photorespiration,Jt, can then be calculated as
Jt=FeQ (25)
Fig. 3. Graphical method of estimating the limitation (l) placed onA
by the stomata and leaf boundary layer. The line originating atCi=370 mmol mol±1 and intercepting the A/C
i curve at A¢ is the supply
function, i.e. the decrease inCithat will occur asAincreases above 0.
The slope of the supply function is ±1/gl. In the absence of any
limitation to diffusion of CO2 from the atmosphere to the site of
Using the equations of Valentini et al. (1995), the partitioning of electrons to photosynthesis, Jc, and to photorespiration,Jocan be determined as:
Jt=Jc+Jo (26) Again assuming that four electrons are needed to ®x one CO2, then:
Jc= 4(A+Rd+Rl) (27) whereRdandRlrepresent the CO2being released through mitochondrial respiration and through photorespiration, respectively. Assuming eight electrons for the release of one CO2via photorespiration:
Jo= 8Rl (28) Combining equations (26), (27), and (28) and rearranging to solve forRlyields the equation:
RlJtÿ4 12ARd 29
Partitioning of electrons between photosynthesis and photorespiration is then given by incorporating equation (29) into equation (27):
Jo= 1/3[Jt+8(A+Rd)] (30) and incorporating equation (29) into equation (28):
Jo= 2/3[Jt±4(A+Rd)] (31)
Assessing mesophyll conductance (gm)
An assumption of much gas exchange work, including the original model of Farquharet al. (1980) has been thatCi approximates to the [CO2] at Rubisco (Cc), i.e. Ci=Cc. However, CO2 has to diffuse from the intercellular air space through the mesophyll cell wall, plasma membrane and chloroplast membrane. It has become apparent that this pathway can result in a signi®cant difference between
Ci and Cc (Harley et al., 1992; Loreto et al., 1992; von Caemmerer, 2000). However, gm could not easily be measured until recently. Previouslygmwas estimated from pathway dimensions and conductances across membranes, requiring many assumptions (Nobel, 1999). By combining gas exchange and ¯uorescence it is now possible to measure mesophyll conductance directly. This is based on the assumption that the difference between J estimated from gas exchange and J measured from chlorophyll ¯uorescence is a function of gm. Two methods for estimating gm have been used (Loreto et al., 1992; Bernacchiet al., 2002).
The constant Jmethod
This method requires measurements of A, Rd and JPSII when photosynthesis is limited by the regeneration of
RuBP and therefore JPSII remains constant as Ci is increased (Bongi and Loreto, 1989). Electron transport (J) estimated from chlorophyll ¯uorescence is a function of
A, Ci, G*, and gm (Harley et al., 1992). Using G* for a given temperature from Bernacchi et al. (2001) and the measured response of A to a range of Ci at which J is observed to be constant:
J ARd4 CiÿA=gm 2G
CiÿA=gm ÿG 32
Equation (32) may then be solved forgmfor the range of
Ci. Harleyet al. (1992) provide a statistical method for this solution.
The variableJmethod
This uses A and Rd measured from gas exchange and J estimated from ¯uorescence to solve for gm (Bongi and Loreto, 1989; Harleyet al., 1992). This equation requires that Rubisco is limiting photosynthesis and that J will increase withCi: gm A CiÿG J8 AR d Jÿ4 ARd 33
The value of G* at a given temperature from Bernacchi
et al. (2002) can be used for both the constant and variable
Jmethods of calculatinggm. Other estimates ofG* are also available (Brooks and Farquhar, 1985; von Caemmerer
et al., 1994; Bernacchi et al., 2001), however, estimates based onCi, rather than onCcmay introduce error to the calculations.
Bernacchiet al. (2002) used both methods at a range of temperatures for tobacco; they gave very close agreement. This study also revealed thatgmhas a highQ10suggesting that the dominant process(es) determining gm was not physical diffusion, but probably protein mediated; possibly involving a carbonic anhydrase or aquaporins. This is consistent with Centrittoet al. (2003) who showed thatgm could change as rapidly as gs, indicating that gm is not determined by intrinsic anatomical features. Bernacchi
et al. (2002) also showed that transfer from the intercellular space to Rubisco represented a limitation of 0.1±0.2, i.e. ifgmwas in®nite photosynthetic rates would be 10±20% higher. Clearly, there is more to learn about mesophyll conductance, its basis and signi®cance, but it is one more example of how simultaneous measurement of gas exchange and ¯uorescence are extending the range of measurements of key processes that may now be achieved with modern off-the-shelf gas exchange and ¯uorescence systems in the most meaningful situation possible,in vivo. These are only a fraction of the possiblein vivo measure-ments that may potentially be made on a single leaf (Laisk
Appendix
Abbreviations
A Net rate of CO2uptake per unit of projected leaf area (mmol
m±2s±1)
Ci Intercellular CO2concentration (mmol mol±1)
D Vapour pressure de®cit (kPa) E Transpiration (mmol m±2s±1)
gl Leaf conductance, the combined gas phase conductances of the
boundary layer and stomata (mmol m±2s±1)
J Rate of electron transport (mmol m±2s±1)
Jmax Maximum rate of electron transport (mmol m±2s±1)
Jc Jresulting from carboxylation of RuBP (mmol m±2s±1)
Jo Jresulting from oxygenation of RuBP (mmol m±2s±1)
JPSII Total rate of whole chain electron transport measured via
¯uorescence (mmol m±2s±1)
Jt JPSIIcorrected for any ¯ux to alternative sinks, i.e. other than
photosynthetic carbon metabolism, but including photorespiratory metabolism (mmol m±2s±1).
Kc Rubisco Michaelis constant for CO2(mmol mol±1)
Ko Rubisco Michaelis constant for O2(mmol mol±1)
O Concentration of oxygen in air (mmol mol±1)
Q Photosynthetic photon ¯ux density (mmol m±2s±1).
Q2 Quanta utilized in electron transport through PSII (mmol
m±2s±1)
R Molar gas constant (kJ K±1mol±1)
Rd Mitochondrial respiration rate in the light (mmol m±2s±1)
Rl Rate of CO2release in photorespiration (mmol m±2s±1)
Tl Leaf absolute temperature (°C)
TPU Triose-phosphate utilization
Vc,max Maximum RuBP saturated rate of carboxylation (mmol
m±2s±1)
vc Rate of carboxylation of RuBP via Rubisco (mmol m±2s±1)
vo Rate of oxygenation of RuBP via Rubisco (mmol m±2s±1)
vTPU Rate of triose-phosphate utilization (mmol m±2s±1)
wc Rubisco-limited rate (= RuBP saturated rate) of carboxylation
(mmol m±2s±1)
wj RuBP-limited rate of carboxylation (mmol m±2s±1)
wp TPU-limited rate of carboxylation (mmol m±2s±1)
a Leaf absorbance (0±1, dimensionless)
b Fraction of absorbed quanta reaching PSII (0±1, dimensionless) G* CO2 compensation point in the absence of dark respiration
(mmol mol±1)
Q Convexity of the non-rectangular curve describing the depend-ence ofAonQ(0±1 dimensionless)
QPSII Convexity of the non-rectangular curve describing the
dependence ofJtonQ(0±1 dimensionless)
Fa Apparent maximum quantum yield of CO2uptake; initial slope
of the light response curve;AversusQ(0±1, dimensionless) FCO2 Quantum yield of CO2 uptake, for any given Q (0±1,
dimensionless)
Fe Maximum quantum yield of photosynthetic linear electron ¯ow
through PSII; initial slope of the light response curve;JversusQ(0± 1, dimensionless)
FPSII Quantum yield of PSII, for any givenQ(0±1, dimensionless)
t Rubisco speci®city factor
References
Ainsworth EA, Davey PA, Hymus GJ, Drake BG, Long SP.
2002. Long-term response of photosynthesis to elevated carbon dioxide in a Florida scrub-oak ecosystem. Ecological Applications12,1267±1275.
Amthor J, Koch G, Bloom A. 1992. CO2inhibits respiration in
leaves ofRumex crispusL.Plant Physiology98,1±4.
Amthor JS.2000. Direct effect of elevated CO2on nocturnalin situ
leaf respiration in nine temperate deciduous tree species is small. Tree Physiology20,139±144.
Bainbridge G, Madgwick P, Parmar S, Mitchell R, Paul M, Pitts J, Keys AJ, Parry MAJ.1995. Engineering Rubisco to change its catalytic properties.Journal of Experimental Botany46,1269± 1276.
Bernacchi CJ, Pimentel C, Long SP.2003. In vivotemperature response functions of parameters required to model RuBP-limited photosynthesis.Plant, Cell and Environment26,1419±1430.
Bernacchi CJ, Portis AR, Nakano H, von Caemmerer S, Long SP. 2002. Temperature response of mesophyll conductance. Implications for the determination of Rubisco enzyme kinetics and for limitations to photosynthesisin vivo. Plant Physiology
130,
Bernacchi CJ, Singsaas EL, Pimentel C, Portis AR, Long SP.
2001. Improved temperature response functions for models of Rubisco- limited photosynthesis.Plant, Cell and Environment24,
253±259.
Bloom AJ, Smart DR, Nguyen DT, Searles PS.2002. Nitrogen assimilation and growth of wheat under elevated carbon dioxide. Proceedings of the National Academy of Sciences, USA99,1730± 1735.
Bongi G, Loreto F.1989. Gas-exchange properties of salt-stressed olive (Olea europeaL) leaves.Plant Physiology90,1408±1416.
Brooks A, Farquhar GD.1985. Effect of temperature on the CO2/
O2 speci®city of ribulose-1,5-bisphosphate carboxylase/
oxygenase and the rate of respiration in the light. Planta 165,
397±406.
Burch DE, Singleton EB, Williams D. 1962. Absorption line broadening in the infrared.Applied Optics1,359±363.
Cheeseman J. 1991. PATCHY: simulating and visualizing the effects of stomatal patchiness on photosynthetic CO2 exchange
studies.Plant, Cell and Environment14,593±600.
Centritto M, Loreto F, Chartzoulakis K.2003. The use of low [CO2] to estimate diffusional and non-diffusional limitations of
photosynthetic capacity of salt- stressed olive saplings. Plant, Cell and Environment26,585±594.
Di Marco G, Manes F, Tricoli D, Vitale E.1990. Fluorescence parameters measured concurrently with net photosynthesis to investigate chloroplastic CO2concentration in leaves ofQuercus
ilexL.Journal of Plant Physiology136,538±543.
Drake BG, Gonzalez Meler MA, Long SP.1997. More ef®cient plants: a consequence of rising atmospheric CO2?Annual Review
of Plant Physiology and Plant Molecular Biology48,609±639.
Farquhar GD, Sharkey TD. 1982. Stomatal conductance and photosynthesis.Annual Review of Plant Physiology33,317±345.
Farquhar GD, von Caemmerer S, Berry JA. 1980. A
biochemical model of photosynthetic CO2assimilation in leaves
of C3species.Planta149,78±90.
Genty B, Briantis JM, Baker NR.1989. The relationship between the quantum yield of photosynthetic electron transport and quenching of chlorophyll ¯uorescenceBiochimica et Biophysica Acta990,87±92.
Harley PC, Loreto F, Marco GD, Sharkey TD.1992. Theoretical considerations when estimating the mesophyll conductance to CO2¯ux by analysis of the response of photosynthesis to CO2.
Plant Physiology98,1429±1436.
Harley P, Sharkey T. 1991. An improved model of C3
photosynthesis at high CO2: reversed O2 sensitivity explained
by lack of glycerate reentry into the chloroplast.Photosynthesis Research27,169±178.
Jahnke S.2001. Atmospheric CO2concentration does not directly
affect leaf respiration in bean or poplar. Plant, Cell and Environment24,1139±1151.
directly affect leaf respiration measurement in tobacco, but not respiration itself.Plant, Cell and Environment25,641±651.
Jones HG. 1998. Stomatal control of photosynthesis and transpiration.Journal of Experimental Botany49,387±398.
Laisk A, Oja V, Rasulov B, Ramma H, Eichelmann H, Kasparova I, Pettai H, Padu E, Vapaavuori E. 2002. A computer-operated routine of gas exchange and optical measurements to diagnose photosynthetic apparatus in leaves. Plant, Cell and Environment25,923±943.
Long SP, Farage PK, Garcia RL.1996. Measurement of leaf and canopy photosynthetic CO2 exchange in the ®eld. Journal of
Experimental Botany47,1629±1642.
Long SP, HaÈllgren J-E. 1993. Measurement of CO2assimilation
by plants in the ®eld and laboratory. In: Hall DO, Scurlock JMO, Bolhar-Nordenkampf HR, Leegood RC, Long SP, eds. Photosynthesis and productivity in a changing environment: a ®eld and laboratory manual. London: Chapman and Hall, 129± 167.
Loreto F, Del®ne S, Di Marco G. 1999. Estimation of photorespiratory carbon dioxide recycling during photosynthesis. Australian Journal of Plant Physiology 26,
733±736.
Loreto F, Harley PC, Marco GD, Sharkey TD.1992. Estimation of mesophyll conductance to CO2¯ux by three different methods.
Plant Physiology98,1437±1443.
Maxwell K, Johnson GN. 2000. Chlorophyll ¯uorescenceÐa practical guide.Journal of Experimental Botany51,659±668.
Medlyn B, Dreyer E, Ellsworth D, Forstreuter M, Harley P, Kirschbaum M, Le Roux X, Loustau D, Montpied P, Strassemeyer J, Walcroft A, Wang K. 2002. Temperature response of parameters of a biochemically-based model of photosynthesis. II. A review of experimental data. Plant, Cell and Environment25,1167±1179.
Nobel PS. 1999. Physicochemical and environmental plant physiology, 2nd edn. San Diego: Academic Press.
Pons TL, Welschen RAM. 2002. Overestimation of respiration rates in commercially available clamp-on leaf chambers. Complications with measurement of net photosynthesis. Plant, Cell and Environment25,1367±1372.
Spreitzer RJ, Salvucci ME.2002. Rubisco: structure, regulatory interactions, and possibilities for a better enzyme.Annual Review of Plant Biology53,449±475.
Valentini R, Epron D, Angelis PD, Matteucci G, Dreyer E.1995. In situestimation of net CO2assimilation, photosynthetic electron
¯ow and photorespiration of Turkey oak (Q. cerris L.) leaves: diurnal cycles under different water supply. Plant, Cell and Environment18,631±640.
von Caemmerer S. 2000. Biochemical models of leaf photo-synthesis. Canberra, Australia: CSIRO Publishing.
Wullschleger SD. 1993. Biochemical limitations to carbon assimilation in C3 plantsÐa retrospective analysis of the A/Ci
curves of 109 species.Journal of Experimental Botany44,907± 920.