A research towards completing
the asset information life cycle
An analysis of the relationships between data
exchange, BIM and the asset life cycle and the
solutions to overcome existing issues at Amsterdam
Airport Schiphol.
Author: L. de Vries BSc
Supervisors: mw. dr. dipl. ing. S. Zlatanova (TU Delft) Ir. N. Wasserman (Amsterdam Airport Schiphol) Professor: prof. dr. ir. P.J.M. van Oosterom (TU Delft)
“You are not going to do research until half the people say it is not possible.”
Burt Rutan
A research towards completing the
asset information life cycle
An analysis of the relationships between data exchange, BIM and the asset life
cycle and the solutions to overcome existing issues at Amsterdam Airport
Schiphol.
Date:
March, 2013
Auteur:
Ing. L. (Lars) de Vries
Studentnr:
3487776
E-mail:
[email protected]
Website:
www.larsdevries.com
Supervisors: ir. N. (Nico) Wasserman
- [email protected]
mw. dr. dipl. ing. S. (Sisi) Zlatanova
- [email protected]
Preface
This thesis report is concludes my work for the Masters of Science programme Geographical Information Systems and Applications. During the four years I have been a student for this programme I have learned a lot. However, I think the most important thing I learned was getting acquainted with my own borders. During this thesis research, that started in September 2011, I suffered from a burn-out. As a result I have not been doing anything for my thesis research between March and June 2012. After that I slowly built up my thesis work and having it finalized by half-a-year later than originally planned.
Reflecting towards my study period, I do not know how I managed to fulfil a full-time job at Heijmans, do a part-time study for this Masters of Science programme and to be a good husband for my wife and a father for my son. Tight deadlines, working over nights and weekends, studying in between and also participating in the household. I learned a lot, made many new friends and got regularly inspired by all the new and existing GIS concepts we learned.
Off course would it not have been possible to conduct this programme without the support of my wife, Mirjam de Boer who has been very patient with me, but who also had to miss me. My son will be a little disappointed now that I am ready, since he will have to miss all the day trips my wife made with him, so I could study in a quite surrounding. Instead he will get my attention and I will probably take him for day trips now, only not as often.
I would also like to thank my employer, Heijmans, who have been willing to give me the opportunity to join this programme. Especially my manager Edwin van Osch and my project coordinator Pieter van Dueren den Hollander, who always supported me and were willing to help me where ever needed. A special thanks for all my colleague students with whom I did the projects in the first two years of the programme. I hope that we can stay in touch and that we will meet in the future where ever you are on this planet.
Related to my thesis research I would like to thank everybody at Schiphol for that contributed to my research in any way and the fact that everybody is willing to help. A special thanks for Mohamed El-Morabit for our lunch and coffee discussions. I also want to thank my supervisors Nico Wasserman (Schiphol) and Sisi Zlatanova (TU Delft) for supervising my research and also Peter van Oosterom for his role as Professor.
Although I will miss the contact with my fellow students from all over the world and the inspiring contact weeks at the Universities of Utrecht, Delft, Wageningen and Twente, I am also glad I have finished this wonderful expedition. I look forward to spending my time with family and friends who had to miss me in the past four years. Thank you for your patience.
Lars de Vries
Management summary
This thesis research for the Master of Science programme Geographical Information Management and Applications looks at the possibilities of completing the asset information life cycle at Amsterdam Airport Schiphol. Therefor an analysis was made of the current situation, after a literature research was conducted towards the subjects of data exchange and Building Information Modelling (BIM).
The insights in data exchange principles are needed to understand the potential problems in completing the asset information life cycle. At the moment as-built information is delivered to SGIS, but not re-used in new projects. The most important problems are caused by systems that are not able to communicate with each other and data structures that are different by nature because of its native software.
BIM is a topic that currently gets much attention in the world of design and construction. From their perspective BIM deals with another way of executing design and construction, where collaboration and integration are the key words. In practice BIM has a broader scope and can be defined as, being a process in which relevant actors collaborate on creating, analysing and managing multiple dimension data within a dynamic model representing one or more assets throughout its/their life cycle.
For this thesis research the new data model for asset information at Amsterdam Airport Schiphol, Schiphol GIS or SGIS, was analysed. SGIS replaces four other systems that contained all asset information at Schiphol, but that also contained double and inconsistent information. With SGIS these problems must belong to the past. The data model mostly contains 2D or 2½D data of all assets, including the most relevant information on the asset. SGIS also communicates, or will do so within two years, with three other systems that as a complex are the back bone of the asset management process at Amsterdam Airport Schiphol.
There are currently two problems with completing the asset information life cycle. The first problem is getting the information from the 3D model to SGIS. To solve this problem a workflow is suggested. This workflow includes an export to the open standard IFC from the original 3D AEC modelling software. A small addition to SGIS has to be made therefor, to be able to support the 3D geometries that are coming from that software.
The second problem is to get the information back from the operations and maintenance phase to a new design phase. Currently the most optimal solution seems to re-use the received IFC file and to add a DWG containing the changed geometries. Thereby it needs to be mentioned that the multi-patch objects from SGIS will be exploded to individual faces.
The preferred solution would have been to work from one central (spatial) database, but that is technically not possible yet. The problems are caused by the fact that AEC (3D modelling) software and GIS do not share a common geometric data model.
Additionally it needs to be researched what the actual information demand is for the design phase. In the current situation information gets lost after the exchange from construction to operations and maintenance, because the information need in those phases is less detailed.
With the suggested solutions and changes/additions to SGIS it is possible to complete the asset information life cycle for Schiphol and the relevant stakeholders and main-contractors. An inventory of the necessary resources to plan these changes still needs to be made.
Summary
This thesis research for the Master of Science programme Geographical Information Management and Applications focusses on solutions completing the asset information life cycle in general and to apply a selection of the offered solutions at Amsterdam Airport Schiphol. Currently the as-built information is added to SGIS, but it cannot be re-used in new projects. To be able to complete the asset information life cycle, it is first important to look at gaps that are present. Therefor three subjects have been researched, 1) data exchange, 2) BIM and 3) Schiphol GIS.
The asset information life cycle cannot be not completed at this moment because of differences within the asset information life cycle. The two most important differences are the use of software and the life cycle approach.
To understand the differences in software and the problems that arise in data exchange, first an analysis was made of data exchange. Beside the different use of terminology, the biggest differences can be found within data itself. Data exists of three components, 1) the file format/encoding (syntactic), 2) the meaning (semantic) and 3) the data model including attributes and geometry (structure). There exist different data exchange strategies that can support the possibilities to overcome these differences. And besides the strategy, also tooling is needed to convert the data. It also needs to be considered that a data exchange is a transaction between a sender and a receiver. The data itself can be seen as the message that is being transacted and it is important that both sender and receiver have a mutual understanding of the message. The message can be communicated direct or indirect, depending on the situation. Another aspect that plays a role is the way that different systems are able to use the same data, because they are integrated. The level of integration can be of influence on the ease to exchange a particular dataset. The mutual understanding of the message is needed on different levels and not only on the data or the system/software level. The organizational and people level are as important to make a data exchange successful.
An important part of the life cycle deals with design and construction. Within that sector currently much attentions is paid to something that is called BIM. BIM or Building Information Modelling can be seen as the process of creating a multiple dimension model, that is being analysed, updated and managed by different stakeholders who work together throughout the asset information life cycle with the purpose of efficiency and a decrease of information loss. Many people seem to have a different view on BIM, often caused by the activities those people execute and the environment they are acting in e.g. a specific phase of the asset life cycle. Most people think that BIM is something that only applies to design and construction, whilst the clear aim of BIM is to support the full life cycle of an asset. Despite the fact that within design & construction so-called AEC software is used and within operations and maintenance mostly GIS software is used, it can be called remarkable that BIM shows a lot of parallels with GIS concepts. Spatial Data Infrastructures (SDIs) is one of those concepts and shows a lot of overlap with BIM, with the remark that have their own application domain.
The second half of the asset life cycle deals with operations and maintenance. This research was conducted at Amsterdam Airport Schiphol and the data model, Schiphol GIS or SGIS, of Schiphol was taken at a closer look. The data model covers a wide variety of themes and replaced four other systems that contained a total of 77 themes, but that also contained double information that showed different truths. SGIS was developed to replace the former systems and to create a single source of truth. The data is made available to over 800 stakeholders by a view and, if necessary, an edit portal. Looking at the way SGIS is used within Schiphol, it can be stated that it is an application of BIM, with the remark that it is only applied to the operations and maintenance phase.
The biggest problems for completing the asset information life cycle can be found at where the construction is being followed by the operations phase and where the design phase is the follow up of the maintenance phase. These locations stand out, because the aim and use of the data is differently, but most of all because the software types are different. The different software types make that the data models are not easy to convert at those to locations and solutions have to be brought up.
The most ideal solution exists of a single spatial database that is used to store the 3D geometry model and that can be accessed by both the AEC and the GIS software. Other information can be stored in separate databases that can interact based on unique identifiers that consequently are used for all assets. Therefor a common 3D geometry model needs to be developed between AEC and GIS vendors, where each type of software can be used at its own strengths.
Since the previous solution is technically not yet applicable, because there does not exist a common geometric model for AEC (3D modelling) software and GIS, more practical scenarios have been looked at. Especially the exchange of building designs is troublesome, whilst the exchange between AEC and GIS software for infrastructural projects does not seem to cause as many problems with the conversion of 3D geometries as is the case with building data. The solution exists of the application of two different scenarios. The first scenario looks at the step from construction to operations. The best solution is to choose for a conversion strategy, where the native 3D building model is converted into the open standard IFC. The IFC data can than easily be converted into the SGIS data model, although it is necessary to add additional representations to the feature classes to the current data model, because the current model is not capable of handling 3D primitives. This research did not look towards the additional attribute information, since it is not expected that the exchange of that information will cause troubles as long as the unique identifier is maintained over all information sources. Other solutions include the export directly from the 3D AEC modelling software to GIS (but those exports are not supported yet) or the export via an ODBC connection to a (spatial) database (but unfortunately I was not able to test those and do not know whether a GIS or other software is capable of handling the (geometric) data).
The second step is to offer the 3D AEC modelling software the last received IFC file of a certain asset. Possible changes are added in a DWG drawing that contains all faces of the 3D model of SGIS in a classification that needs to be agreed upon with those stakeholders that are responsible for the design. At this moment it is not yet possible to export the SGIS data into an IFC dataset, although both data models show a lot of similarities. Exporters from GIS data to IFC are not yet available. An export to IFC would favour over an export to DWG, because in the last case relevant asset information gets lost due to the fact that DWG drawings do not support attribute information. However, little changes are expected in the geometry, meaning that the original IFC file will remain its value. Other solutions include the use of a 3D web feature service (WFS; but those are not supported by the 3D AEC modelling software) or a direct conversion to the native format of the 3D AEC modelling software (but those conversions are also not supported, just like the export to IFC).
At this moment it is partly possible to complete the asset information life cycle, but it is necessary to add additional geometry to the SGIS data model first and an agreement has to be made on how the changes to the 3D SGIS model will be offered in the DWG drawing.
Samenvatting (Dutch)
Dit thesis onderzoek voor het Master of Science programma ‘Geographical Information Management and Applications’ focust op oplossingen voor het rond maken van de asset informatie levenscyclus en om een selectie er van toe te passen op de situatie van Amsterdam Airport Schiphol. Om de asset levenscyclus te completeren is het belangrijk om eerst te kijken naar waar de gaten zitten. Daarvoor zijn drie onderwerpen onderzocht, 1) Data uitwisseling, 2) BIM en 3) Schiphol GIS.
De asset informatie levenscyclus kan op dit moment nog niet compleet gemaakt worden door verschillen binnen de asset informatie levenscyclus. De twee meest belangrijke verschillen zijn het gebruik van software en de benadering van de levenscyclus.
Om de verschillen in software en de problemen die naar voren komen in data uitwisseling te kunnen begrijpen, is eerst een analyse gemaakt van data uitwisseling. Naast het gebruik van verschillende terminologie, zit het grootste verschil in de data zelf. Data bestaat uit drie componenten, 1) het bestands formaat/codering, (syntaxis), 2) de betekenis/strekking (semantiek) en 3) het data model, inclusief de attributen en geometrie (structuur). Er bestaan verschillende strategieën voor data uitwisseling die kunnen helpen om deze verschillen te overbruggen. Naast strategie zijn er ook hulpmiddelen benodigd om de data om te zetten. Het is belangrijk te beseffen dat data uitwisseling moet worden gezien als een transactie tussen een zender en een ontvanger. De data zelf kan worden gezien als de boodschap die wordt uitgewisseld en het is dan ook belangrijk dat zender en ontvanger de verzonden boodschap op dezelfde manier interpreteren. De boodschap kan via een direct of via een indirect communicatiemiddel zijn verstuurd, afhankelijk van de situatie. Een ander aspect dat een rol speelt is de manier waarop verschillende systemen overweg kunnen met dezelfde dataset, doordat ze geïntegreerd samenwerken. Het niveau van integratie kan van invloed zijn op het gemak waarmee een bepaalde dataset wordt uitgewisseld. De gelijke interpretatie van de boodschap is nodig op verschillende niveaus en niet alleen op het niveau van systemen en software. Het organisatorische en menselijke niveau zijn even belangrijk om de data uitwisseling tot een succes te maken.
Een belangrijk onderdeel van de levenscyclus draait om ontwerpen en bouwen. Binnen die sector wordt momenteel veel aandacht besteed aan iets dat ‘BIM’ wordt genoemd. BIM (Building Information Modelling) of Bouw Informatie Model(leren) kan worden gezien als het proces van het creëren van een model met meerdere dimensies, dat wordt geanalyseerd, bijgewerkt en bijgehouden door verschillende belanghebbenden die samenwerken door de hele asset informatie levenscyclus heen, met als doel efficiency en het inperken van informatie verlies. Veel mensen lijken een andere kijk te hebben op het begrip BIM, vaak veroorzaakt door de werkzaamheden waar die persoon zich mee bezig houdt en de omgeving waarin hij of zij werkzaam is, bijvoorbeeld een specifieke fase van de levenscyclus. De meeste mensen denken dat BIM iets is dat alleen maar van doen heeft met ontwerpen en bouwen, terwijl het doel van BIM duidelijk is om de hele levenscyclus van een asset te ondersteunen. Ondanks het feit dat binnen ontwerp en bouw vooral de zogenaamde AEC software wordt gebruikt en bij beheer en onderhoud vooral GIS software, kan het opmerkelijk genoemd worden dat BIM veel parallellen vertoond met bepaalde GIS concepten. SDI’s (Geografische Informatie Infrastructuren) is een van die concepten en vertoond veel overlap met BIM, waarbij moet worden opgemerkt dat BIM een bredere scope omvat. De tweede helft van de asset levenscyclus gaat over beheer en onderhoud. Dit onderzoek is uitgevoerd op Amsterdam Airport Schiphol en het data model, Schiphol GIS of SGIS, is dan ook nader bekeken. Het data model bevat een grote diversiteit aan thema’s en heeft vier voormalige systemen vervangen die tezamen 77 thema’s bevatten, maar waar ook veel informatie dubbel aanwezig was en dat verschillende waarheden presenteerde. SGIS is ontwikkeld om die voormalige systemen te vervangen en om nog maar een waarheid te tonen. De data in SGIS is beschikbaar voor meer dan 800 belanghebbenden in een
raadpleeg portaal en, als het nodig blijkt, in een muteer omgeving. Kijkend naar de manier waarop SGIS binnen Schiphol wordt gebruikt, zou gezegd kunnen worden dat het een toepassing is van BIM, waarbij opgemerkt dient te worden dat het hier alleen op de beheer- en onderhoudsfase wordt toegepast. Het grootste problemen voor het completeren van de asset informatie levenscyclus liggen op grens waar bouwen wordt opgevolgd door beheer en daar waar ontwerp wordt vooraf gegaan door onderhoud. Deze overgangen vallen op, omdat het doel en het gebruik van de data verschillen, maar vooral omdat op deze locaties een overgang van software gebruik plaats heeft. De verschillende software typen maken dat de data modellen niet gemakkelijk om te zetten zijn en hiervoor zullen oplossingen bedacht moeten worden. De meest ideale situatie zou zijn wanneer er alle 3D geometrie in dezelfde ruimtelijke database opgeslagen zou worden en benaderd kan worden door zowel de AEC alsook door de GIS software. Andere informatie kan in aparte databases worden opgeslagen die dan communiceren op basis van unieke identificatie van de objecten, die consequent worden toegepast voor alle assets. Om dit te kunnen bewerkstelligen zal een gezamenlijk 3D geometrie model moeten worden ontwikkeld door de makers van zowel AEC en GIS software, waarbij beide typen software gebruikt kunnen blijven worden waarvoor ze eigenlijk ontwikkeld zijn.
Omdat de vorige oplossing voorlopig nog niet toepasbaar zal zijn, zijn ook meer praktische scenario’s ontwikkeld. Hierbij is vooral gekeken naar het ontwerp van gebouwen, omdat er zich bij de uitwisseling tussen AEC en GIS software in de GWW sector veel minder problemen voordoen. De oplossing bestaat uit het toepassen van twee scenario’s. Het eerste scenario kijkt naar de stap van bouwen naar beheer. De beste oplossing op dit punt is om te kiezen voor een conversie scenario, waarbij het originele 3D model wordt omgezet naar de open standaard IFC. De IFC data kan dan gemakkelijk worden geconverteerd naar het SGIS model, alhoewel het noodzakelijk is om hiervoor representaties toe te voegen aan de feature classes van het bestaande model. In dit onderzoek is niet gekeken naar het converteren van attribuut informatie, omdat niet wordt verwacht dat dit zoveel problemen op zal leveren, zolang de unieke identificatie code maar behouden blijft bij alle datasets. Andere mogelijke oplossingen zijn het direct exporteren vanuit de 3D AEC modelleer software naar GIS (maar deze exports worden nog niet ondersteund) of de export via een ODBC verbinding naar een (ruimtelijke) database (maar helaas is het mij niet gelukt om dit te testen en weet ik ook niet of de GIS software de geëxporteerde data kan lezen). De tweede stap omvat het terug aanbieden van het laatst ontvangen IFC bestand aan de 3D AEC modelleer software van een bepaalde asset. Mogelijke wijzigingen kunnen worden aangeboden in een DWG bestand die dan alle vlakken van het 3D model uit SGIS bevat. Hiervoor moet nog wel overeenstemming worden gezocht met de ontwerpers, om duidelijkheid te scheppen in classificatie die gebruikt dient te worden. Op dit moment is het nog niet mogelijk om vanuit SGIS direct naar IFC te exporteren, ondanks dat beide data modellen wel veel overlap vertonen. Er bestaat op dit moment simpelweg geen export functionaliteit van GIS naar IFC. Een export (van de verschillen) naar IFC zou de voorkeur hebben boven een export naar een DWG bestand, omdat in het laatste geval alle relevante asset informatie verloren gaat daar DWG bestanden geen attribuut informatie ondersteunen. Echter is het de verwachting dat er maar beperkte verschillen zullen zijn in de geometrie, waardoor het originele IFC bestand zijn waarde behoud en kan worden hergebruikt. Een andere oplossing is het gebruik van een 3D web feature service (WFS; maar die worden niet ondersteund door de 3D AEC modelleer software) of een directe conversie vanuit GIS naar het formaat dat bij de 3D AEC modelleer software behoort (maar ook deze conversies worden nog niet ondersteund).
Op dit moment is het (gedeeltelijk) mogelijk om de asset informatie levenscyclus te completeren, maar daarvoor is het wel noodzakelijk om het datamodel van SGIS uit te breiden met 3D geometrie en zal overeenstemming moeten worden bereikt met de ontwerpers over hoe de veranderingen van geometrie in SGIS aan hun zal worden aangeboden.
Inhoud
Preface ... i
Management summary ... iii
Summary ... iv Samenvatting (Dutch) ... vi 1 Introduction ... 1 1.1 Research questions ... 1 1.2 Methodology ... 2 1.3 Other research ... 2 1.4 Reading instructions ... 3 2 Data exchange ... 5 2.1 Share or exchange ... 5 2.2 Data characteristics ... 5 2.3 Communication process ... 6 2.4 Interoperability ... 7 2.5 Standards ... 9 2.6 Data usage ... 11
2.6.1 As-is data use ... 11
2.6.2 Integrated data use ... 11
2.6.3 Converted data use... 12
2.7 Data exchange interaction ... 15
2.7.1 Executive and management level ... 16
2.7.2 Operational level ... 17
2.7.3 Technological level ... 17
2.7.4 Object level ... 17
2.8 Conclusion ... 18
3 Building Information Modelling ... 21
3.1 Views on BIM ... 22
3.1.1 Data ... 22
3.1.2 Technology ... 25
3.1.3 Asset life cycle ... 26
3.1.4 Collaboration ... 26
3.1.5 Definition ... 27
3.2 History ... 27
4 Schiphol GIS ... 31 4.1 Data exchange ... 33 4.2 Data model ... 34 4.3 BIM ... 36 4.4 Topography ... 37 4.5 Recommendations ... 38 4.6 Conclusion ... 40
5 Asset Information Life Cycle ... 43
5.1 Use case ... 43
5.2 Life cycle views ... 44
5.3 Problems ... 45
5.3.1 Life Cycle Perspective ... 46
5.3.2 Organizations and People ... 46
5.3.3 Systems and Software... 46
5.3.4 Data and Objects... 47
6 Solutions ... 51
6.1 Life Cycle Perspective ... 51
6.2 Organizations and People ... 52
6.3 Systems and Software ... 53
6.4 Data and Objects ... 57
6.5 Prototyping ... 60
7 Conclusion and recommendations ... 65
7.1 Conclusions ... 65
7.2 Recommendations ... 67
7.3 Reflections ... 68
8 Bibliography ... 71
Appendix
Appendix A People spoken with for information on Schiphol GIS Appendix B Data mddel Schiphol GIS
1
Introduction
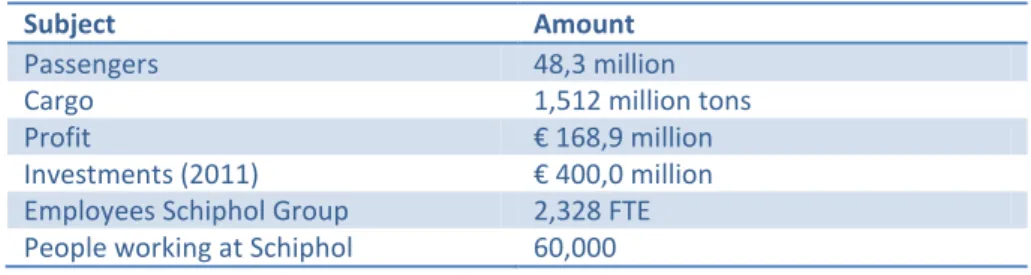
Amsterdam Airport Schiphol, from this point forward also referred to as Schiphol, has set herself the ambition of becoming Europe’s preferred airport. The numbers that are the foundation for this ambition can be found in table 1. To achieve this ambition activities such as design, build, operate and maintain must be executed in the most efficient and effective manner. An emergency situation several years ago showed that information about assets was not easily accessible. There were over 70 information themes in four different systems and the information in those systems was not consistent. Also it was necessary to switch between different systems to get a complete overview of a situation. Information was kept up-to-date within different departments, each with their own focus.
Subject Amount
Passengers 48,3 million
Cargo 1,512 million tons
Profit € 168,9 million
Investments (2011) € 400,0 million
Employees Schiphol Group 2,328 FTE People working at Schiphol 60,000
Table 1. Overview of the quantities of people and freight that yearly pass at Schiphol (Schiphol Group, 2011a; Schiphol Group, 2011b)
The emergency situation led to the discovery that the previously described situation was no longer workable and a project called ‘Facilities Unveiled in a Spatial Environment’ was started. The project resulted in a centralization of information departments into the department ‘Asset Information Management’ and initialized a new system that should replace most of the existing information systems, i.e. ‘Schiphol Geographical Information System’ or SGIS. The department has four focus areas and each focus area has its own section:
Asset Geographical Information (AGI) Asset Maintenance Information (AOI) Asset Document Information (ADI) Asset Consumption Information (AVI)
The aim of the new department is to simplify the system architecture as much as possible and to integrate and link both systems and data as much as possible. This should finally result in an information system with one central access point, offering “one view for all”.
Recent developments in the department have shown that both the delivery and the processing of changes are not optimal and should be approached as a total process from design to build to maintenance and back to design, i.e. asset information life cycle.
Secondly, Schiphol has become interested in a new development within the building industry, called BIM (Building Information Modelling). Schiphol would like to know what BIM means and what it entails for the purpose of developing a strategy on how to deal with it and to make a choice to adopt it or not.
1.1
Research questions
The objective of this research is to find an answer to the question: “What is necessary to complete the asset information life cycle in terms of data exchange, related to BIM and the current situation at Amsterdam Airport Schiphol?”
The main research question will be answered by researching the following sub-questions: What is data exchange and which relevant aspects can be distinguished? What does BIM encompass?
What is SGIS and how can it be related to the asset information life cycle and BIM? Which problems should be overcome in completing the asset information life cycle? What are possible data exchange solutions to complete the asset information life cycle? What is needed for Schiphol to make the proposed solutions effective?
The outcomes of the first three questions will be of great influence on researching the answers for the last three questions.
1.2
Methodology
This research is not conducted according to a standardized methodology, such as agile of prince2. However each step was carefully considered and is described hereunder.
1. The first step is a literature research towards the basic principles of data exchange. The aim of the research as such is not to come up with a new solution, but to present what needs to be taken into account when data is exchanged and to come up with multiple strategies applicable for specific situations.
2. Secondly a literature research towards the meaning and contents of the concept BIM is conducted. Attention is paid towards the history of BIM, explanation of the acronym BIM, literally and figural, applicable standards and future developments.
3. SGIS is/will be the centre of information exploration at Amsterdam Airport Schiphol. Within this step it will become clear what SGIS is and how it relates to the daily tasks of Schiphol. The data model is looked at and also the ideas behind the past and future developments as well as the goal and aim of SGIS. The last two topics are researched by studying available documentation and by having conversations1 with those currently responsible for SGIS within Schiphol.
4. Based on the outcomes of the three previous steps, an analysis is made on how a system setup like SGIS can be related to the asset information life cycle. Knowing how such a system relates to the asset information life cycle will also give information on where the problems are located that need to be overcome to complete the cycle.
5. With the input from steps 1, 2 and 4, possible solution(s) will be proposed to overcome the encountered problem(s). The offered solution(s) will be compared, if necessary, and the solution that suits the situation at Schiphol best will be selected.
6. The last step researches what is needed to implement the suggested solution(s) for completing the asset information life cycle.
1.3
Other research
At the start of this thesis research, two students from the faculty of Architecture of the TU Delft have conducted a research at the department ‘Terminal Real Estate’, resulting in a possible strategy direction for the adoption of BIM (Vollebregt & Vos, 2012). Both this research and the research by Vollebregt and Vos were conducted partly parallel, but fully independently from each other. This has caused different views on a few topics, due to different backgrounds and experiences.
The research question Vollebregt and Vos looked at was: “How can Building Information Modelling be a mean to optimise and to integrate the building process and the Facility Management during the complete
1
The conversations have not been recorded and no transcript has been made. Some notes were made during the conversations. A list of the people spoken with, including their role and a short explanation of the topics spoken about, is available in Appendix A.
life cycle of a building in a dynamic and complex environment with multiple stakeholders?” And although their focus was Schiphol wide, the research centred around the department ‘Terminal Real Estate’. The solution Vollebregt and Vos propose is to purchase an ‘off-the-shelf’ BIM system that will replace all the current systems within Schiphol. Within their research they specifically mention that it needs to be considered to terminate the SGIS implementation, because it does not meet the user requirements on the level of detail.
The BIM system they propose in fact is a Central Information System (CIS) and the requirements for the systems have been defined based on seven themes, i.e. Information Flows, Building Life Cycle, Facility Management, Project Management, Complex Environment, Dynamic Environment and Multi-stakeholder, that are compared to two different views, i.e. management and structured information flows. The Central Information System should exist of two copies: a Release-BIM that contains the as-is situation and a Project-BIM that can be mutated during construction projects.
In relation to the implementation of the CIS they mention that the users will not automatically adopt the new system and use it the way it is meant to be used. Secondly they think that it will take a long time before the users have gotten accustomed to the new system. Finally they suggest that it is important to keep listening to the users and their needs, because not listening to the users was one of the main reasons earlier ICT related projects have failed.
Together with this research, another research started within the AGI department that aimed to look at the third dimension. The question was whether there was a need for 3D within the Schiphol GIS data model based on user requirements and on the other side what additional possibilities 3D data offers above 2D data. The last focus on the research should take the technical demands in consideration. Based on these three aspects an advise towards a further development of the third dimension for SGIS should be given. This research was initiated twice, but unfortunately both times the assignment was returned at the start of the research. Although most aspects towards 3D are not within the scope of this research, some elements of 3D will be paid attention to.
1.4
Reading instructions
The next chapter (chapter 2) deals with the basic principles of data exchange. The chapter not only offers insight in the different aspects of data exchange, but also offers different strategies for data exchange and a framework for data exchange interaction. Chapter 3 provides an introduction in the concept of BIM. Different views on the topic will be explained and a short history on the emergence of BIM is also provided. Information on SGIS is provided in chapter 4. Here attention is paid towards the past and future ideas of SGIS and how it relates to the asset information life cycle. The following chapter (chapter 5) describes the use case that provided a test dataset for this research and the problems that are encountered in the asset information life cycle. The last chapter (chapter 6) will provide different solutions for the encountered problems. A selection of the proposed solutions is analysed towards the necessities for implementing them. Also an explanation is offered towards the executed prototyping. At the end (chapter 7) conclusions and recommendations are offered.
2
Data exchange
It was not long after the introduction of computing that people wanted to start with re-using data. The reasons for re-using data are countless, just like the problems that were, and still are, encountered when data is re-used. It is common knowledge that despite all efforts in standardization and technological evolution, too many barriers still exist for a fluent re-use of data. This chapter looks at the different aspects of data that are of influence in a data exchange and also proposes strategies for data exchange as well as a framework to support the data exchange.
There are two important aspects of data exchange that will not be looked at within this chapter, i.e. data quality and auditability. Auditability refers to the verification of a dataset. It is often hard to find out whether the data has been verified or not, which might cause quality issues. The data quality by itself can be described from many different angles, such as the geometrical accuracy and correctness of the attributes. For the exchange itself, data quality does not have to be an issue, it is the use after the exchange that might cause troubles, especially when data needs to converted (via an automated tool). For the purpose of this chapter we assume that the quality of the data is in order and that the data is verified.
2.1
Share or exchange
Within literature two terms are widely used to describe the activity of handing over data with the intention of re-use, i.e. sharing and exchanging. And although both terms have distinct meanings, they seem to be used at random. Both situations deal with giving something as the original owner to another, however in an exchange an equivalent will be expected in return, whilst sharing implies that nothing is expected in return (Merriam-Webster, 2012a, b). From this point forward the term exchange will be used because the use case data within this research comes from a contractual delivery.
2.2
Data characteristics
Data exchange is about the re-use of data and information with the purpose of cost savings and quality improvement (Du, Lai, Cheung, & Cui, 2012, p. 90). To enable this multiple use of a single source, datasets have to be shared or exchanged. However, a particular source data set is in a specific file format and has its own characteristics, e.g. it is designed for a certain purpose and gives a predetermined representation of real world phenomena (Heywood, Cornelius, & Carver, 2006, p. 32). The moment this dataset is obtained by others it is possible to re-use the data. However, a Dutch writer and poet stated that “in between dream and achievement, laws are in the way as are practical objections” (Elschot, 1910). This also applies to the re-use of data. And although legislation can be a problem in the (international) exchange of data (Angeles, Corritore, Basu, & Nath, 2001), the actual problems (practical objections) lie elsewhere and are complex by nature.
To use a dataset, it must be known what real world phenomena it represents and how they are represented. This information is described by a combination of characteristics of a particular dataset and the objects present within that dataset. The characteristics can be classified in different categories. Bishr (1998, p. 301) presents data as a 3-tuple, i.e. thematic attributes, geometric attributes and identification, or a 4-tuple that also includes the temporal dimension. These characterizations can be grouped as the structural elements of a dataset, whereas syntactic and semantic elements complete the description of a dataset (Peachavanish, Karimi, Akinci, & Boukamp, 2006, p. 73). Here the syntactic elements refer to the data- or file format and the semantic elements place the data in a context giving meaning to the objects within the dataset. Van Oosterom and Stoter (2010) suggest that not only space and time should be seen as dimensions, but that scale should also be integrated as one of the dimensions of data. The reason therefor is that a change, in geometry, time or attribute, might only be interesting when the data is looked at from a particular scale. Since many datasets are used over different scales, I think that this argument is valid. Brodeur et al (2005, p. 676) approach the data from its context and distinct the intrinsic properties,
i.e. identification, attributes, geometries, temporalities and domain, and extrinsic properties, i.e. semantic, spatial and temporal relationships, of a dataset. Hereby the intrinsic properties describe the object itself and the extrinsic properties describe how they relate to the external environment. The intrinsic properties are contained in the structural elements described by Peachavanish et al, whilst the extrinsic properties are included within the semantic elements. A suggestion that these semantic elements can be seen as a sixth dimension in multi domain use of a database (Van Oosterom & Stoter, 2010) is understandable, but in my opinion not correct. This is because, by nature, the meaning of an object stays the same only different terminology can be used over multiple domains. I would rather classify semantics as a ‘domain’-interpretation than as being a representation of an additional dimension.
Therefor I propose a relationship between the elements of a dataset as is shown in figure 1. In contradiction with Brodeur et al (2005, p. 676) I see domain as an extrinsic property instead of an intrinsic property, because domain tells something about the original (development and) use of a particular dataset and in that sense it tells something about the exterior of the dataset and not about the object itself. The figure shows that the structural and semantic elements are related, because the context that is provided by the semantics turns the structural elements into information, which makes it possible to use and understand the dataset unambiguously. The syntactic elements put constraints on the structural elements, because the file format limits the structure of the data model in terms of geometry, e.g. the support of 3D primitives, attribute types, e.g. date, integer and text, and software use.
All datasets are contained in a data model. The data model is the relation between a real-world phenomenon and the characteristics (syntactic, structural and semantic) that describe this phenomenon. A description of a data model is often separated in a technical description, containing the syntactic and structural characteristics as well as how the data is (or needs to be) collected, and a formal description, i.e. the semantic characteristics, of the real-world phenomena it represents. Many data models lack this last description, which makes it harder to interpret and understand the contents of a certain dataset. Having clear knowledge on the meaning of the real-world phenomena “is crucial in good information flows
between various actors” (Van Oosterom, 2013).
2.3
Communication process
Before any dataset can be re-used, it must be exchanged first. The exchange of data can be compared with the human communication process that always consists of three components, i.e. a sender, a receiver and a message (Schramm, 1971; Brodeur, Bédard, & Moulin, 2005). The message in this case is the data. Nedovic-Budic and Pinto (2001, p. 296) look at data exchange as a transaction, where the data itself can be seen as “currency”. Although the figurative way of explaining the process of data exchange differs, both explanations share the same components, i.e. a sender, a receiver and a message, in the case of data exchange being a dataset. The difference between the communication process and a transaction is that a communication process can be an on-going activity, whilst a transaction is a (recurring) one-time event. In that sense, a communication process can be looked at as a series of transactions. From this point forward a data exchange will be looked at as a transaction.
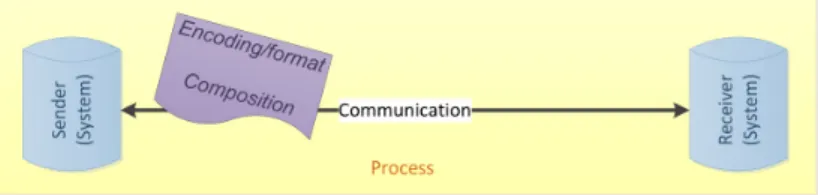
Farrés (1992, p. 16) does not look at the sender and the receiver as such, but distinguishes four parameters in the data exchange process. Two of those parameters are included in the message, i.e. encoding/format and composition. The third parameter, communication, involves the interactions between sender and receiver. The fourth and last parameter Farrés describes is process. The components
Figure 1. Overview of the characteristics of a dataset that together create the representation of real world phenomena.
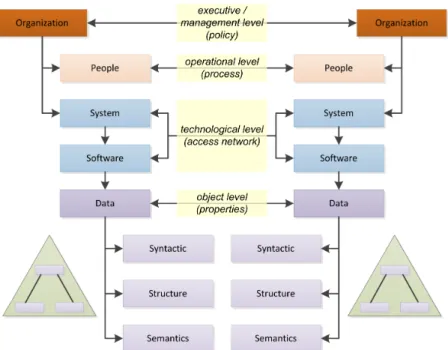
previously mentioned by Brodeur et al (2005) are all contained within this last parameter. When I combine these four parameters and the previously mentioned components, I get a process that includes the sender and receiver, the communication between both, and the characteristics of the message, as can be seen in figure 2. The proposed setup in the figure supports the functions of data transfer, data transformation and translation, and the interactions between the sending and receiving systems (Banerjee & Golhar, 1994, p. 66).
When I compare the message properties from figure 2 with the characteristics of a dataset in figure 1, it becomes clear that the syntactic characteristics are described as encoding/format and the structural and semantic characteristics are included within composition, where format and encoding describe the file. In most cases these are the same, especially with native file types, but sometimes a format can have multiple encodings, e.g. IFC can be encoded in STEP or XML.
Figure 2. Overview of the four classification parameters for data exchange, proposed by Farrés (1992, p. 16), integrated in the data exchange process.
Communication, in terms of data exchange, describes how the message is sent and can be split in two main categories, i.e. direct and indirect. For example, direct communication within a human communication process can be seen as face-to-face or a performance in front of a crowd, whilst indirect communication can be a letter or watching a video or DVD. Direct communication in a data exchange happens via an electronic connection from one system to another, e.g. internet or network connections. Indirect communication implies that there is no direct interaction between a sender and a receiver. As a result data needs to be stored or loaded from a source before it can be used, e.g. files via e-mail or data carriers. Direct data connections can be subdivided in on-demand and real-time connections. The former happens when data is approached at the moment that is needed whilst the latter can be used in, for example, sensor networks. Some examples of different communication means are shown in table 2. Within the table there is no distinction made between on-demand and real-time interactions.
Besides data, the communication means should also contain a description of the data sent. This description can be compared with the non-verbal communication in a human communication process and functions as metadata that inform the receiver about the extrinsic properties of the data(set).
Direct communication means Indirect communication means.
(Web) service Network connection E-mail EDMS
ODBC connection Peer-2-peer USB flash-drive Download
Internet Live feed CD-rom / DVD Hard drive
Table 2. An overview of possible communication means, classified to direct or indirect communication.
The way data is received is of influence on how the data can be used. To know when to use which communication means is one of the keys to success. Within literature these communication means, and others, are often presented as unique concepts. However, terminology to describe these concepts, again, seems to be used randomly. Due to this, it can be expected that problems will arise when sender and receiver do not align their expectations up-front (Benjamin, de Long, & Scott Morton, 1990, p. 31).
2.4
Interoperability
It often happens in direct data exchange, that problems arise in the communication between two (intra-/inter-organizational) systems. This kind of problems is often referred to as interoperability (Naudet,
Latour, Guedria, & Chen, 2010). Looking at the literal meaning of inter-operate, it implies that two systems can perform operations on each other (Chen, Doumeingts, & Vernadat, 2008), therefor it is necessary that both systems understand each other. When comparing interoperability to the human communication process, as was done with data exchange, interoperability is about an equal understanding of the message (Brodeur, Bédard, & Moulin, 2005, p. 671) or as being “in tune” (Schramm, 1971). To achieve this in a direct data exchange, the encoding of the message must be “machine readable” and the composition must be “well structured” (Banerjee & Golhar, 1994, pp. 65-66; Angeles, Corritore, Basu, & Nath, 2001, p. 329 after: Chen and Williams, 1998). It is obvious that interoperability issues can also occur with indirect data exchanges. In that case demands towards machine readability and structure of the message are less relevant as a particular dataset is not interpreted by a machine directly.
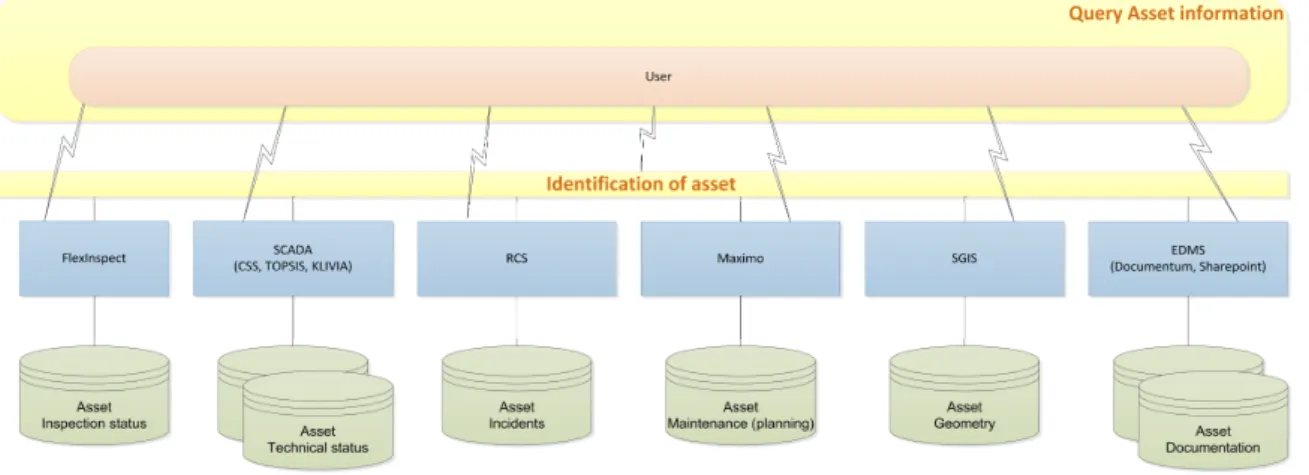
Figure 3. Example of how a system architecture can look like. (Source: Schiphol)
To understand the problems of interoperability it is important to know that a system is seen as one or more interacting elements (Naudet, Latour, Guedria, & Chen, 2010, after: Von Bertalanffy, 1968). As such, an element can be a single package of software as well as a set of (software) applications functioning as a whole. Other elements within a system can be hardware components, persons, policies and services (Naudet, Latour, Guedria, & Chen, 2010). The blue print for how the elements within a system need to work together is called architecture (Chen, Doumeingts, & Vernadat, 2008), see figure 3 for an example. The easiest way to compare two systems with each other, is to compare their architectures. The chance that two single systems within two different organizations are alike, are very small (Crook & Kumar, 1998, p. 76; Angeles, Corritore, Basu, & Nath, 2001, p. 338). However, when the individual elements from two systems are compared, chances will be higher that equal or alike subsystems can be found, which improves the chance for a successful data exchange.
Since the majority of systems are different, the communication and the level of understanding of one another’s messages will be different too. The levels of interoperability between two separate systems range from incapable of communication to seamless communication. And although Jardim-Goncalves and Grillo (2010) claim that the latter “remains elusive”, it is the ultimate goal to reach (Peachavanish, Karimi, Akinci, & Boukamp, 2006, p. 73). I think that seamless communication is not that far away, because formerly isolated worlds (GIS and AEC) are starting to look at each other and started adapting each other’s technologies (Van Oosterom, Stoter, & Jansen, 2005).
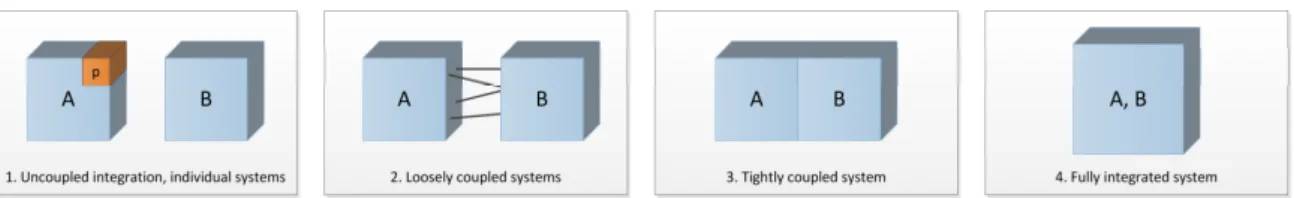
Within a system, it is also important how subsystems are integrated. Vernadat (2010, p. 140) distinguishes three levels for system integration, i.e. “loosely coupled”, “tightly coupled” and “fully integrated” (see figure 4, respectively image 2, 3 and 4). The difference between the three levels can be found in the way the partial subsystems still can be identified as an individual subsystem. Loosely coupled systems function on their own, whilst it will not be possible to distinguish between subsystems in fully integrated systems (Chen, Doumeingts, & Vernadat, 2008). Tightly coupled systems are a hybrid, where subsystems are fully
integrated, but still distinguishable. It can be expected that the creation of a fully integrated system will cause more interoperability issues than creating a loosely coupled system.
Figure 4. An overview of the different system integration levels. (After: theory: (Vernadat, 2010); image: (Succar, 2009)) Note: the orange part in the first image represents a plugin.
Another approach can be the development of a parallel system (Chen, Doumeingts, & Vernadat, 2008). Having two identical copies of (sub)systems should not cause any interoperability issues at all, however such a solution requires intensive organizational co-operation. Before such a step would be taken details have to be looked at also, because even a different version of the same software can be a cause of interoperability issues.
In my opinion it can be stated that interoperability issues in a data exchange can occur at all levels of parameters, characteristics, elements and properties. Knowing that, it is to be expected that a combination of solutions need to be applied to overcome these interoperability issues, although this may lead to additional problems (Farrés, 1992, p. 19).
2.5
Standards
Standards have not really been mentioned before, but should (in theory) be the key solution for data exchange. However, the differences in the properties of data have been a source for standardization needs for decades (Goldstein, Kemmerer, & Parks, 1998; Peachavanish, Karimi, Akinci, & Boukamp, 2006) and not one universal solution has been found yet. The problem is that there are some many different software packages, and even more formats and encodings exist, that it is hard, if not impossible, to come to a single solution. At the same time, the fact that these differences exist, is also the reason why standards are needed to overcome the differences.
Standards focus on a wide variety of solutions, e.g. geometry, data (exchange) formats, ontology descriptions, frameworks for data exchange, etc. However, there is not one single organization that focusses on these standards. For example, the Open Geospatial Consortium (OGC) and the Technical Committee 211 of ISO focus on handling spatial data, W3C establishes standards for internet related exchange and buildingSMART, together with ISO, creates standards for 3D modelling and semantics in the AEC industry. An optimal solution will require the cooperation of the different standardization organizations.
Often it is possible to distinct between proprietary and open standards. And although the use of open standards is widely promoted, especially in the public sector, proprietary standards still predominate. Knowing that most standards focus on a specific characteristic of data, makes it understandable that a working solution in data exchange should come from a combination of multiple standards (Farrés, 1992),. However, as stated before, combining multiple solutions, or in this case standards, can lead to additional problems (Farrés, 1992, p. 19). An example of how multiple standards can cooperate is given in figure 5.
A large group of standardization solutions looks at the development of exchange formats, which have led to open standards such as IGES and STEP in the 1970’s and 1980’s and XML, IFC and CityGML in the last
Figure 5. Multiple standards working together (Source: buildingSMART (2008))
two decades. These exchange standards were needed for two reasons: 1.) There are too many differences between individual formats to execute direct conversions (Brodeur, Bédard, & Moulin, 2005); and 2.) GIS data formats have never been designed to transfer update information (Badard & Richard, 2001, p. 19). Whilst exchange formats aim at a decrease of information loss in a data exchange, I think they add a significant risk of an increase of information loss, because an extra conversion has to be executed when such a format is used (see figure 6). Actually most of these exchange formats are not only a file format, but most also contain a data model with semantic meaning.
Figure 6. Data exchange process including the use of an exchange standard.
Open standards also offer a lot of possibilities but I can say from my personal experience that they are insufficiently supported by software vendors, e.g. IFC and (City)GML. Until this changes, open standards will possibly support a workable solution, but will not offer the complete solution that is needed. In my personal opinion software vendors should stop developing their own proprietary data formats and start working on a single CAD and GIS format that is easy exchangeable. Software vendors can then distinguish by the functionality their software offers, the user friendliness and the performance of their software. Another solution, based on open standards, combines RDF (Resource Description Framework), URI’s (Universal Resource Identifiers) and OWL (Web Ontology Language) (Curry, O'Donnell, Corry, Hasan, Keane, & O'Riain, In press). This way of working is also called “linked data” because objects can be linked to other concepts since their definition is clear in all aspects. One of the disadvantages of this approach is that it is designed for cloud data services and it can be questioned whether it is applicable within an organizational setting such as Schiphol, where security of information and data is a great cause. Secondly this method focusses on the exchange in a sense that it adds a layer between source and target datasets and does not offer a solution in terms of direct conversion.
A possible application of linked data in the Netherlands is the development of a Library of Concepts, that has the potential to become a standard by itself. This library gives a “generic and re-usable definition”, i.e. semantic, of objects and uses this description throughout the full life cycle of that object. The library is built up based on existing standards and a concept version is already available. The Library of Concepts is compatible with the most relevant standards within the Netherlands and Europe, being INSPIRE, IMGeo, NLCS and NEN2767, but also takes into account worldwide standards like IFC and the buildingSMART
Data Dictionary (bsDD). It is expected that a first final version will be realized within two years (BIR, 2012). The biggest advantage of this library is that, if it is applied, information can be easily transferred between the different life cycle stages by its semantic meaning. However, this does not necessarily solve the issues of converting geometry.
Figure 7. Famous cartoon on different interpretations of the same concept, linked data has the potential to resolve this problem. (Source: Unknown)
Allthough the use of (open) standards in practice differs from the ideas in the scientific world, it is without a doubt that standards are needed to overcome current issues between the worlds of AEC and GIS. Therefor it will be necessary to use existing standards and work from that point forward to new standards (Van Oosterom, 2013) to overcome existing barriers.
2.6
Data usage
Before any solutions for (possible) interoperability issues can be offered, I am convinced that it is necessary to look at the question: “How is the data(set) going to be used?”. That is because the use of a dataset influences the need for interoperable solutions. Although user requirements have been mentioned multiple times in literature as an important aspect to take into account when data is used or exchanged (Umar & Teichroew, 1990, p. 149; Reeve & Petch, 1999; Rajabifard, Feeney, & Williamsen, 2002, after: Rogers, 1993), the way a dataset will be used has not been described as such yet.
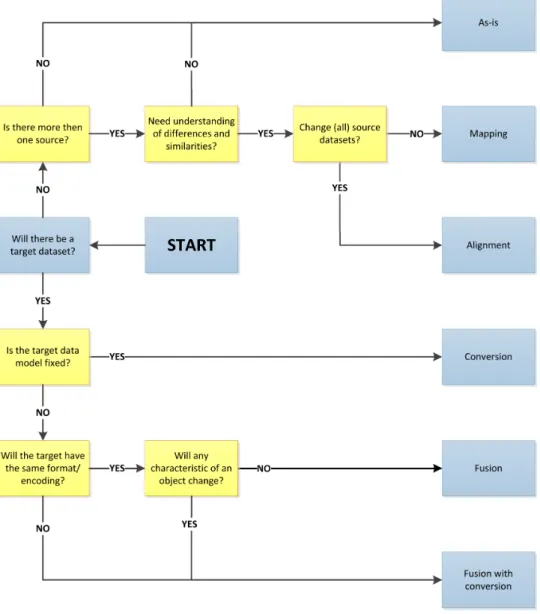
I propose three different ways of data usage, i.e. as-is, integrated or converted. With both as-is and integrated data use, a particular dataset can be used the way it is received, independently of how the data is received. The difference between these two ways of data use can be found in the way data is used within an application. As-is data is used within the same system environment as it was created, being its native software. When as-is data is used within an another system environment, without the need to convert it, the data use is integrated. If any aspect, being an element, property or characteristic, of a dataset needs to be altered before it can be used, it is called converted data use.
2.6.1 As-is data use
As-is data use is the most beneficial use of a dataset, because nothing has to be changed and the data can be used directly. As-is data can be used for all kind of different activities, such as map making (when the data has a geographical component), reporting, editing, analysis, etc. The advantage of as-is data use is the fact that the data is used within its original system environment, enabling all the functionality that the original environment offers.
Updating an existing database with a dataset that contains data in the same data model, i.e. data interchange, is an explicit example of as-is data use. Since target and source dataset share the same data model, it is easy to locate the changes and to update the target dataset.
2.6.2 Integrated data use
The concept of integration is often referred to as being seamless conversion (Van Berlo & De Laat, 2011, p. 213; Wu & Hsieh, 2007, p. 1085) or as “semi-automated conversion” (Peachavanish, Karimi, Akinci, & Boukamp, 2006, p. 72). Both explanations are understandable but in my opinion not correct, simply because of the use of the word “conversion”. Integration should be explained as the use of a dataset in its original format, encoding and composition, in a different system environment than it was created in, e.g. the use of a dwg-file (AutoCAD drawing) within ArcGIS. Because the system environment differs from its original environment it is possible that interoperability issues arise. It is possible that data is displayed in another way or that certain information will not be visible or interpreted differently by a foreign system. Also, most examples of integrated data use only support the activity of reading data and not editing it, but there are exceptions, e.g. multiple GIS datasets can be edited and stored with AutoCAD Map 3D. Integrated data use can be useful to compare datasets from different sources within one application. Often a plugin is required to make it possible to use foreign datasets within a system, but this is not always the case.
These examples are really about integrated data use and differ from integrated systems as described earlier (see paragraph 2.4). Therefor I suggest to add another category of system integration, being uncoupled integration (the first image in figure 4). With uncoupled integration data is used over more than one application but without an actual integration of the applications.
The major advantage of integrated data use is that datasets can be used in their proprietary formats, but within a foreign system environment. In this case it is not necessary to convert data and therewith the risk of information loss is eliminated or at least limited to a minimum. A disadvantage can be that within the foreign system environment not the same (read: probably less) tooling and functionality is available. However, since the data is in its original encoding and composition it still can be used in its native environment, eliminating this issue.
2.6.3 Converted data use
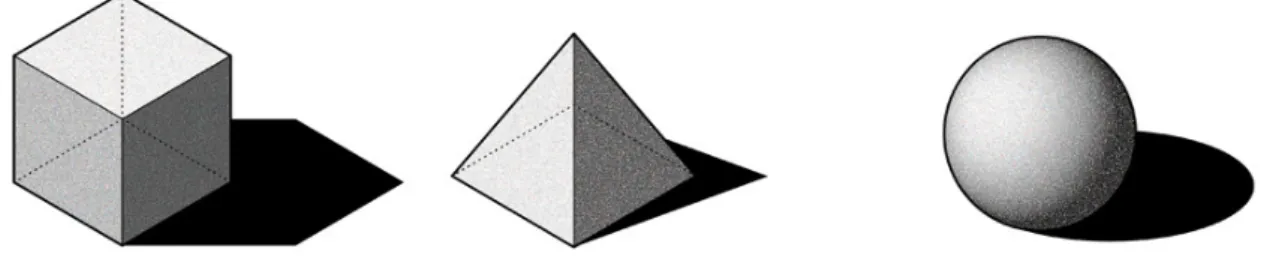
If it is not possible to use a dataset as it was received, it needs to be converted. When a dataset is converted, there is always a risk of losing information, because changes need to be made to the dataset. These changes can include any of the characteristics (see figure 1) of the source dataset. To determine these changes in a dataset, it is of up most important to understand both the source and target dataset and their data models. Two examples of possible challenges are shown in figure 8 and table 3. The first example shows geometrical challenges that are likely to be overcome. However situations where a source object has a lower dimensional level than the target object, e.g. a point that has to become a polygon, are of a different order and need additional information.
Table 3, the second example, shows schematic challenges. The situation described in the first and second row of this table will probably cause limited to no problems. The other three examples in the table however, are expected to cause serious issues in the conversion, because source and target characteristics do not match. Considering all the possible issues, makes it easy to understand that the costs for data conversion must not be underestimated, as they can increase quite fast (Umar & Teichroew, 1990, p. 150). Depending on experience, differences in characteristics between source and target datasets, available resources and other factors of influence, a choice has to be made on how a conversion is going to take place. There are different (technical) solutions to choose from (table 4) and there are also different strategies for conversion (table 5). Both, solutions as well as strategies, can be chosen independently from each other.
Looking at the conversion solutions, it is easy to say that the manual transformation is least favoured of all proposed solutions, since manual transformations are time consuming and do not guarantee that errors are excluded (Peachavanish, Karimi, Akinci, & Boukamp, 2006, p. 71). It can even be expected that manual transformations increase the risk of error-making. Another problem is that different users might make different choices when converting data, which makes the conversion inconsistent. From that perspective automated conversions are favoured above manual transformations. The expected advantages include faster execution and a lower amount of errors. But most of all, automated conversions offer the possibility of use. This means that a conversion between two datasets only has to be created once and can be re-used every time the same situation comes back again.
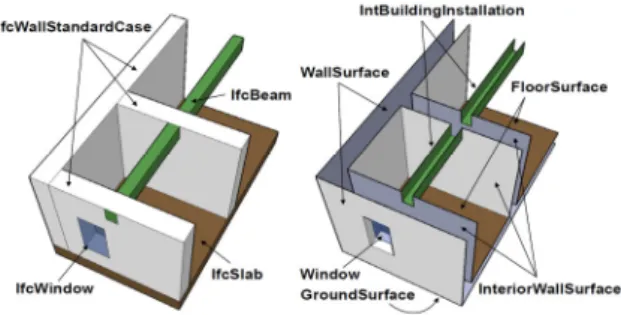
Figure 8. Different (geometrical) representations between IFC (left) and CityGML (right) used for the same objects (Nagel, Stadler, & Kolbe, 2009, p. 50).
Source Target 1. Entity vs. Entity 2. Attribute Attribute 3. Entity Attribute 4. Attribute Entity
5. Completely different representations
Table 3. Classification of schematic heterogeneity. After: Bishr (1998)