DICOM-based computer-aided evaluation of intensity modulated
radiation therapy (IMRT) treatment plans
Fion W. K. Cheung
a,b, Maria Y. Y. Law
ba
The Queen Elizabeth Hospital, Hong Kong, China;
b
The Hong Kong Polytechnic University, Hong Kong, China
ABSTRACT
Intensity-modulated radiation therapy (IMRT) has gained popularity in the treatment of cancers because of its excellent local control with decreased normal tissue complications. Yet, computer planning for the treatment relies heavily on human inspection of resultant radiation dose distribution within the irradiated region of the body. Even for experienced planners, comparison of IMRT plans is definitely cumbersome and not error-free. To solve this problem, a computer-aided decision-support system was built for automatic evaluation of IMRT plans based on the DICOM standard. A DICOM based IMRT plan with DICOM and DICOM-RT objects including CT images, RT Structure Set, RT Dose and RT Plan were retrieved from the Treatment Planning System for programming. Utilizing the MATLAB program language, the decoding-encoding software applications were developed on the basis of the DICOM information object definitions. After tracing the clinical workflow and understanding the needs and expectations from radiation oncologists, a set of routines were written to parse key data items such as isodose curves, region of interests, dose-volume histogram from the DICOM-RT objects. Then graphical user interfaces (GUIs) were created to allow planners to query for parameters such as overdose or underdose areas. A total of 30 IMRT plans were collected in a Department of Clinical Oncology for systematic testing of the DICOM-based decision-support system. Both structural and functional tests were implemented as a major step on the road to software maturity. With promising test results, this decision-support system could represent a major breakthrough in the routine IMRT planning workflow.
Keywords:DICOM, knowledge-based, computer-aided, decision-support, radiation therapy
1.
INTRODUCTION
1.1 Intensity-modulated radiation therapy (IMRT)
Intensity-modulated radiation therapy (IMRT) is the current popular radiation therapy technology that allows the modulation of radiation dose to shape the desired dose to the tumour target volume. With such a plan, it allows the safe delivery of a high dose to the tumours of irregular shapes with maximal sparing of the surrounding structures.1,2 Improved disease control through such dose escalation along with reduction in dose to the neighbouring structures might give IMRT a clear advantage over other technologies in radiation therapy such as three-dimensional conformal radiotherapy (3DCRT). Renowned for its dose-sculpting ability, IMRT has gained increasing popularity for treating concave-shaped targets and other more complicated dose delivery methods.
1.1.1 IMRT planning process
IMRT needs a precise 3D representation of the patient anatomy, which requires extensive use of multimodality imaging. IMRT planning includes delineation of tumour targets, organs at risk (OARs). To provide clear guidelines for IMRT planning, well defined site-specific treatment protocols are often set out by radiation oncologists. Encouraging therapeutic outcomes could only be achieved when the exact location and the tumour extension could be accurately defined with respect to all OARs. Manual slice-by-slice delineation is one of the most tedious and time-consuming tasks in IMRT planning. Continuous efforts have been made to develop automatic segmentation algorithm for delineating different structures. 3,4
IMRT incorporates two novel features, namely, computer-controlled intensity modulation of treatment beams and inverse treatment planning optimization. With this approach, each radiation field is firstly divided into multiple pencil beams enabling custom-design of optimum dose distributions. Inverse planning starts with the required dose distribution and a set of planning parameters. By taking all dose volume constraints imposed on the targets and OARs into account, the desired intensity pattern is achieved through iterative adjustment of individual beamlets by the dose calculation algorithm for IMRT of the Treatment Planning System (TPS).
1.1.2 IMRT plan evaluation
Upon completion of dose calculation, each plan should be evaluated carefully using dose volume histograms (DVHs) and planar dose distributions that show the isodose lines. The determination of the best plan requires a clinical decision based on the balance between adequate target coverage and normal tissue sparing. Dose to critical structures should not exceed their tolerable limits or constraints that are set in the protocols. A resultant IMRT plan that cannot meet the plan acceptance criteria in the protocols is judged to be unqualified. Despite lacking spatial information, DVHs provide a global view of whether the resultant plan meets the set limits. On top of that, a detailed slice-by-slice analysis of isodose distribution is crucial in examining target coverage and identifying the exact location of hot and cold spots. Owing to unconventional nature of IMRT dose distribution, special caution should be paid to the unconstrained normal tissues which may receive unexpected high doses. If the IMRT plan is regarded as unacceptable, either the dose volume constraints or priorities can be adjusted reiterately to re-optimize the intensity distribution.
As shown in figure 1, each IMRT plan has two primary concerns –target coverage and normal tissue sparing. A key goal of IMRT is to minimize complications to normal tissues by decreasing the dose to OARs while maximize tumor control by increasing the dose to planning target volume (PTV). The development of a clinically acceptable plan usually takes several iterations of refinement depending on complexity of the case and experience of the planner. To obtain a better plan, the optimization and evaluation loop can continue until no further improvement is required.
Figure 1. IMRT plan has two primary concerns – target coverage and normal tissue sparing. With the aim of better planning target volume (PTV) coverage and greater organs at risk (OARs) sparing, an IMRT plan continues to refine through a series of optimization iterations.
1.1.3 Major challenges and pitfalls
Currently available IMRT planning systems rely heavily on human inspection of resultant dose distribution. When judging the plan quality, the need to interpret such meticulous statistics has prompted the development of intelligent tool for automated dose-volume data analysis. Even for experienced planners, identification of hot and cold spots from pertinent CT slices is definitely cumbersome and not error-free.
2.
PURPOSE
To save planners from tedious manual evaluation, a computer-aided decision-support system was built for automatic evaluation of IMRT plans based on the DICOM standard. The system aimed at improving the planners’ efficiency and
accuracy in evaluating an IMRT plan that met all dose volume constraints and identifying underdose and overdose regions on each CT slice.
3.
METHODOLOGY
The development of the DICOM-based decision-support system consisted of 3 stages: 1. Programme development, 2.Design of Graphic User Interface (GUI), 3. System testing.
3.1 Programme development
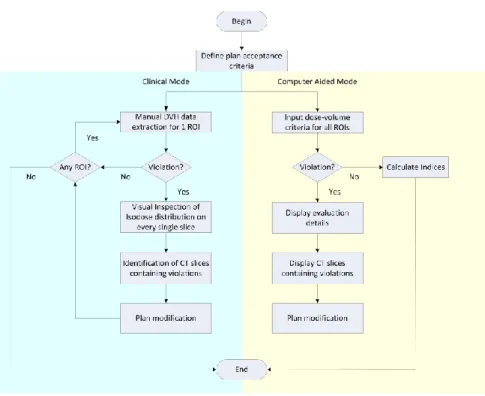
Detailed workflow analysis and modeling could provide a roadmap to successful programme development. Workflow models are valuable in understanding current operational process, identifying system requirements, visualizing the benefits after system implementation and defining the desired future situation. Figure 2 shows a comparison of conventional and computer-aided IMRT plan evaluation processes. The example of dosimetric evaluation of the right lens of the eye in IMRT for nasopharyngeal carcinoma (NPC) is used.
Figure 2. Comparison of conventional and computer-aided methods for evaluation of IMRT treatment plan.
Based on institutional practice and philosophy, diverse plan acceptance criteria could be put into practice. Clear goals for individual IMRT treatment plan should be defined at the outset. Association between the lens dose and radiation-induced cataract was well documented. From the literature, it was reported that the lens tolerance dose was 6 Gy.1,2,5
Conventional IMRT plan evaluation process required human inspection of violation of treatment protocols. As an initial step, the DVH statistics for the right lens was extracted for evaluation. If the results were unsatisfactory, it was necessary to visually inspect the isodose distributions on every single slice. In order to examine the anatomic location and extent of overdose, the right lens contours and 6 Gy isodose line were chosen for display.
The decision support system software was developed using MATLAB (The MathWorks, Inc., Natick, MA, USA) to facilitate evaluation of the plan data based on DVH and slice by slice analysis. To streamline the workflow, the two approaches were combined into one process in the programming. The 2D DVH curve of a given structure was
automatically linked to specific CT image slice overlaid with user-defined isodose line and contour of region of interest (ROI). Inthe main loop of the program, the following tasks were performed:
1. Loading an IMRT plan including planning CT images and pertinent DICOM-RT objects into MATLAB workspace
2. Input of dose-volume criteria as the plan acceptance guide (Figure 3). Each specific set of parameters can be saved as a template for future use.
3. Using the DVH data of the plan to check if the plan met the acceptance criteria, e.g. the lens should not receive more than 6 Gy radiation dose level
4. Displaying evaluation details and checking for violations of criteria
5. If violations detected, the CT slices containing the violations would be searched by the programme without user interactions. The dose level would be constructed and overlaid on corresponding CT images.
Figure 3. User-defined dose –volume criteria for right lens.
3.1.1 Hierarchical bottom-up searching design
Each patient being treated with IMRT must undergo a planning CT scan of the area of interest consisting of more than 100 slices. To allow efficient query processing over the massive image database, a hierarchical four-layered bottom-up approach was implemented. By breaking the ultimate goal down into more detailed sub goals, the algorithm ran in an upward direction towards the top of pyramid. The starting point for constructing a hierarchy was a comprehensive list of the tasks that make up a job. After identifying hierarchical relationship amongst the tasks, sequential instructions were executed in a bottom-up manner.
As shown in the figure 4, the searching of CT images subject to violation was decomposed into four subtasks. The hierarchical analysis started with the complete set of CT images by examining the presence of structure contours. With reference to the ROIContourSequence in RT Structure Set (in the DICOM standard), images containing OARs and PTVs were categorized as “CT images with OARs” or “CT images with PTVs” respectively. Pruning technique was then employed to progressively narrow down the search. Depending on whether OAR overdose or PTV underdose was present, a specific subset of images were evaluated and searched for pertinent CT slices subject to violations. This hierarchical structure aimed at quick access to query results and easy navigation of detailed information.
3.1.2 Algorithm for detection of protocol violation
At the first stage of violation detection, DVHs were useful in summarizing dose distribution data in a linear graph model to allow rapid screening of treatment plans. Each ROI was uniquely defined by ROISequence in RT Structure Set with a ROI number as shown in Table 1. In this example, the ROI number for the right lens was 35. By cross-referencing this number with DVHReferenceROISequence_Item1 in RT Dose object, the corresponding item number for the right lens was found to be 26. Based on this item number, DVH of the right lens was reconstructed by extracting data from RT DVH module in RT Dose object.
Table 1. Illustrating how to find the relevant item number for each region of interest (ROI).
To generate the DVH for a structure, the defined volume of ROI was partitioned into voxels. Dose for each voxel was then calculated and accumulated in the appropriate dose bin of the histogram. The ordinate for each point on the cumulative DVH curve represented the total volume of ROI that receives at least the given dose indicated on the abscissa. Assuming maximum lens dose was constrained at 6 Gy, figure 5 demonstrated how to directly read off the corresponding value represented by DVH.
Figure 5. Cumulative DVH curves for the right lens of two plans. The solid line corresponds to a qualified plan while dashed line corresponds to an unacceptable plan.
The plan represented by the solid line satisfied the constraint with maximum dose just below 6 Gy. Conversely, another plan represented by the dashed line resulted in unacceptable dose distribution. The maximum dose was 10 Gy, violating the planning goal. If any of the constraints were not met, detailed slice-based evaluation of isodose coverage was
required. The CT slice revealed that a sizable fraction of the right lens received dose exceeding the specified limit, a situation that warranted a modification of treatment plan due to unnecessary sacrifice of vision (Figure 6).
Figure 6. CT scan images showing the right lens contour and 6-Gy isodose line.
As well as OAR sparing, PTV coverage was also used as a criterion to evaluate. The ideal cumulative DVH for a target volume should appear as a horizontal line at 100% volume on ordinate with a vertical drop at the prescribed dose on the abscissa. In clinical reality, PTV volume coverage of at least 95% was generally required. The adequacy of target coverage could be evaluated by the shape of DVH. As illustrated in figure 7, plan represented by the solid line achieved acceptable target coverage with 95% volume of the PTV70 receiving at least 70 Gy. On the contrary, another plan represented by dashed line failed to meet the minimum requirement. Only 92% volume of the PTV70 was adequately covered as prescribed. To have a clear understanding of spatial locations of the undesirable hot and cold spots in PTV70, it was still necessary to review the isodose distribution.
Figure 7. Cumulative DVH curves for the PTV70 of two plans. The solid line corresponds to a qualified plan with acceptable target coverage while dashed line corresponds to an unacceptable plan.
3.1.3 Overdose and underdose regions extraction
Once the 3D dose distribution of an IMRT plan was calculated and ready for evaluation, the corresponding RT Structure Set, RT Dose objects together with a series of planning CT images were exported from the TPS and loaded into the computer-aided evaluation system (Figure 8). With the aim of improving tumor control while decreasing normal tissue complications, either underdosing (cold spot) within tumor or overdosing (hot spot) was undesirable. The quality of each treatment plan was critically evaluated before being implemented. With respect to specific dose volume criteria, the DVH statistics for each ROI should be evaluated separately. In order to examine the anatomic location and extent of hot and cold spots, the CT slices containing violations were searched by the programme and displayed.
Dose Structures: Images
OARs/PTV Treatment Planning System
DVH Data Violation? END No Yes Region detection Eye ball Tumor Image display
Figure 8. Region extraction model was designed around the concepts of DICOM and DICOM RT objects, including planning CT images, RT structure set and RT dose.
Extraction of both overdose and underdose regions was based on the edge-based approach. First of all, the boundary of the specified isodose line and ROI contour were plotted respectively. To reconstruct the outline of a structure, the evaluation system made use of the contour data stored in the RT Structure Set object. With the same frame of reference, each ROI was associated with reference to CT images. Proper ROI contour coordinate transformation including scaling and translation was necessary.
Since dose values were described as pixel data elements, grid doses in specified dose units were constructed by multiplying each pixel value stored in the Image pixel module with the Dose Grid Scaling attribute (3004,000E) in the RT Dose module of the RT Dose IOD. The voxel coordinates of RT Dose matrix with reference to CT images were found in the patient coordinate system as defined in CT scans.
The goal of IMRT was to deliver a dose distribution as homogeneous as possible within the PTV while sparing nearby OARs. Either overdose or underdose within targets should be penalized, whereas OARs only carried overdose penalties.
Concerning cold spots inside targets, the non-overlapping boundaries between the target contour and the prescribed isodose line were detected. On the contrary, the overdose regions were found by searching the overlapping boundaries between the defined structure and specified isodose line. The areas of both hot and cold spots on each CT slice were computed by counting the total number of pixel inside these regions respectively.
3.2 Design of GUI and system testing
Upon completion of establishment of the computer-aided software, user-centered GUI panels were designed based on the workflow of treatment planning in a radiation oncology department. MATLAB with a powerful GUI Development tool called GUIDE was adopted for quick and easy development of the user interface windows.
System development was an iterative process involving task analysis, design and testing. For testing of the system, a total of 30 IMRT plans were collected and anonymized. Using DICOM export in the Varian Eclipse treatment planning system (TPS) (Varian Medical System, Palo Alto, CA), the DICOM-based plans were then imported to the system using the GUIs. Both structural (clear box) testing and functional (black box) testing were performed to assess the system performance. Structural testing required detailed information about the structure of the system and subjected the individual elements of the system to independent examination. On the contrary, functional testing was concerned only with the inputs and outputs of the system, focusing on functionality against specification.
4.
RESULTS
The DICOM-based computer-aided decision-support system for automatic evaluation of IMRT plans was successfully developed. To illustrate the functionality of the computer-aided evaluation system, a sample IMRT plan for head-and-neck case was reviewed. An IMRT plan was evaluated based on its ability to meet the user-defined dose volume criteria. Considering a wide variety of treatment protocols available for adoption, a GUI panel allowing the creation of individual template was designed with flexibility in mind. Figure 9 is a screen capture showing how to set the plan acceptance criteria. To kick off the plan evaluation process, the user selected an anonymized patient folder. A series of planning CT images together with the corresponding DICOM-RT objects, namely the RT Plan, RT Structure Set and RT Dose objects were automatically loaded. The evaluation system provided two approaches to specify the dose volume criteria, allowing users to select an existing template or define a new set of parameters. If desired, all input fields can be saved for future use.
Figure 9. Screenshot of input data panel setting up all acceptance criteria for targets and OARs. The panel contains five buttons which initiate separate functions of the programme. Clicking on the first button will start loading of a particular IMRT plan into the system. The second button on the panel will open the existing template of dose volume criteria while the third panel button will save the inputs as template. The plan evaluation process will be proceeded by clicking on the fourth button. The rightmost panel button with cross sign will trigger a request to close the frame.
Through comparison with the user-defined constraints on a point-by-point basis, ROIs which failed to meet the acceptance criteria were listed. By selecting a specific ROI, the related DVH curve along with other useful indicators such as maximum, mean, minimum doses and standard deviation were calculated and displayed (Figure 9). The drop-down menu allowed the user to view a specific CT slice with overdose or underdose regions highlighted. The direct relationships between the DVH curve to the diagnostic CT images and the corresponding dose and structure contours were visualized.
Figure 10. Screenshot of treatment plan evaluation page. By choosing a particular z position from a drop-down menu, the user can quickly assess for the hot and cold spots. As an example, the DVH curve for brainstem and one DICOM CT image with 54-Gy isodose line and brainstem contour overlaid are displayed. Only the image slices with brainstem receiving dose greater than 54 Gy are extracted and listed for review.
Both structural testing and functional testing were implemented to assess the system performance. The computer-aided evaluation system allowed better appreciation of resultant plans. With prompt problem detection and correction features, the direct relationship between the DVH data to the corresponding CT images and RT dose data could be displayed simultaneously. Designated dose levels along with relevant contours and CT images were shown in a precise and efficient manner. Automation of plan evaluation process could maximize productivity and perfect the plan quality, further accelerating the adoption of IMRT in routine clinical practice. The system performance was satisfactory in terms of robustness, precision and reproducibility.
5.
CONCLUSION
With such promising evaluation results, this DICOM-based decision-support system is a major breakthrough in the routine IMRT planning workflow by eliminating all tedious manual evaluation steps. The system could be applied to treatment of different regions of the body and the concept could also be adopted in the evaluation of plans other than IMRT.
REFERENCES
[1] Tham, I. W. K., Lin, S., Pan, J., Han, L., Lu, J. J. and Wee, J., “Intensity-modulated radiation therapy without concurrent chemotherapy for stage IIb nasopharyngeal cancer,” Am J Clin Oncol 33(3), 294-299 (2010).
[2] Wong, F. C. S., Ng, A. W. Y., Lee, V. H. F., Lui, C. M. M., Yuen, K. K., Sze, W. K., Leung, T. W. and Tung, S. Y. “Whole-field simultaneous integrated-boost intensity-modulated radiotherapy for patients with nasopharyngeal carcinoma” Int J Radiat Oncol Biol Phys 76(1), 138-145 (2010).
[3] Tsuji, S. Y., Hwang, A., Weinberg, V., Yom, S. S., Quivey, J. M and Xia, P. “Dosimetric evaluation of automatic segmentation for adaptive IMRT for head-and-neck cancer” Int J Radiat Oncol Biol Phys 77(3), 707-714 (2010). [4] Stapleford, L. J., Lawson, J. D., Perkins, C., Edelman, S., Davis , L., McDonald, M. W., Waller, A., Schreibmann,
E. and Fox, T. “Evaluation of automatic atlas-based lymph node segmentation for head-and-neck cancer” Int J Radiat Oncol Biol Phys 77(3), 959-966 (2010).
[5] Chau, R. M. C., Leung, S. F., Kam, M. K. M., Cheung, K. Y., Kwan, W. H., Yu, K. H., Chiu, K. W., Cheung, M L M and Chan , A. T. C. “A broadly adaptive array of dose-constraint templates for planning of intensity-modulated radiation therapy for advanced T-stage nasopharyngeal carcinoma” Int J Radiat Oncol Biol Phys 74(1), 21-28 (2009).