Procedia Computer Science 87 ( 2016 ) 178 – 183
1877-0509 © 2016 The Authors. Published by Elsevier B.V. This is an open access article under the CC BY-NC-ND license (http://creativecommons.org/licenses/by-nc-nd/4.0/).
Peer-review under responsibility of the Organizing Committee of ICRTCSE 2016 doi: 10.1016/j.procs.2016.05.145
ScienceDirect
כ Corresponding author. Tel.: +0-000-000-0000 ; fax: +0-000-000-0000. E-mail address: [email protected]
4th International Conference on Recent Trends in Computer Science & Engineering
Comparative Analysis of Wavelet Thresholding Techniques
with Wavelet-Wiener Filter on ECG Signal
K.Devi Priya
a,G.Sasibhushana Rao
b,P.S.V.Subba Rao
aPhysics Dept,Andhra University,Visakhapatnam 530003,INDIA. ECE Dept,Andhra University,Visakhapatnam 530003,INDIA.
Abstract
The electrocardiogram (ECG) records the electrical activity of the heart muscle and displays this data as a trace on a screen or on paper .This data is then interpreted for identification of a particular malfunctioning of the heart. Before the identification of a particular disease the ECG signal is first de-noised, as the raw ECG signal is contaminated with various other signals called artefacts. This is the crucial step as the signal has to be extracted from the noisy signal, without losing much of the valid information. In this paper, wavelet transform technique is considered for de-noising the ECG signal. The ECG signal is de-noised using different threshold techniques like hard, soft, SURE shrink, hybrid shrink and compared with the wavelet based wiener filter. The performance of these techniques is analysed. It is observed that there is a trade- off between the bias and variance in case of hard, soft, sure shrink , hybrid shrink whereas, in case of wavelet- wiener filter, bias and variance reduces simultaneously and gives a minimum MSE.
Keywords:MSE, bias, variance, Savitzky-Golay filter, wiener filter,shrinkage.
1.Introduction
The ECG which is recorded is a non-stationary signal obscured with various noises like Power-line interference, Base-line wander, Electrode contact noise, Motion artefacts, EMG etc. The frequency spectrum of the ECG signal ranges from 0.05 to 100 Hz. And the frequency spectrum of the EMG which is overlapped is in the range from 20 to 200 hz. It is of primary interest to recover the true signal from the noisy ECG signal. The ECG signal should be clean and clear as possible so that accurate decisions can be taken by the physicians. To de-noise the ECG signal various kinds of time domain and frequency domain filters are implemented. But when compared to other filters like adaptive (LMS and RLS), Savitzky-Golay, wavelet transform techniques can better de-noise the ECG signal [1]. Wavelet transform has been an efficient tool for a variety of applications including estimation, classification and compression. Here the wavelet transform is used for estimating the true signal from the corrupted signal. The noisy signal is decomposed into different levels and the signal energy is concentrated in a small number of large wavelet coefficients and the noisy components are concentrated in a large number of small wavelet coefficients for which
threshold is applied . The noisy wavelet coefficients are discarded / reduced and the true signal is estimated by reconstructing the signal from the remaining wavelet coefficients. The signal to be considered is modelled as a
vector in N
R space. Let
x
,
s
,
n
denoteN
u
1
column vectors. The noisy signal can be written as() ( ) n(i) i 1,2,...N. N i s i x (1)
With
x
(
i
)
is the ith sample of the noisy signal,(
)
N
i
s
is the ith sample of the true signal, n(i) a zero mean whiteGaussian noise of variance .
Let W denote the
N
u
N
orthogonal wavelet transform matrix. Applying wavelet transform to Eq. (1) becomesy T z (2)
Where, y Wx,T Ws,z Wn
T is the true signal wavelet coefficients,
y
is given noisy observations . The true signal is compactly representedinto a small number of large wavelet coefficients in
T
.similarly, the wavelet transform map noise terms to noisewavelet coefficients.
Now the wavelet transform estimates the signal by shrinking the small entries of y (no signal) while retaining the
large entries of
y
(where the signal is). On the other hand, ideal Wiener filter is the optimal filter to obtain theminimum MSE. The new algorithm given by [3] is the wavelet domain based wiener filter. In this algorithm, the wavelet shrinkage estimate is used as a means to design wavelet-wiener filter. The unwanted EMG signal components are best suppressed using DWT technique [2].
There are various de-noising algorithms which are used to de-noise the signal and to obtain an uncorrupted signal. In this paper, noisy ECG signal is de-noised using hard, soft, sure shrink, hybrid shrink and wavelet wiener filter. The de-noised signal is tested for MSE, bias squared, variance. Better results are achieved using wavelet-wiener filter
becauseboth bias-square and variance decreases simultaneously and maintain the minimum MSE.
2.Wavelet thresholding techniques
In wavelet shrinkage, the shrink/retain operation is to reduce the small amplitude (noise) wavelet coefficients to zero. A suitable threshold value is chosen such that pure noise coefficients may pass the threshold and discarded. And the signal is estimated from the remaining wavelet coefficients [4]. If the chosen threshold value is small then some of the noisy wavelet coefficients cannot pass the threshold and thus the estimated signal may still contain noise terms. On the other hand, if the chosen threshold is large then the signal is over smoothened, which may lead to the loss of valid signal information. Thus the optimal threshold value selection is an important criteria to get minimum MSE [5].
The wavelet shrinkage function determines how the thresholds are applied to the data. There are two basic wavelet shrinkage functions.
2.1 Hard threshold
This method was proposed by Dohono. This is a linear function in which, it discards coefficients below a threshold value , that is determined by the noise variance.
The hard threshold filter coefficients are given from [6], ¯ ® ! otherwise i y if i hh , 0 ; ) ( , 1 ) (
W
(3)It is basically a “keep or kill” procedure. In this scheme, spurious ‘blips’ and discontinuous appear in the output when noise terms does not pass the threshold [5].
2.2 Soft threshold
This method was also proposed by Dohono. This is a non-linear function which is similar to hard threshold but it shrinks the large magnitude wavelet coefficients above the threshold. This causes the output to be more smoothened and continuous when compared to the hard threshold. The soft threshold filter coefficients are given from [6]
>
@
¯ ® ! otherwise i y if i y i y i hs , 0 ; ) ( ], ) ( [ ) ( sgn ) (W
W
(4)In case of hard and soft thresholds universal threshold value is considered and is given by )
log(
2
N V
W ,Nis the length of the input signal,
V
2is the variance estimated from the finest level of detailcoefficients.
2.3 Sure shrink:
Sure shrink method is proposed by Dohono and Johnstone to select the optimal threshold value [7]. This method is
based on the principle of Stein’s unbiased estimator for risk (SURE). This method estimates the loss 2
)
ˆ
(PP in
an unbiased fashion. Using the SURE (quadratic loss) function, estimate of risk for a particular threshold value(‘ ’)
is obtained. Now a threshold value is selected by minimizing the risks in ‘ ’. This method gives a better MSE
properties for large sample of data. The stein’s unbiased estimate of risk is given by
Rs(W) NE
^
g(y) 22.g(y)`
(5)Now the threshold value is selected by considering the minimum risk value among the set
^
y0,y1,...,yN1`
.surethreshold(W) argmin Rs(W) whereW
^
y0,y1,...,yN1`
(6)2.4 Hybrid threshold
According to Donoho’s algorithm, hard-threshold function causes discontinuity and the soft-threshold function has
bigger bias. To reduce the drawbacks of thresholding function in the Donoho’s algorithm and the adjustment of
more parameters in the thresholding function, a hybrid threshold function is used [2]. The hybrid threshold function is constructed as ° ¯ ° ® d ! W W W ) ( , 0 ; ) ( , ) ( ) ( ) ( 2 i y i y i y i y i hy (7) 2
3
,
W
V
where
,V
2 is the estimated variance of the finest level of the detail coefficients.2.5 Wavelet wiener filter
Wiener filter is the optimal in the sense of minimizing the MSE. The noisy signal wavelet coefficients are applied to the wiener filter coefficients and the output of the filter is inverse transformed for the reconstruction of the estimate signal. The diagonal wiener filter coefficients is given by [8]
s w i N H 2 2 1,2,.. 2 V T T (8)
To design the wiener filter first
T
and variance(
V
2)
are to be estimated.V
2is the estimated variance of the finestscale of the wavelet detail coefficients.
T
(
i
)
is estimated by considering the upper part as shown in fig(1). At firstthe noisy ECG signal
x
(
i
)
is decomposed into suitable levels using wavelet transform (WT1). Then the obtainedhard threshold coefficients
T
ˆ
1, collects all the high SNR trustworthy (Nt)coefficients and discards all the low SNRdubious (Nd)coefficients in . Now the Ntcoefficients are inverse transformed to obtain the estimate of the
signal
s
ˆ
1, which is mathematically represented assˆ1 WT11Tˆ1WT1x (9)
This estimate signal
s
ˆ
1is used as signal model for the wiener filter design. The aim of the wiener filter is to predictthe
(
N
d)
coefficients which have low SNR in 1 and discarded. For this approach a slightly different wavelettransform (WT2) is chosen which is used to increase the low SNR
(
N
d)
coefficients iny
to high SNR values. Inthe second part, the noisy ECG signal is again decomposed into different levels using another wavelet transform
are designed from the estimated signal
s
ˆ
1 from the upper part of the fig (1). y1T
1z1 Tˆ1s
ˆ
1 n s x Tˆ21 2 2 2 z y TT
ˆ2s
ˆ
Fig.1. Block diagram of wavelet based wiener filter.
The
s
ˆ
1 is further decomposed using WT2 and these coefficients are used to modify the noisy wavelet coefficientsT
ˆ
21. Now the estimatesT
ˆ
1 andT
ˆ
21 are related as1 1 2 2 21 ˆ ˆ T T T T W W (10) The estimate
T
ˆ
21of the signal coefficients is then used to design the wiener filter coefficients inW
T2 domain using Eq.(9).The wiener filtered wavelet coefficients are inverse transformed (IWT2) to obtain the de-noised signal. The main idea of the wavelet wiener filter is to stretch the wavelet coefficients to bring the(
N
d)
coefficients and thus to implicitly obtain the entire(
N
sN
tN
d)
wavelet coefficients.3. Result
The ECG signal is added with various kinds of noises like power-line interference, EMG interference etc. Power-line interference noise is generated by adding a sinusoidal wave of 50 Hz signal to the ECG signal. The experiment was conducted based on two slightly different wavelet transforms.
Fig.2. output waveforms of ECG noise free, power-line interference and de-noised waveforms. 0 100 200 300 400 500 -1 0 1 2 3 samples m agni tude
noise free ECG signal
0 100 200 300 400 500 -2 -1 0 1 2 3 samples m agni tude
power-line interfernced ECG
0 100 200 300 400 500 -1 0 1 2 samples m agni tude
hard thresholded ECG
0 100 200 300 400 500 -1 0 1 2 samples m agni tude
SURE thresholded ECG
0 100 200 300 400 500 -1 0 1 2 3 samples m agni tude
hybrid thresholded ECG
0 100 200 300 400 500 -1 0 1 2 samples m agni tude
wavelet wiener filtered ECG Hard threshold (H) Inverse wavelet transform (IWT1) Wavelet transform (WT2) Wavelet transform (WT1) Wavelet transform (WT2) Wiener filter coefficients (Hw) Inverse wavelet transform (IWT2)
Daubeches (db5) and symlet (sym6) wavelets compactly represent the signal. Filter bank of sym6 is slightly larger than the db5, so that
N
d coefficients can be estimated. The noisy ECG signal is decomposed into three levels and de-noised using various wavelet de-noising techniques like hard, soft, universal, SURE shrink, hybrid shrink, and wavelet domain wiener filter as shown in fig (2).Similarly EMG interference noise is generated by adding random noise to a frequency range of about 20 t0 200 Hz,then it is added to the ECG signal. This noisy ECG signal is decomposed into three levels and de-noised using various wavelet de-noising techniques like hard, soft, universal, SURE shrink, hybrid shrink, and wavelet domain wiener filter. Their denoised signals are shown in fig (3)To measure the performance of these wavelet thresholding techniques, the following are considered.
MSE:One of the most commonly used measure. It is an average of the squares of the difference between the actual observations and those predicted. MSE is a risk function, corresponding to the expected value of the squared error loss or quadratic loss.
¸
¦
¹ · ¨ © § N i i y i y N MSE 1 2 )) ( ) ( ˆ ( 1 (11)y
ˆ
is the estimated signal using wavelet threshold techniques,y
is the observed noisy signal.Variance: It is the expected value of the squared deviation from the mean. It gives the variation of predicted value from its mean.
¸
¦
¹ · ¨ © § N i i y N iance 1 2 2 ) ) ( ˆ ( 1 1 ) ( varV
P
(12)y
ˆ
is the estimated signal,P
is the mean of the estimated signal. Variance must be of a small value.Bias-squared: It is the difference of variance from the MSE. The lower the value the better is the performance. To obtain minimum MSE (risk function) there is a trade-off between the variance and bias-squared.
For ECG corrupted with power-line interference signal, the above thresholding techniques are implemented and MSE, variance and bias square values are calculated as shown in table1.
0 100 200 300 400 500 -1 0 1 2 3 samples m agni tude
noise free ECG signal
0 100 200 300 400 500 -2 0 2 4 samples m agni tude
EMG interferenced ECG
0 100 200 300 400 500 -2 -1 0 1 2 3 samples m agni tude
hard thresholded ECG
0 100 200 300 400 500 -2 -1 0 1 2 samples m agni tude
SURE thresholded ECG
0 100 200 300 400 500 -1 0 1 2 samples m agni tude
hybrid thresholded ECG
0 100 200 300 400 500 -1 0 1 2 samples m agni tude
wavelet wiener filtered ECG
Table 1. Tabular form for ECG added with power-line interference
Threshold method MSE Variance Bias-square
Hard 0.0362 6.2810×10-05 0.0362
Soft 0.0572 6.2810×10-05 0.0572
SURE shrink 0.0558 6.2810×10-05 0.0558
Hybrid shrink 0.0901 2.5078×10-05 0.0901
Wavelet wiener filter (WT1≠WT2)
0.0291 1.3997×10-05 0.0291
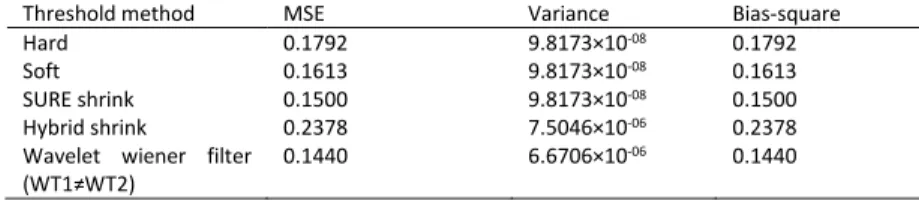
For ECG corrupted with EMG interference signal, the above thresholding techniques are implemented and MSE, variance and bias square values are calculated as shown in table2.
Table 2. Tabular form for ECG added with EMG interference
Threshold method MSE Variance Bias-square
Hard 0.1792 9.8173×10-08 0.1792
Soft 0.1613 9.8173×10-08 0.1613
SURE shrink 0.1500 9.8173×10-08 0.1500
Hybrid shrink 0.2378 7.5046×10-06 0.2378
Wavelet wiener filter (WT1≠WT2)
0.1440 6.6706×10-06 0.1440
4.Conclusions
In this paper, various thresholding techniques are experimented on the noisy ECG signal. The hard threshold method smoothens the signal, but spurious blips are observed in the output. Soft threshold method overcomes this disadvantage. Sure shrink and hybrid shrink methods better smoothens the signal but does not give minimize the MSE. In case of ECG interference with power-line noise, it is observed that in hard, soft, SURE shrink methods the variance is large and MSE increases, whereas in wavelet-wiener filter both variance and bias square value decreases and so the MSE. In case of ECG interference with EMG signal noise, it is observed that in hard, soft, SURE shrink methods the variance and bias square values increases or decreases simultaneously, and the MSE increases, whereas in wavelet-wiener filter both variance and bias square value decreases and thus the MSE is small.
It is observed that when the two wavelet functions have slightly different filter bank a better performance is obtained, as it extracts all the low SNR coefficients. When the two wavelet functions have different filter banks with large variation then the signal spreads out and does not give a better performance.
5.References
1. Mohammed AlMahamdy, H.Bryan Riley., ” Performance study of different denoising methods for ECG signals”,Procedia Computer Science 37(2014)325-332.
2. Chmelka and J. Kozumplik, “Wavelet-based Wiener Filter for electrocardiogram signal denoising,” ,Comput. Cardiol., vol. 32, pp.
771-774, Sep.2005.
3. Ghael SP, Sayeed AM, Baraniuk RG. Improved wavelet denoising via empirical Wiener filtering. Proc. of SPIE, volume 3169. San Diego, 1997; 389–399.
4. K.P.Soman, K.I.Ramachandran, “Insight into Wavelets from Theory to Practice”, third edition, PHI publications, ISBN-978-81-203-4053-4.
5. Maarten Jansen,”wavelet Thresholding and Noise Reduction”, Katholieke Universiteit Leuven — Faculteit Toegepaste Wetenschappen Arenbergkasteel, B-3001 Heverlee, Belgium,April 2000.
6. D. L. Donoho, 1991. “De-noising by soft thresholding”, IEEE Transaction on Information Theory, Vol. 41, pp. 613–627, May 1995. 7. Donoho D.L., Johnstone I.M., “Adapting to unknown smoothness via wavelet shrinkage” , J. Am. Statis. Ass.L.1995 .
8. Nikolaev N, Nikolov Z, Gotchev A, Egiazarian K. Wavelet domain Wiener filtering for ECG denoising using improved signal estimate. In IEEE International Conference on Acoustics, Speech, and Signal Processing, volume 6. 2000; 3578–3581.