COVER SHEET
This is the author-version of article published as:
Robertson, Calum and Geva, Shlomo and Wolff, Rodney (2006) Does
Company Specific News Effect the US, UK, and Australian Markets
within 60 minutes?. In Moshirian, Fariborz, Eds. Proceedings 19th
Australasian Finance and Banking Conference, Shangri-La Hotel, 176
Cumberland Street, The Rocks, Sydney, Australia.
Does Company Specific News Effect the US, UK, and
Australian Markets within 60 minutes?
Calum Robertson
a, Shlomo Geva
a,*, Rodney Wolff
b a Faculty of Information Technology, Queensland University of Technologyb Faculty of Business, Queensland University of Technology
2 George Street, Brisbane, QLD Australia 4000
Abstract
The efficient market hypothesis states that an efficient market rapidly incorporates all available information into the price of the asset. It has been well established that no market, particularly the stock market, is truly efficient as there are too many traders with differing strategies, and differing access to and interpretation of information. Despite this there is considerable evidence that the stock market does assimilate new information into prices. There has however been little research into the intraday effect of company specific news. In this paper we investigate the intraday effect of company specific news on the US, UK, and Australian markets. We use a scheme to determine whether the markets react to news by determining the likelihood of certain events occurring, and the likelihood of news occurring within 60 minutes of them, and compare the two. We find that there is strong evidence that these markets do react to news within 60 minutes, and indicate which events are most likely to correlate to news.
JEL classification: G12; G14 Keywords: Return; Volatility; News
1. Introduction
Traditionally traders acquired information from newspapers and magazines though the last two decades has seen a rapid rise in the quantity of information available electronically, including real-time prices and media coverage. Oberlechner and Hocking (2004) found that with the overwhelming volume of information available it has become difficult, if not impossible, for a single person to keep abreast of all information for a single asset, let alone multiple assets.
Numerous studies have found that news causes specific asset markets to react, whether in the form of newspaper/magazine/real-time sources (e.g. Cutler et al. 1989; Goodhart 1989; Goodhart et al. 1993; Mitchell and Mulherin 1994; Melvin and Yin 2000; Mittermayer 2004), macroeconomic announcements (e.g. Ederington and Lee 1993; 1995; Almeida et al. 1998; Ederington and Lee 2001; Graham et al. 2003; Nofsinger and Prucyk 2003; Kim et al. 2004), analyst recommendations (e.g. Womack 1996; Michaely and Womack 1999; Hong et al. 2000), or weather reports (e.g. Roll 1984).
Ederington and Lee (1993) found that volatility on Foreign Exchange and Interest Rate Futures markets increases within one minute of a macroeconomic news announcement, and the effect lasts for about 15 minutes. Ederington and Lee (1995) determined that the same markets begin to react to news within 10 seconds of macroeconomic news announcements, with weak evidence that they tend to overreact to news within the first 40 seconds after news, but settle within 3 minutes. Graham et al. (2003) established that the value of stocks on the S&P 500 index is influenced by scheduled macroeconomic news, however, they didn’t investigate any intraday effect. Nofsinger and Prucyk (2003) concluded that unexpected bad macroeconomic news is responsible for most abnormal intraday volume trading on the S&P 100 Index option.
Despite strong evidence that the stock market does react to macroeconomic news, there is far more company specific news than macroeconomic news. Furthermore, unlike
*
Corresponding author. Tel. +61 7 3864 1928; fax: +61 7 3864 1801.
E-mail addresses: [email protected] (C. Robertson), [email protected] (S. Geva), [email protected] (R. Wolff)
macroeconomic news, most company specific news isn’t scheduled and therefore investors have not formed their own expectation, or adopted analysts’ recommendations about the content of the news. Mittermayer (2004) investigated the effect of Press Announcements on the New York Stock Exchange and the NASDAQ and determined that the content of news can be used to predict, with reasonable accuracy, if the market will exhibit high return within an hour of the announcement. Unfortunately press announcements are only a fraction of company specific news, so further investigation is required to determine how the stock market reacts, if at all, to this type of news.
Before analysing how the market reacts to news it is necessary to understand some of the theories in behavioural finance (e.g. Barberis et al. 1998; Daniel et al. 1998; Hong and Stein 1998; Hong et al. 2000). Hong and Stein (1999) proposed two boundedly rational investor types known as “news watchers” and “momentum traders”, to explain events when market behaviour cannot be fully explained by news, or conventional trading models. Neither type is fully rational as news watchers pay no attention to price changes, whilst momentum traders pay no attention to news. They propose that news watchers decide to buy or sell based on the latest news, regardless of the current value of the stock. As they are unaware of the value of the stock they tend to underreact to the news. Momentum traders on the other hand notice the market movement caused by the news watchers, and start to trade accordingly. However as they are unaware of the reason for the market movement, they tend to overreact to news. This overreaction is later corrected by the market, and the momentum traders tend to lose money.
Barberis et al. (1998) concluded that the market underreacts to earnings announcements, and Daniel et al. (1998) found that investors tend to underreact to public information whilst overreacting to their own private information. Hong et al. (2000) found that small companies with little or no analyst coverage tend to take a long time to react to bad news. They concluded that momentum comes from the gradual flow of information.
In this paper we use a scheme to determine whether the stock market reacts to news. We apply this to stocks traded in the US, UK and Australian markets to ascertain how strongly these markets react, if at all, to company specific news. Firstly we describe the Data used in our tests, and then the Methodology we used, before presenting our Results and Conclusions.
2. Data
All data for this research was obtained using the Bloomberg Professional® service. The dataset consists of stocks which were in the S&P 100, FTSE 100, and ASX 100 indices as at the 1st of July 2005 and continued to trade through to the 1st of September 2006, which is a total of 286 stocks. For each stock the Trading Data, and News were collected for the period beginning 1st of May 2005 through to and including the 31st of August 2006.
The set defined in Eq. (1) consists of each distinct minute where trading occurred for the stock (s), within all minutes for the period of data collection (
Τ
A), and the average price for trades during that minute. However we are only interested in the business time scale (minutes which occurred during business hours for the market on which the stock trades). Furthermore we want a homogenous time series (i.e. an entry for every business trading minute for the stock, regardless of whether any trading occurred). Therefore we produce the date and price time series for all minutes in the business time scale (Τ
B) with the definitions in Eqs. (2) and (3), where we define the price at time t as the price of the last actual trade for the stock prior to or at the given time. Note that if the stock was suspended from trading for a whole day then the day is excluded fromΤ
B.( )s
{
I
I
I
m}
I
( )sz(
d
( )szp
( )sz)
z
AI
=
1,
2,
...
,
|
,=
,,
,∧
∈
Τ
(1) ( )s{
D
D
D
n}
D
( )stD
(st )D
( )st B B AD
=
1,
2,
...
,
|
,>
,−1∧
,∈
Τ
∧
Τ
⊆
Τ
(2) ( )s{
P
P
P
n}
P
( )st(
p
( )szz
(
z
d
( )szD
( )st)
)
P
=
1,
2,
...
,
|
,=
,|
=
max
|
,≤
, (3)The news search facility within the Bloomberg Professional® service was used to download all relevant articles for each stock within the dataset. These articles include Press Announcements, Annual Reports, Analyst Recommendations and general news which Bloomberg has sourced from over 200 different news providers. The set defined in Eq. (4) consists of each distinct news article for the stock and contains the time and content of the article. However we are only interested in the business time scale and are only concerned whether news occurred at the given time. Therefore we produce the news time series defined in Eq. (5) such that each business trading minute for the stock contains the count of the articles which occurred during it. If an article occurs after hours then it is stored in the first trading minute of the next trading day, as defined in Eq. (5).
( )s
{
A
A
A
p}
A
( )o(
d
oc
o)
s
AA
=
1,
2,
...
,
|
=
,
∧
∈
Τ
(4)( )s
=
{
N
N
N
q}
N
( )st=
∏
{
∀
A
( )sD
( )t−<
d
o≤
D
( )t}
N
1,
2,
...
,
|
,|
1 (5)3. Methodology
The return time series for a stock, defined in Eq. (6), is formed by taking the difference in the log prices from the trading data defined in Eq. (3) over the period ∆t. The volatility time series for a stock, defined in Eq. (7), calculates the annualised realised volatility of the return series calculated in Eq. (6). It does so by finding the average return about the mean, and then annualises it by multiplying by the square root of the number of trading minutes per year over the size of the time window. Note that we use the standard assumption of 250 trading days per year, and the standard number of trading minutes per day for the country (e.g. US = 390 minutes per day). If p=2 then this is simply the annualised standard deviation of the return. Dacorogna et al. (2001) suggest that annualising the volatility enables direct comparison between the different countries where each country has a different number of trading minutes per year.
(s t)
{
R
R
R
u}
R
(st t)( )
P
( )
s t(
P
(
s t t)
)
R
,∆=
1,
2,
...,
|
,,∆=
log
,−
log
, −∆ (6) ( )(
( ) ( ))
p p n i t n t s t i t s p t n t sR
M
n
t
y
1 1 0 , , , , , , , , ,1
−
×
∆
=
∑
− = − ∆ ∆ ∆υ
( )∑
( ) − = − ∆ ∆=
∧
1 0 , , , , ,1
n i t i t s t n t sR
n
M
=
∧
×
=
∧
360
510
390
250
AU UK USm
m
m
m
y
(7)The stocks are grouped together as per Eq. (8) so that we can examine the effect of news on an individual country. We divide the trading day into equally sized time windows ∆Т, as defined in Eq. (9), in order to examine the intraday effect of the news.
We define a generalised time series F, where F is either the return, or volatility time series (Note that n and p are ignored for the return time series). We use the generalised time series to define the Event Point Process (EPP) in Eq. (10). In this point process a point value of 1 indicates that the function value (return or volatility) for the given stock exceeded the specified threshold (x), which we will refer to as an event. It should be noted that the event time series are log values about 0, so a threshold of 10% means that the error should be ≥ to log(11/10) or ≤ to log(10/11). The volatility time series is always positive when p is even so the ≤
condition is ignored.
The Event given News Point Process (ENPP) is defined in Eq. (11), where a point value of 1 symbolises that an event occurred at time t for the stock s in the EPP, and at least one company specific news article arrived between t-∆τ and t-1. The Event Without news Point
Process (EWPP) defined in Eq. (12) has a point value of 1 when an event occurred at time t for the stock s and no company specific news arrived between t-∆τ and t-1.
{
1,
2,
...
,
}
|
≥
1
=
S
S
S
h
S
h (8){
W
W
W
g}
W
=
1,
2,
...
,
( ,∆,∆Τ)=
{
∀
Τ
|
t
0≤
time
( )
T
( )
,<
t
0+
∆Τ
∧
t
0=
t
+
(
w
−
1
)
×
∆Τ
}
W
w t B B i f( )
(
B)
ftime
T
t
=
min
∧
(9) ( , , , , ){
1,
...
,
}
|
( , ,,, , ) ( ,, , , )
?
1
:
0
−
≤
≥
=
=
∆Τ ∆ ∆ ∆ ∆Τx
x
F
E
E
E
E
w S tx u w st tx stn tp ( )∈
( ∆Τ)∧
∈
∧
s
S
d
s,tW
w, (10) (w,∆Τ,S,∆t,x,∆τ)=
{
EN
1,
EN
2,
...
,
EN
u}
|
EN
(w,∆Τ,s,t,∆t,x,∆τ)=
EN
( )(
1
)
(
)
0
?
1
:
0
1 , , , , , ,
>
∧
=
∏
∆ = − ∆ ∆Τ τ i i t s x t t s wA
E
(11) (w,∆Τ,S,∆t,x,∆τ)=
{
E
N
1,
E
N
2,
...
,
E
N
u}
|
E
N
(w,∆Τ,s,t,∆t,x,∆τ)=
N
E
( )(
1
)
(
)
0
?
1
:
0
1 , , , , , ,
=
∧
=
∏
∆ = − ∆ ∆Τ τ i i t s x t t s wA
E
(12)The Ratio of Events Related to News to Events (RERNE) defined in Eq. (13) indicates the percentage of events which are preceded by news. A high RERNE value suggests that most events for the given parameters are preceded by news, which would imply that news is responsible for these events. A low RERNE value can denote that the market takes longer than the specified ∆τ time to react to news, or that the events are caused by other factors, or
that the events themselves are merely noise.
The Benchmark defined in Eq. (14) provides a measure of the likelihood of news arriving within the specified ∆τ time. This is achieved by calculating a return of 0% in Eq. (10), which
produces a point process where every point has a value of 1, and therefore the point process in Eq. (11) simply indicates the points when news occurs within the specified ∆τ time.
This Benchmark is then used to calculate the Likelihood that Events are Related to News (LERN) in Eq. (15). A high LERN value implies that it is more likely for news to occur prior to an event that it is normally. A LERN value equal to 100% indicates that it is just as likely for news to occur before an event as it is to occur at any other time. A low LERN value signifies that it is less likely for news to occur prior to an event than normal, which would imply that news isn’t responsible for the event.
( ) ( ) ( )
∑
∑
∆ ∆Τ ∆ ∆ ∆Τ ∆ ∆ ∆Τ=
x t S w x t S w x t S wE
EN
RERNE
, , , , , , , , , , , , , , τ τ (13) ( ∆Τ ∆ ∆τ)∏
( ∆Τ ∆ ∆τ)∑
=
, , , ,0, , , , , S t w S t wEN
B
(14) ( ) ( ) ( τ) τ τ ∆ ∆Τ ∆ ∆ ∆Τ ∆ ∆ ∆Τ=
, , , , , , , , , , , , , S w x t S w x t S wB
RERNE
LERN
(15)The Event T-Test (ETT) defined in Eq. (17) performs a Student t-Test on the period distribution of the chance of an event occurring with news versus the chance of an event occurring without news during each period. The purpose of the ETT is to test the null hypothesis that the occurrence of events is not influenced by the occurrence of news. Note that we redefine the time windows in Eq. (16) such that the first period of the day is excluded, which is defined by rounding up ∆t/∆Т and multiplying by ∆Т. This ensures that no after hours market or news effect is included in the test and that every period is of the same size.
The News T-Test (NTT) defined in Eq. (18) performs a Student t-Test on the period distribution of the chance of news occurring prior to an event versus the chance of news occurring during each period. The intent of the NTT is to test the null hypothesis that the occurrence of news before events is the same as the occurrence of news normally.
{
WR
WR
WR
g}
WR
=
1,
2,
...
,
( ,∆,∆Τ)=
{
∀
Τ
|
t
0≤
time
( )
T
( )
,<
t
0+
∆Τ
∧
t
0=
t
+
(
w
−
1
)
×
∆Τ
}
WR
w t B B i f( )
(
)
×
∆Τ
∆Τ
∆
+
=
∧
t
fmin
time
T
Bceil
t
(16) ( ) ( ) ( )
∈
∏
∑
∀
∈
∏
∑
∀
=
∆ ∆ ∆Τ ∆ ∆ ∆ ∆ ∆ ∆WR
w
N
E
WR
w
EN
tTest
ETT
x t S w x t S T w x t S T WR|
,
|
, , , , , , , , , , , , , , , τ τ τ (17) ( ) ( ) ( ){
B
w
WR
})
WR
w
EN
tTest
NTT
t S w x t S T w x t S T WR∈
∀
∈
∏
∑
∀
=
∆ ∆ ∆Τ ∆ ∆ ∆ ∆ ∆ ∆|
,
|
, , , , , , , , , , , , , , τ τ τ (18) 4. ResultsAll tests are performed using ∆t=∆ττττ=n=60, ∆Т=30, and p=2. The results are divided into sub-sections titled Event Frequency, News Distribution, and Events Linked To News. These cover the frequency of events, the distribution of news, and analyse whether news causes the events in question.
4.1. Event Frequency
In this section we determine how frequently events occur during the initial 60 minutes of the trading day, and through the rest of the day. The first 60 minutes are separated from the rest of the day for two main reasons. Firstly we use a 60 minute time window for both Return and Volatility measures. This means that the first 60 minutes of the trading day measure market reaction between business days. Secondly we allow up to 60 minutes for a news article to be linked to events. As any news which occurred after hours is stored in the first trading minute of the day, there is a greater chance of news being linked to events within the first 60 minutes. Therefore it is useful to know how the market tends to behave during the two distinct periods of the trading day.
Fig. 1 and Fig. 2 show the mean number of trading minutes per Return and Volatility event respectively, for varying thresholds. There is a distinct difference between the behaviour of the market during the first 60 minutes and the rest of the trading day, though it is more marked in the Return results. This can be due to capital reconstructions (share splits, share consolidation), dividend payments, or the market having more time to interpret information. Furthermore the behaviour of day-traders, and to a lesser extent, fund managers, who often take a position first thing in the morning, could contribute to this effect as they may have unreasonable expectations of future price movements.
Re turn Eve nts (First 60 Minute s Vs Re st of Tra ding Da y) 1 100 10,000 1,000,000 0.1% 1.0% 10.0%
Minim um Thre shold
M in u te s P e r E v e n t
US First UK First A U First
US Rest UK Rest A U Rest
Fig. 1. This figure shows the average number of trading minutes per return event for each country, separated into the first 60 minutes (First) of the trading day, versus the rest of the trading day (Rest). Clearly it is more likely for high return events to occur within the first 60 minutes, than during the rest of the day. This can be attributed to the market having more time to reflect on new information whilst the market is closed.
Vola tility Eve nts (First 60 Minute s Vs Re st of Tra ding Da y)
1 10 100 1,000 10,000 1.0% 10.0% 100.0%
Minim um Thre shold
M in u te s P e r E v e n t
US First UK First A U First
US Rest UK Rest A U Rest
`
Fig. 2. This figure shows the average number of trading minutes per volatility event for each country, separated into the first 60 minutes (First) of the trading day, versus the rest of the trading day (Rest). It is obviously more likely for high volatility events to occur within the first 60 minutes, than during the rest of the day, though this isn’t as distinct as for high return events. This can be attributed to the market having more time to reflect on new information whilst the market is closed.
Interestingly there is roughly 17 times more chance of a 5% Return event occurring during the first 60 minutes, than during the rest of the trading day. Furthermore there is roughly 3.6 times more chance of a 100% annualised volatility event occurring during the first 60 minutes, than during the rest of the trading day.
4.2. News Distribution
In this section we analyse the distribution of news throughout the trading day. We do this to determine the likelihood of news occurring during different periods of the day, and to establish if certain times of the day have different characteristics to others.
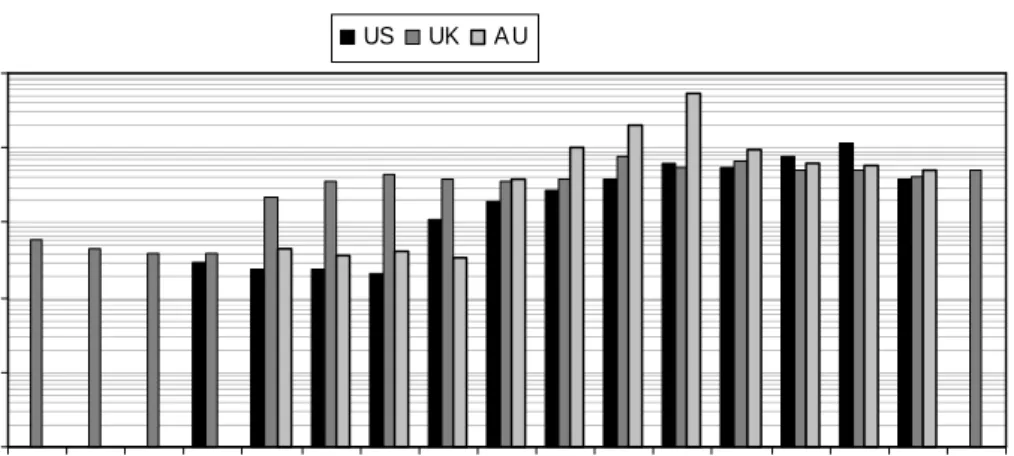
Ne w s Distribution 1% 10% 100% 8:00-8:29 8:30-8:59 9:00-9:29 9:30-9:59 10:00-10:29 10:30-10:59 11:00-11:29 11:30-11:59 12:00-12:29 12:30-12:59 13:00-13:29 13:30-13:59 14:00-14:29 14:30-14:59 15:00-15:29 15:30-15:59 16:00-16:29 Trading Tim e Ra nge
A rt ic le s US UK A U
Fig. 3. This figure shows the distribution of news articles across the business trading times for each country. If news occurred outside business hours it was attributed to the first minute of the trading day. There is a distinct quantity of news which occurs outside business hours for most markets. However the distribution shows that news fairly uniformly throughout the rest of the trading day. There is a distinct lull in news between 13:00 and 14:00 in Australia, which can probably be attributed to the lunch break.
New s Arrival 1 10 100 1,000 8:00-8:29 8:30-8:59 9:00-9:29 9:30-9:59 10:00-10:29 10:30-10:59 11:00-11:29 11:30-11:59 12:00-12:29 12:30-12:59 13:00-13:29 13:30-13:59 14:00-14:29 14:30-14:59 15:00-15:29 15:30-15:59 16:00-16:29 Trading Tim e Ra nge
M in u te s P e r A rt ic le US UK A U
Fig. 4. This figure shows the average number of minutes in which articles occur across the business trading times for each country. If news occurred outside business hours it was attributed to the first minute of the trading day, and therefore news is more frequent in the first 30 minutes of the trading day for each country. However the arrival of news is fairly even throughout the rest of the business day. There is obviously more news distributed in the US than in the other two countries. Australia clearly has the least frequent news arrival time but it is a considerably smaller market than the other two, and therefore this is to be expected.
Fig. 3 shows the percentage of news for the country which arrived during each 30 minute period of the trading day. It is very obvious that a large percentage of news occurs within the
first 30 minutes of the trading day for each country. This is mainly because we allocated any news which occurred outside business hours to the first trading minute of the next trading day. Despite this obvious trend, there appears to be a uniform distribution of news throughout the rest of the business day for each country. This indicates that there is a good chance of the market reacting in the same fashion throughout the day. The only significant lull in news occurs between 13:00 and 14:00 in Australia. There could be several reasons for this, but the most likely is that the news distributors are having their lunch break. Most market activity in Australia occurs in a single Eastern Standard Time zone.
Whilst Fig. 3 showed the number of articles which occurred during the time window, we are more interested in the average number of minutes when news occurred. We are only interested in whether news occurred during the 60 minutes prior to an event, and not the number of articles which occurred during the same period. In Fig. 4 we investigate the average number of minutes per news article being released to the market, during the business day. Again there is a distinctly higher chance of news occurring within the first 30 minute trading period of the day, than during the rest of the day. This is because any news which occurred outside business hours was assigned to the first trading minute of the next business day. Apart from this period, there is roughly an equal chance of news occurring during any of the other periods of the day. This is reassuring as it means that there is a good chance of the market behaving in the same fashion throughout the day.
4.3. Events Linked To News
In this section we investigate which events tend to occur within 60 minutes of a news article. We have created sub-sections covering Return and Volatility. In each section we firstly identify which threshold for the event yields the most interesting results by taking the mean LERN value for each time period throughout the day, excluding the first 60 minutes, for the reasons previously discussed, and performing the ETT and NTT tests. Then we calculate the RERNE, LERN, and event frequency throughout the day to determine if any trends exist.
4.3.1. Return
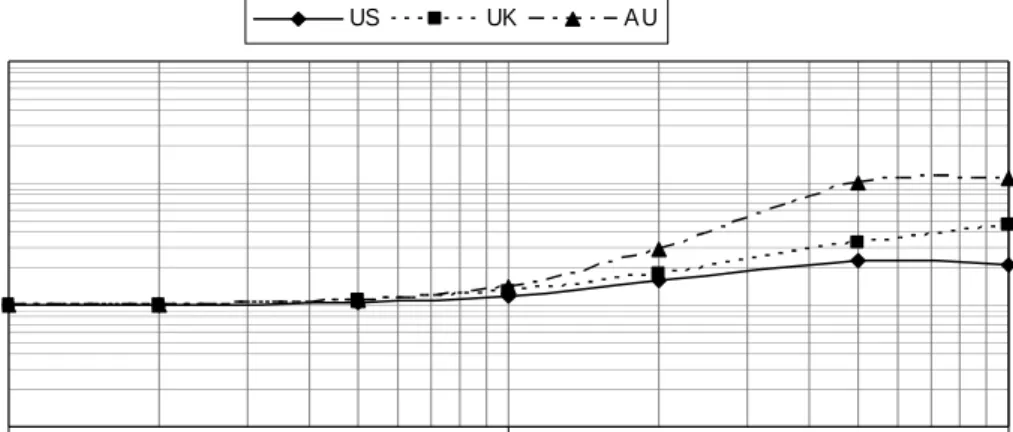
The results in Fig. 5 show the LERN for Return events as the threshold is increased from 0.1% through to 10%. If news is responsible for the increase in return then the LERN value should be greater than 100%, which is the case for every country from the 0.5% through to 5%. However as the threshold is increased to 10% there is a reduction in correlation for the US stocks, and the increase in the other countries is less than between the 2% and 5% thresholds. This can be attributed to the rarity of these events, and therefore the reduced chance of news occurring within 60 minutes of them.
To further investigate the behaviour of the market we also performed the ETT and NTT tests for the given thresholds. The results in Table 1 show the 5% threshold is the only one where there is at least 95% confidence to reject both the respective hypothesis of the ETT and NTT tests. However the 2% thresholds tests are also good as only the ETT test for the US fails to meet the specified confidence interval, though not by much. The tests clearly indicate that it is easier to reject the hypothesis that the occurrence of news before events is the same as the occurrence of news normally (NTT). This indicates that news is strongly correlated to events, though the ETT tests imply that not all events are caused by news.
After establishing that the 5% threshold yields the most correlation between news and events for Return, it is interesting to investigate the characteristics of that test. The results in Fig. 6 show the RERNE values for the return test with the aforementioned threshold. It clearly shows that there is a high correlation to news within the first trading hour of each country. This can most likely be attributed to the high rate of news arrival during the first 60 trading minutes, due to news which occurred outside business hours being considered to have arrived in the first trading minute of the next business day.
Furthermore Fig. 6 shows that only the 14:00-14:29 period for the US, the 9:00-10:59, 14:00-14:29, and 16:00-16:29 periods for the UK have values less than 50%. This means that throughout the entire day in the Australian market and most of the day in the other two countries, there is a strong correlation between the arrival of news and the occurrence of Return events within 60 minutes.
Re turn LERN a cross Thre sholds 10% 100% 1,000% 10,000% 0.1% 1.0% 10.0%
Minimum Thre shold
L
E
R
N
US UK A U
Fig. 5. This figure shows the average LERN for Return events throughout the trading day, excluding the first 60 trading minutes, for each country. Clearly as the threshold for return events is increased to 5% there is a greater likelihood that news occurred within the preceding hour. However as the threshold is increased further the chance of correlation is reduced.
Table 1. This table shows the p-values for the ETT and NTT return tests with ∆t=∆τ=60, ∆Т=30, the listed
threshold values, S consisting of all stocks for the given country (US, UK, Australia), and WR covering the entire day excluding the first 60-minute period. We have bolded results where there is at least 95% confidence to reject the null hypothesis.
ETT NTT Threshold US UK AU US UK AU 0.1% 87.29% 85.15% 88.81% 97.22% 94.47% 94.46% 0.2% 93.88% 62.19% 66.29% 97.31% 71.68% 71.26% 0.5% 86.30% 42.14% 86.73% 80.35% 14.90% 62.05% 1.0% 55.00% 16.31% 38.16% 8.07% 0.01% 0.00% 2.0% 7.34% 2.02% 4.22% 0.00% 0.00% 0.01% 5.0% 2.15% 0.07% 0.18% 0.00% 0.00% 0.00% 10.0% 25.29% 0.17% 1.17% 5.09% 0.03% 0.38%
Re turn RERNE (5% thre shold)
0% 20% 40% 60% 80% 100% 8:00 8:30 9:00 9:30 10:00 10:30 11:00 11:30 12:00 12:30 13:00 13:30 14:00 14:30 15:00 15:30 16:00
Tra ding Tim e Ra nge
R E R N E US UK A U
Fig. 6. This figure shows the RERNE values throughout the day for a 5% or higher return, for each country.
Re turn LERN (5% thre shold) 10% 100% 1,000% 10,000% 8:00 8:30 9:00 9:30 10:00 10:30 11:00 11:30 12:00 12:30 13:00 13:30 14:00 14:30 15:00 15:30 16:00
Tra ding Tim e Ra nge
L
E
R
N
US UK A U
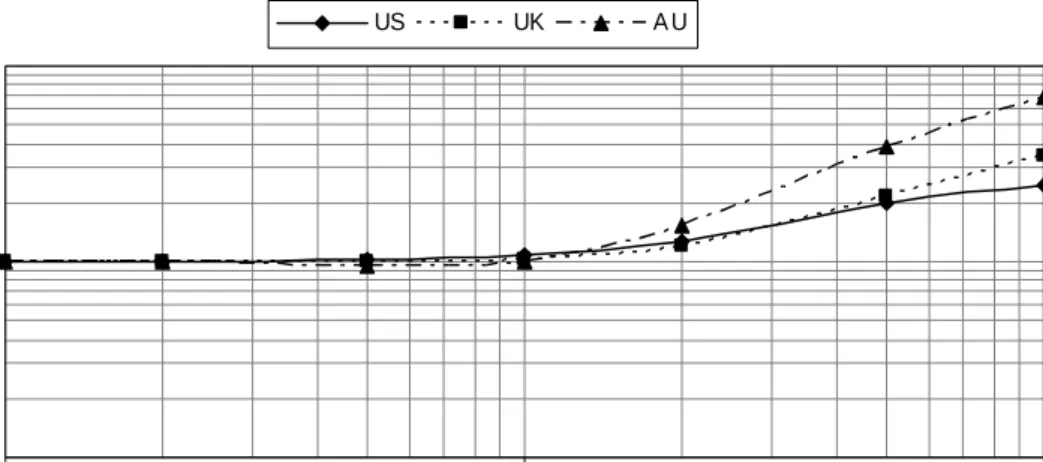
Fig. 7. This figure shows the LERN throughout the day for a 5% or higher return, for all countries. There is no period when the LERN value is below 100%, for any country, which indicates that there is a strong correlation between the occurrence of news and return events.
Re turn Eve nt Fre que ncy (100% thre shold)
1 10 100 1,000 10,000 100,000 8:00 8:30 9:00 9:30 10:00 10:30 11:00 11:30 12:00 12:30 13:00 13:30 14:00 14:30 15:00 15:30 16:00
Tra ding Tim e Ra nge
M in u te s p e r E v e n t US UK A U
Fig. 8. This figure shows the frequency of 5% or greater Return events occurring throughout the day. There is a fairly even distribution of events throughout the day.
It is possible that the 14:00-14:29 period on the US market corresponds to the lunch break taken by traders within the US. Alternatively it could correspond to close of business for investors based in Europe. However the RERNE value is only just below 50% and without any evidence in Fig. 7 or Fig. 8 to suggest different market behaviour during this period, we can conclude that this is only a slight anomaly.
The 9:00-10:59 period on the UK market could be explained by some investors starting to trade during that period, and therefore being slower to react to news which occurred overnight or within the first couple of hours of trade, which aren’t within the 60 minute period we allowed for news. Another factor could be that investors based in the US may not begin trading on the UK market until towards the end, or after this period. Furthermore it could be explained by certain investors overreacting, or underreacting to news within the first hour, and other investors capitalising on their trading activity. However Fig. 7 shows the average LERN value for the period is nearly 300% which indicates that the market is reacting to news more often than not.
The probable explanation for the 14:00-14:29 period on the UK market is that it occurs just before the start of the US trading day, and therefore investors take positions in the UK based on what they expect to happen on the US market, regardless of any company specific news. There is no evidence in Fig. 8 to suggest that there is any significant change in the frequency
of events during the 14:00-14:29 period on the UK market which could offer another explanation. Fig. 7 demonstrates that the LERN value for the period is over 200% which tends to suggest that the market is reacting to news during that period.
The most likely explanation for the 16:00-16:29 period on the UK market is that day traders and, to a lesser extent, fund managers are closing their positions for the day, without any regard to news. Another possible explanation is that the bigger institutional traders have switched their focus to the US market, leaving smaller and more erratic traders to trade on the UK market. The results in Fig. 7 show that the LERN value during that period is nearly 200% and therefore the market appears to be reacting to news during the period.
Even if all the sub-50% ratio periods which occurred on the UK market couldn’t be explained, they account for approximately only one third of the business trading hours, and none of the results were significantly below 50%. Therefore it is our opinion that there is strong evidence that all markets show a strong correlation between the arrival of news and the occurrence of a 5% return or higher within 60 minutes.
4.3.2. Volatility
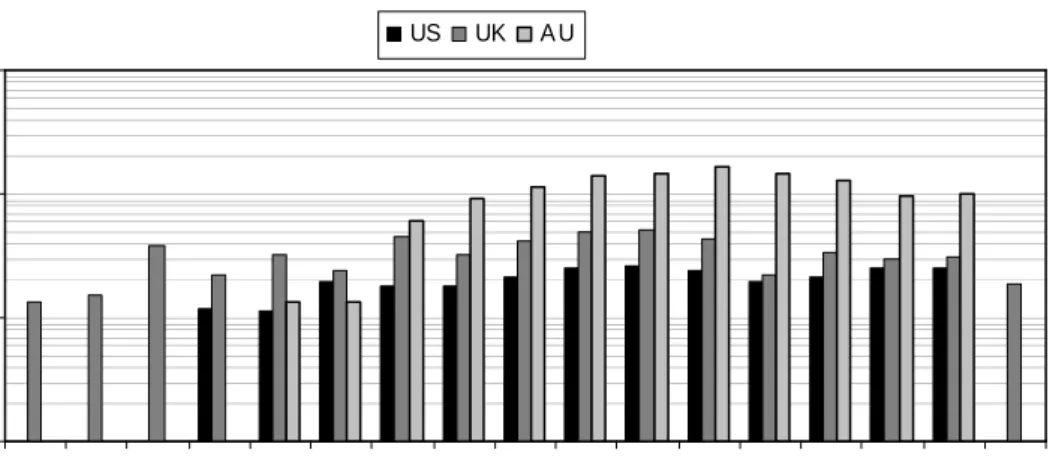
The results in Fig. 9 show the comparison ratio for Volatility events as the threshold is increased from 1% to 100%. The ratio should be above 100% if news is responsible for the increase in volatility, which is the case for every country from the 20% through to 100%. To further investigate the behaviour of the market we also performed the ETT and NTT tests for the given thresholds. The results in Table 2 show the 100% threshold is the only one where there is at least 95% confidence to reject the null hypothesis for the NTT tests, and all but the US for the ETT tests. The tests clearly indicate that it is easier to reject the hypothesis that the occurrence of news before events is the same as the occurrence of news normally (NTT). This indicates that news is strongly correlated to events, though the ETT tests imply that not all events are caused by news.
Vola tility LERN a cross Thre sholds
10% 100% 1,000%
1.0% 10.0% 100.0%
Minim um Thre shold
L
E
R
N
US UK A U
Fig. 9. This figure shows the average LERN values for Volatility events throughout the trading day, excluding the first 60 trading minutes, for each country for a variety of thresholds. Clearly as the threshold for volatility events is increased to 100% there is a greater likelihood that news occurred within the preceding hour.
It is interesting to investigate the characteristics of the Volatility events test with the 100% threshold, which showed the most correlation between news and events. The results in Fig. 10 show the RERNE values for the Volatility test with the aforementioned threshold. It clearly shows that there is a high correlation to news within the first trading hour of each country. This can most likely be attributed to the high rate of news arrival during the first 60 trading minutes, due to news which occurred outside business hours being considered to have arrived in the first trading minute of the next business day.
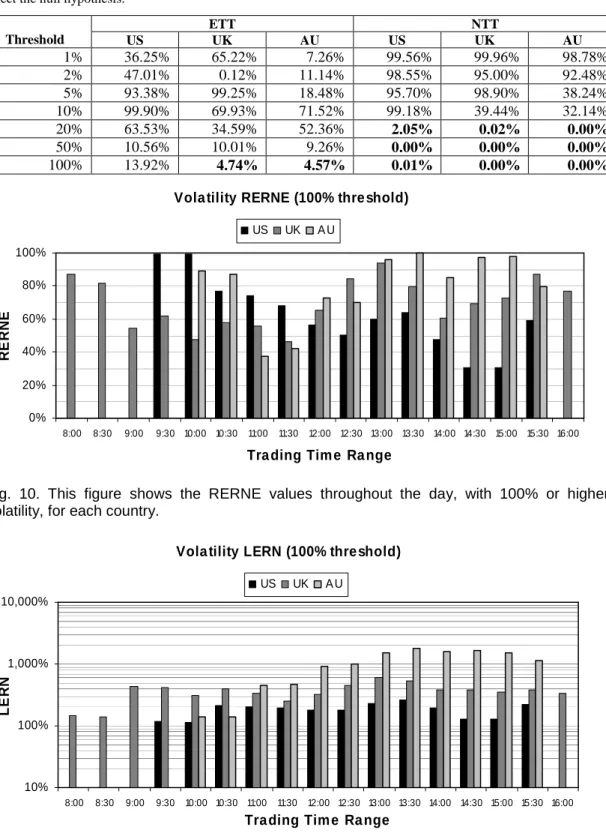
Table 2. This table shows the p-values for the ETT and NTT volatility tests with ∆t=∆τ=n=60, p=2, ∆Т=30, the
listed threshold values, S consisting of all stocks for the given country (US, UK, Australia), and WR covering the entire day excluding the first 60-minute period. We have bolded results where there is at least 95% confidence to reject the null hypothesis.
ETT NTT Threshold US UK AU US UK AU 1% 36.25% 65.22% 7.26% 99.56% 99.96% 98.78% 2% 47.01% 0.12% 11.14% 98.55% 95.00% 92.48% 5% 93.38% 99.25% 18.48% 95.70% 98.90% 38.24% 10% 99.90% 69.93% 71.52% 99.18% 39.44% 32.14% 20% 63.53% 34.59% 52.36% 2.05% 0.02% 0.00% 50% 10.56% 10.01% 9.26% 0.00% 0.00% 0.00% 100% 13.92% 4.74% 4.57% 0.01% 0.00% 0.00%
Vola tility RERNE (100% thre shold)
0% 20% 40% 60% 80% 100% 8:00 8:30 9:00 9:30 10:00 10:30 11:00 11:30 12:00 12:30 13:00 13:30 14:00 14:30 15:00 15:30 16:00
Tra ding Tim e Ra nge
R E R N E US UK A U
Fig. 10. This figure shows the RERNE values throughout the day, with 100% or higher volatility, for each country.
Vola tility LERN (100% thre shold)
10% 100% 1,000% 10,000%
8:00 8:30 9:00 9:30 10:00 10:30 11:00 11:30 12:00 12:30 13:00 13:30 14:00 14:30 15:00 15:30 16:00
Tra ding Tim e Ra nge
L
E
R
N
US UK A U
Fig. 11. This figure shows the LERN values for 100% or higher volatility events for all countries throughout the trading day.
Vola tility Eve nt Fre que ncy (100% thre shold) 1 10 100 1,000 10,000 100,000 8:00 8:30 9:00 9:30 10:00 10:30 11:00 11:30 12:00 12:30 13:00 13:30 14:00 14:30 15:00 15:30 16:00
Tra ding Tim e Ra nge
M in u te s p e r E v e n t US UK A U
Fig. 12. This figure shows the frequency of 100% or greater volatility events occurring throughout the day. There is a fairly even distribution of events throughout the day.
Furthermore Fig. 10 shows that only the 14:30-15:29 period in the US, the 10:00-10:29 and 11:30-11:59 periods for the UK and the 11:00-11:59 period in the Australian market, have RERNE values lower than 50%. This means that throughout the most of the day in all countries, there is a strong correlation between the arrival of news and the occurrence of Volatility events within 60 minutes.
There doesn’t appear to be evidence of any major differences in the behaviour of news arrival during the 14:00-15:29 period in the US shown in Fig. 4 which could explain these values. However Fig. 12 does show a gradual increase in the rarity of events between 12:00 and 15:00 which could explain the reduction in correlation to news, due to the rarity of the events. None of the periods have RERNE values less than 30%, and all LERN values for the period are over 120%. This seems to indicate that the market does react to news during those periods.
Both the 10:00-10:29 and 11:30-11:59 periods in the UK have LERN values over 300% so despite RERNE values lower than 50% there is still significant evidence that the market is reacting to news.
There is no evidence in Fig. 4 to suggest that there is any difference in news arrival during the 11:00-11:59 period on the Australian market which would explain the sub-50% RERNE values. However Fig. 12 shows that the event frequency is significantly higher (less minutes per event) on the Australian market prior to 12:00, which could account for the difference in market reaction to news. This could be explained by increased trading activity leading up to lunch time, and therefore less attention to news. However, regardless of the reason, Fig. 11 shows that the LERN values are over 400% during that period, which is sufficient evidence that the market does react to news during the period.
Apart from the 14:30-15:29 period on the US market there is considerable evidence that all markets show a strong correlation between the arrival of news and the occurrence of a 100% or higher annualised volatility within 60 minutes.
5. Conclusions
In this paper we have used a scheme to determine if markets react to news. We have shown that there is strong correlation between the occurrence of news and market reaction in the form of high return, or volatility within 60 minutes of the news. Furthermore we have shown that there is an increased likelihood of these events occurring at the beginning of the day, which indicates that the market doesn’t perform uniformly throughout the day.
The LERN test we defined in Eq. (15) with results in Fig. 7 and Fig. 11 clearly show that it is far more likely for news to occur prior to high return, or volatility, than during times when the market is more stable. The correlation between events and news is higher than could be expected if the occurrence of news was merely a coincidence. However this does not mean that every news article which occurs before a period of high return or volatility is responsible
for the market reaction. It is nevertheless evidence that those articles are more “interesting” than others.
The RERNE test we defined in Eq. (13), with results in Fig. 6 and Fig. 10 demonstrate that the majority of both return and volatility events do occur within 60 minutes of news. However, only a fraction of the time periods for any country have very high RERNE values (e.g. over 80%), which could indicate several things. Firstly it is almost certain that the markets react to non-company specific news (i.e. news which isn’t directly related to the company, and therefore isn’t listed in the results of a Bloomberg Professional® news search), such as macroeconomic news, or news which effects a competitor within the same or different market (note that these articles often can be found in the news search). Secondly it is widely believed that not all traders within the market are fully rational, and therefore it is likely that some traders overreact, or underreact to news, an hour or more before the high return or volatility events, and other traders capitalise on the reactions of these traders for their own gain. Finally this could be evidence that the market takes longer than 60 minutes to react to some news.
In future research we will attempt to establish the content of the news which appears to trigger these high return or volatility events. With this information we will then create a model which determines whether news will be “interesting” based on its content, and then ascertain how accurate these predictions are. Finally we aim to compare the performance of a trading model which incorporates content analysis of news to a traditional trading model, and establish whether this is a profitable alternative for investors.
References
Almeida, A., C. A. E. Goodhart and R. Payne, 1998. The Effects of Macroeconomic News on High Frequency Exchange Rate Behavior. Journal of Financial & Quantitative Analysis 33, 383-408.
Barberis, N., A. Shleifer and R. Vishny, 1998. A Model of Investor Sentiment. Journal of Financial Economics 49, 307-343.
Cutler, D. M., J. M. Poterba and L. H. Summers, 1989. What Moves Stock Prices? Journal of Portfolio Management 15, 4-12.
Dacorogna, M. M., R. Gencay, U. Muller, R. B. Olsen and O. V. Pictet (2001). An Introduction to High-Frequency Finance. London, Academic Press.
Daniel, K., D. Hirshleifer and A. Subrahmanyam, 1998. Investor Psychology and Security Market Under- and Overreactions. Journal of Finance 53, 1839-85.
Ederington, L. H. and J. H. Lee, 1993. How markets process information: News releases and volatility. Journal of Finance 48, 1161-1191.
Ederington, L. H. and J. H. Lee, 1995. The short-run dynamics of the price adjustment to new information. Journal of Financial & Quantitative Analysis 30, 117-134.
Ederington, L. H. and J. H. Lee, 2001. Intraday Volatility in Interest-Rate and Foreign-Exchange Markets: ARCH, Announcement, and Seasonality Effects. Journal of Futures Markets 21, 517-552.
Goodhart, C. A. E., 1989. News and the foreign exchange market. Manchester Statistical Society.
Goodhart, C. A. E., S. G. Hall, S. G. B. Henry and B. Pesaran, 1993. News Effects in a High-Frequency Model of the Sterling-Dollar Exchange Rate. Journal of Applied Econometrics 8, 1-13.
Graham, M., J. Nikkinen and P. Sahlstrom, 2003. Relative Importance of Scheduled Macroeconomic News for Stock Market Investors. Journal of Economics and Finance 27, 153-165.
Hong, H., T. Lim and J. C. Stein, 2000. Bad news travels slowly: Size, analyst coverage, and the profitability of momentum strategies. Journal of Finance 55, 265-95.
Hong, H. and J. C. Stein, 1999. A Unified Theory of Underreaction, Momentum Trading, and Overreaction in Asset Markets. Journal of Finance 54, 2143-84.
Kim, S.-J., M. D. McKenzie and R. W. Faff, 2004. Macroeconomic News Announcements and the Role of Expectations: Evidence for US Bond, Stock and Foreign Exchange Markets. Journal of Multinational Financial Management 14, 217-232.
Melvin, M. and X. Yin, 2000. Public Information Arrival, Exchange Rate Volatility, and Quote Frequency. Economic Journal 110, 644-661.
Michaely, R. and K. L. Womack, 1999. Conflict of Interest and the Credibility of Underwriter Analyst Recommendations. Review of Financial Studies 12, 653-86.
Mitchell, M. L. and J. H. Mulherin, 1994. The Impact of Public Information on the Stock Market. Journal of Finance 49, 923-50.
Mittermayer, M.-A., 2004. Forecasting Intraday Stock Price Trends with Text Mining Techniques. 37th Annual Hawaii International Conference on System Sciences (HICSS'04), Big Island, Hawaii.
Nofsinger, J. R. and B. Prucyk, 2003. Option volume and volatility response to scheduled economic news releases. Journal of Futures Markets 23, 315-345.
Oberlechner, T. and S. Hocking, 2004. Information Sources, News, and Rumours in Financial Markets: Insights into the Foreign Exchange Market. Journal of Economic Psychology 25, 407-424.
Roll, R., 1984. Orange Juice and Weather. American Economic Review 74, 861-80.
Womack, K. L., 1996. Do Brokerage Analysts' Recommendations Have Investment Value? Journal of Finance 51, 137-67.