Poor Background or Low Returns? : Why Immigrant Students in Germany Perform so Poorly in PISA
26
0
0
Full text
(2) Discussion Paper No. 05-18. Poor Background or Low Returns? Why Immigrant Students in Germany Perform so Poorly in PISA Andreas Ammermüller. Download this ZEW Discussion Paper from our ftp server:. ftp://ftp.zew.de/pub/zew-docs/dp/dp0518.pdf. Die Discussion Papers dienen einer möglichst schnellen Verbreitung von neueren Forschungsarbeiten des ZEW. Die Beiträge liegen in alleiniger Verantwortung der Autoren und stellen nicht notwendigerweise die Meinung des ZEW dar. Discussion Papers are intended to make results of ZEW research promptly available to other economists in order to encourage discussion and suggestions for revisions. The authors are solely responsible for the contents which do not necessarily represent the opinion of the ZEW..
(3) Nontechnical summary The publication of the PISA 2000 (Programme for International Student Assessment) outcomes led to a public outcry in Germany because it was placed well below the OECD average in all three test subjects. An intense political debate began in response to the negative assessment of the German students’ performance in the key subjects that have been tested. One possible reason for the low average performance of German students that was often named is the high share of immigrant students in Germany of about 20 percent, who performed on average about 56 points lower than German students, which is equivalent to one year of schooling. Especially city states like Berlin and Bremen with an above average share of immigrant students claimed to be disadvantaged compared to other states. This paper adds to the current literature by looking at the determinants of student performance separately for German and immigrant students and decomposing the gap in test scores between the groups into different effects along the student distribution, using data from the PISA extension study (PISA-E). This approach reveals those student background factors that can explain the difference in performance and shows how the importance of the different factors changes along the test score distribution. The effect of student background on student performance differs only for few variables between immigrant and German students, while the difference in student background characteristics is rather large. If immigrant students had the same student background as German students, the score gap between both groups would close by about 73 percent for reading and about 63 percent for math and science. This share is slightly decreasing along the student population. The most important differences are the higher grade level of German students, more home resources as measured by the amount of books at home and the fact that a high share of about 40 percent of all immigrant students speaks another language at home. Differences in parental education and family situation are far less important. The difference in returns between German and immigrant students is rather low and only significant for the family situation. However, the difference in the intercepts, which is the gap conditional on all student background variables and hence cannot be explained by the observable characteristics, amounts to about 25 points. The residual distribution hardly differs between the two groups of students. Overall, student performance can be better predicted by student background for immigrant than for German students. The analysis shows that both the size and the structure of the test score gap between immigrant and German students differs only slightly between the subjects in which the students have been tested. The main reason for the low performance of immigrant students can be seen in the later school enrolment and less favorable home environment for learning. Both the number of books and the language spoken at home depend on the preferences of parents. The actual education of parents and the family situation are far less influential. An unexplainable residual test score gap between German and immigrant students remains, however..
(4) Poor Background or Low Returns? Why Immigrant Students in Germany Perform so Poorly in PISA. Andreas Ammermüller Centre for European Economic Research (ZEW) [email protected]. March 2005. Abstract: Student performance of Germans and immigrants differed greatly in the 2000 PISA study. This paper analyses why the two groups of students performed so differently by estimating educational production functions, using an extension study with imputed data. The difference in the test scores is assigned to different effects, using a Juhn-Murphy-Pierce decomposition method. The analysis shows that German students have on average more favorable characteristics and experience slightly higher returns to these characteristics in terms of test scores than immigrant students. The later enrolment of immigrant students and preferences of parents as reflected by the number of books and language spoken at home are more important than parents’ education or the family setting for explaining the test score gap. Overall, the variation in test scores can be explained better by the observable characteristics for immigrant than for German students.. Keywords: Educational production, PISA-E, decomposition, immigration JEL classification: I21, H52. Acknowledgment: Thanks are due to Charlotte Lauer and Andrea Weber for helpful comments. Financial support from the European Commission IHP project “Education and Wage Inequality in Europe” contract number HPSE-CT-2002-00108 is gratefully acknowledged. The usual disclaimer applies..
(5) 1. Introduction. The publication of the PISA (Programme for International Student Assessment) outcomes led to a public outcry in Germany because it was placed well below the OECD average in all three test subjects (Baumert et al., 2001). Other European countries like Italy, Spain and even Switzerland also performed poorly, at least in some subjects (OECD, 2001). An intense political debate began in response to the negative assessment of the German students’ performance in the key subjects that have been tested. The debate spread over almost all areas of the political and economic life, as the human capital acquired in a nation’s schooling system is generally regarded as the most valuable resource of society. The debate focused on two questions: what are the reasons for the poor performance of German students and how could their performance be fostered? One reason that was often cited is the high share of immigrant students in Germany of about 20 percent, who performed relatively poorly. Especially city states like Berlin and Bremen with an above average share of immigrant students claimed to be disadvantaged compared to other states. Consequently, several studies focused on the link between immigrant background and student performance. It was shown that immigrant students in Germany select themselves already into certain primary schools (Kristen, 2003), have a higher probability of attending lower secondary school types (Bos et al., 2003) and scored on average about half a standard deviation lower than German students in the PISA study (Baumert and Schümer, 2001). Especially students who speak another language than German at home are poor performers. Stanat (2003) shows that the ranking of Germany in PISA would slightly improve if immigrant students were excluded from the comparison. An international comparison of the effect of migration background on student performance stresses that in traditional countries of immigration like Australia or Canada the social background of immigrant students is higher than in Germany, where immigrants are not selected according to their skills. Entorf and Minoiu (2004) conclude that a good command of national languages is the key to higher student performance of immigrants. Speaking the national language at home should be interpreted as a sign of integration rather than a sign of skills, however. Otherwise it would be tautological to demand a better command of languages by immigrant students in order to improve their reading literacy. Moreover, the low educational achievement of immigrants in Germany leads to a lower social status later on in life and is passed on to the next generation (Frick and Wagner, 2001).. 1.
(6) This paper tries to add to the current literature by looking at the determinants of student performance separately for Germans and immigrants and decomposing the gap in test scores between the groups into different effects along the student distribution, using data from the PISA extension study (PISA-E). This approach reveals the student background factors that can explain the difference in performance and shows how the importance of the different factors changes along the test score distribution. Differences in PISA performance concern the level of the average test scores but also the dispersion of the score distribution. The following questions arise: to what degree are student characteristics more favorable in the group of Germans and for which group are the returns to these characteristics in terms of test scores more advantageous? For example, it was already shown that immigrant students have on average a lower social background than German students. However, if the assumed negative effect of a poorer social background were smaller for immigrants, the overall impact on the average test score could still be comparable across the two groups. The analysis refrains from taking school characteristics into account because these are strongly linked to school types. However, students are sorted into school types by ability but also their social background, which includes immigration status, determines the selection into school types (Bos et. al, 2003). This leads to the problem of endogeneity of school characteristics. Therefore, this paper explains the differences between the test score distributions of German and immigrant students in Germany by student background factors only. The remainder of the paper is structured as follows. The second section introduces the PISA study and describes the data for the two groups of interest. The third section discusses the determinants of educational performance. In the fourth section, the Juhn-Murphy-Pierce decomposition is performed. Finally, the fifth section concludes with a summary of the findings and their political implications.. 2. PISA data. The Programme for International Student Assessment (PISA) tested 15 year-old students in the subjects mathematics, science and reading proficiency in the first half of 2000. The goal was not to test only the knowledge of students but rather their understanding of the subject matter and ability to apply the acquired knowledge to different situations. The testing was conducted by the OECD throughout its 28 member countries plus Brazil, Latvia, Liechtenstein and the Russian Federation. Apart from test scores, data from student, school and computer questionnaires were collected. These include information on the student 2.
(7) background, the availability and use of resources as well as the institutional setting at schools (Adams and Wu, 2002). For Germany, an extended version of the PISA study was conducted on behalf of the states’ education ministers in order to have representative data for all Länder. The so-called PISA-E study includes over 34,000 students compared to only 5,500 students in the OECD dataset. The analysis draws on the PISA-E data of 15 year-olds because a large amount of observations is needed in order to study the sub sample of immigrant students. A drawback of PISA-E is missing information on schools. The school questionnaires are not available in the publicly available dataset and schools cannot be identified. However, as we are only concerned with an analysis of student background, this does not greatly matter. For a detailed description of the German PISA study see Baumert et al. (2001). The scores are averages of plausible values, which are drawn from a distribution of values that a student with the given amount of right answers could reach as a test score. The scores have then been standardized, to an international mean of 500 and standard deviation of 100, to facilitate the comparison across countries. The weighted means and standard deviations of the scores and the variables used in the analysis are presented in Table A1 in the annex. Table A2 displays statistics of test scores and visited school types separately for the different immigrant statuses. Together with the immense background information that is provided, the PISA-E data are the most recent and detailed data on student performance for Germany. The data are clustered due to the stratified sampling design of the study. The schools that participated have been chosen first, before a random sample of the student target population was drawn. Therefore, the schools are the primary sampling units and not the students. Missing values for student background variables are the main problem of the data. For Germany, up to 16 percent of key variables such as parents’ education are missing.1 Commonly, the whole observation (student) is dropped from the regression whenever the value of any explanatory variable is missing. Including many variables in the regression thus leads to a great reduction in the number of observations that can be used for the estimations. Apart from losing valuable information, dropping students with incomplete answers to the questionnaires leads to a sample selection bias if the values are not missing randomly. Indeed, given that attentive students are more likely to both complete the questionnaire and to answer the test questions, low performing students have a higher probability of being dropped. Thus, dropping the observations with missing values would lead to an upward bias in the test scores, which can be seen in Table A2. 1. A table on the percentage of missing values is supplied by the author upon request. 3.
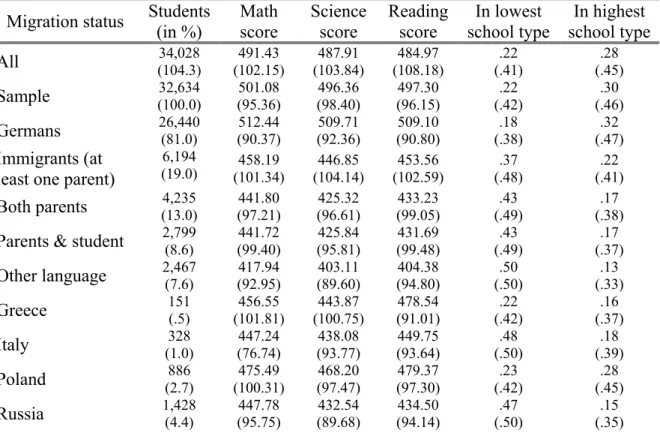
(8) The approach chosen here to overcome the problem of missing data is to predict missing values on the basis of regressions on those background variables like age, sex and the grade a student is in that are available for all students. Linear models are used for continuous variables and probit and ordered probit models for qualitative variables. Students who did not answer these elementary background questions or did not complete the tests are excluded from the regressions. This applies to less than one percent of the sample but leads to a significant increase in mean test scores and a lower standard deviation. The exclusion of outliers is necessary so that the analysis is not dominated by a small and unrepresentative subsample of the student population. The prediction of missing values on the basis of regression results is clearly no impeccable solution. The variation of the variables decreases, as can be seen in the lower standard deviations of the variables including the imputed values as compared to the original data. However, the imputed values vary greatly as well and the information of the nonimputed values of the observation is not lost. 2.1. Definition of immigrant status. This paper is motivated by the difference in the distribution of test scores between Germans and immigrant students in Germany. However, the question arises how to define Germans and immigrants. The PISA-E data provide the following variables for identifying the immigrant status: country of birth of mother, country of birth of father, country of birth of student and language spoken at home. Therefore, detailed information is available on the country of origin and the degree of integration. Table A2 provides test scores means and standard deviations for groups with different immigrant statuses. ‘Germans’ are defined as students whose parents where both born in Germany and make up 81 percent of the sample. They have significantly higher test scores in all subjects tested and are slightly more likely to attend a higher secondary school (Gymnasium) than the whole sample. Students with at least one parent born abroad are considered as ‘immigrants’ in the following parts of the paper. They are a large group of 19 percent, have significantly lower test scores than Germans and are more likely to attend the lowest secondary school (Hauptschule). When both parents are born abroad test scores are even lower and comparable in size to students who where born abroad. The group ‘Other language’ includes students who speak another language than German at home, which are 40 percent of immigrant students. These students or their parents are not fully integrated and perform far worse than other immigrants. The immigrants are also separated into groups according to the country of origin of at least one of their parents. The statistics show that 4.
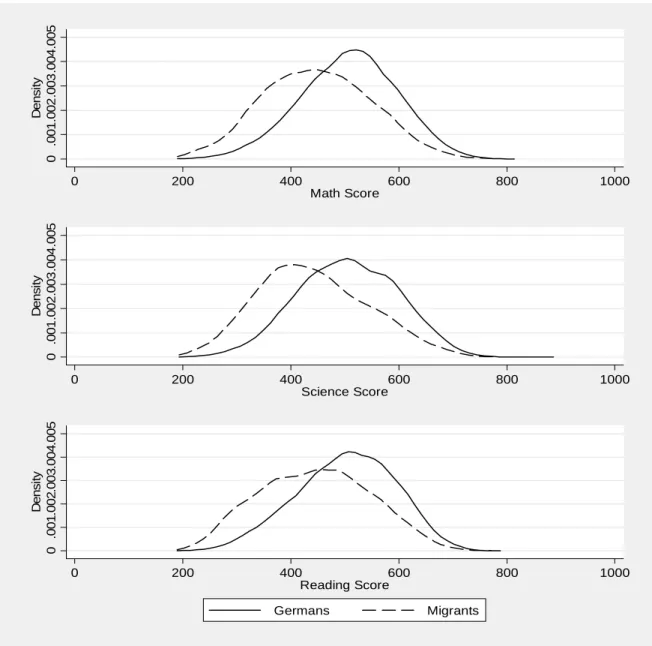
(9) students with Turkish parents are performing worst and the majority of them attend lower secondary schools. Students with a Polish migration background are performing best but still a lot worse than German students, which is also shown in Baumert and Schümer (2001). Students with Russian parents are often ethnic Germans and constitute the largest group of immigrant children even before students with Turkish parents. The share of students who speak a different language at home ranges from 34 percent for Russian students to 47 percent for students with parents from former Yugoslavia. All in all, the figures show a substantial deviation in performance between Germans and immigrants but a rather homogeneous group of immigrants. The reader should be reminded that the definitions of ‘German’ and ‘immigrant’ refer to the country of origin of the parents and not the nationality of either parents or students. 2.2. Distribution of test scores. In this part, the distributions of test scores for Germans and immigrants, i.e. students with at least one parent born abroad, will be presented graphically. For each subject, non-parametric kernel density estimates describe the score distribution of the two groups.2 Figure 1 displays the test score distributions for the three subjects that have been tested. Scores of Germans are on average higher than the scores of immigrants, which can be seen in the more right position of the German distribution and the higher weighted average score. The peak of the German distribution is also clearly to the right of the immigrant distribution, which reflects the higher mode of the kernel density estimates. Moreover, there are especially fewer low and very low performing German students. Despite the higher average scores, Germans have a lower standard deviation of scores than immigrants. This pattern holds for all three subjects in which the students have been tested.. 2. The bandwidth was chosen using Silverman’s rule of thumb (cf. Silverman, 1986). 5.
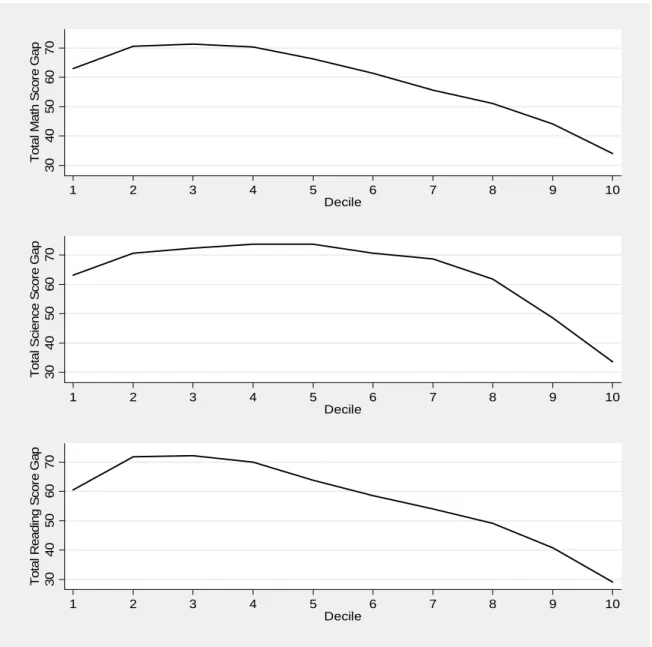
(10) Density 0 .001.002.003.004.005 0. 200. 400. 600. 800. 1000. Density 0 .001.002.003.004.005. Math Score. 200. 400 600 Science Score. 800. 1000. 0. 200. 400 600 Reading Score. 800. 1000. Density 0 .001.002.003.004.005. 0. Germans. Migrants. Figure 1: Test score distributions. Although the distributions of the test scores suggest no important difference between subjects, it could be expected that immigrants have more deficits in reading proficiency than in math or science. Therefore, the analysis will be conducted for all three subjects. The total score gaps between Germans and immigrants are shown in Figure 2. The gap is increasing for the first deciles and then declines heavily along the score distribution. It starts at about 60 points for the lowest performing decile of students, increases to 70 to 75 points and then drops to 30 to 35 points. The gap is very similar for all three subjects. The inequality in the test score distribution is hence much higher for immigrants than for German students. The increase in the test score gap for the first deciles is due to students who repeat classes. Excluding them leads to a monotonously decreasing gap. In the next step, the factors that affect the test scores for either group are analyzed.. 6.
(11) Total Math Score Gap 30 40 50 60 70 1. 2. 3. 4. 5. 6. 7. 8. 9. 10. 6. 7. 8. 9. 10. 6. 7. 8. 9. 10. Total Science Score Gap 30 40 50 60 70. Decile. 1. 2. 3. 4. 5. Total Reading Score Gap 30 40 50 60 70. Decile. 1. 2. 3. 4. 5 Decile. Figure 2: Total score gaps. 3. Determinants of reading proficiency scores. 3.1. The production function approach. A thorough comparison of student performance of the two groups of students presupposes the knowledge of the process by which education is produced. Educational production functions provide a means for understanding the production process by estimating the effects that various inputs have on student achievement. For the production function to yield unbiased estimates of the effects, all current and prior inputs into the education system that are likely to determine educational performance should be included. The cross-sectional PISA-E data give information on the background of each student. However, no information on prior 7.
(12) achievement of students or inputs into educational production at another time is available. Therefore, the estimation of educational production functions is limited by missing information over prior inputs (Todd and Wolpin, 2003). The coefficients of the following model of an educational production function can only be interpreted as causal effects under certain assumptions: Ti = β 0 + Gradei β1 + Malei β 2 + Educi β 3 + Booksi β 4 + Familyi β 5 + Langi β 6 + ε i. (1). where Ti is the test score of student i, Gradei comprises grade level dummies and a variable on student age in month, Malei is a dummy for boys, Educi a set of dummies of parental education, Booksi a set of dummies for the amount of books at home, Familys comprises dummies for siblings and an unemployed father, Langs a dummy for students speaking another language than German at home and εi is the error terms at the student level. The groups of parameters β0 to β6 are to be estimated. By including only variables on the student background and none on schools, we get the total effect of student background on performance. Any effects of background on performance that act via tracking or other mechanisms are included. The grade level dummies indicate whether the 15-year old student is in grade seven, eight, nine, or ten (reference group). With a typical schooling career, students should be in grade nine or ten. Students in grade seven or eight are likely to be repeat students. Therefore, the grade level might be endogenous because it is partly determined by prior student performance, which is linked to current performance. However, especially foreign students are likely to be put in lower grades when they attend a new school due to their language deficits at the beginning of their schooling career. Therefore, it is essential to include grade level dummies as control variables. The analysis is also performed when all repeat students are dropped from the sample to check for the robustness of the results. The overall share of repeat students is 22 percent. For immigrants, the share is significantly higher with 35 percent while it is only 19 percent for German students. Besides innate ability, which cannot be measured, the background of students has been shown to be the most decisive factor in explaining student performance (cf. Hanushek and Luque, 2002; Wößmann, 2003). The background includes besides personal characteristics like gender also information on parents’ origin and education. These variables are unlikely to change over time and are hence a good proxy also for prior inputs. Their effect on the cognitive achievement of students can therefore be interpreted as a causal relationship. 8.
(13) Finally, the language that students speak at home indicates the degree to which students and their families are integrated. About 39 percent of all immigrants speak another language than German at home, while Germans always speak German at home. 3.2. The estimated effects. The effect of the characteristics on student performance is estimated in a regression of the explanatory variables on the individual student test score (see equation (1)). Due to the clustered design of the PISA data, survey regressions are used for the estimations that allows for an interdependence of error terms between students within the same school. The public data files include no information on schools, not even an identifier. Therefore, schools are identified by their sampling weights, which differ between schools but not between students. In addition the estimations are weighted by these sampling weights. The outcomes of the weighted survey regressions with the dependent variables math, science and reading proficiency scores are presented in Table A3. Using the data with instead of without the imputed values does not affect the qualitative interpretation of the results but makes them more representative of the student population. The R2 of the regressions indicate that 39 percent of the variation in reading test scores can be explained for immigrant students and only 31 percent of the variation in German reading scores. The performance of immigrant students depends therefore more highly on factors that can be observed and slightly less on unobserved factors (e.g. related to innate ability) than for German students. Even when the language dummy is not included in the regression for immigrants, the R² of .37 is still higher. In all three subjects the R2 is about 24 to 29 percent higher for immigrant students than for Germans, while the level of the R2 is highest for reading proficiency. The higher R² for immigrant students also rebuts the hypothesis that the data quality may be worse for immigrant than for German students. If this were the case, the measurement error would lead to a lower explanatory power of model (1) for immigrants than for Germans unless social background had an even higher impact for immigrants than depicted here. An additional year of schooling adds between 38 and 63 points for Germans and 39 and 48 points for immigrants to the test score, which is around half a standard deviation. This magnitude makes clear how large the test score gap of 56 points between immigrants and Germans actually is. This is exactly the same difference as between the German and Finnish PISA results (cf. Ammermüller, 2004). The coefficient for age is negative, which is not due to. 9.
(14) grade repetition but rather to a selection effect at the age of school entry. More able students seem to enroll at an earlier age. This is shown in sensitivity analyses of the results. The student background variables are highly significant and have a high impact on student performance.3 For example, students whose parents do not even have completed secondary education score 52 points lower for immigrants, respectively 62 points lower for Germans in reading proficiency compared to students whose parents have completed tertiary education, all else equal. The penalty for an unfavorable student background is higher for Germans than for immigrants in reading proficiency but not for the other two subjects math and science. In general the results oppose the finding by Gang and Zimmermann (2000) that parental education has an effect on educational achievement of the next generation for Germans but not for immigrants. Boys perform significantly worse than girls in reading proficiency but better in math and science, especially among German students. The number of books at a student’s home has a highly significant and large effect on performance for both groups but the effect is generally higher for Germans, except for science. Having a sibling has a negative effect, which is higher for immigrant students. An unemployed father leads to lower test scores among German students but not among immigrant students. Speaking a different language at home has a highly negative effect on student performance, which is of course largest for reading proficiency. When German and immigrant students are pooled in one regression, only few effects differ significantly between Germans and immigrants. The significant interaction effects are positive for 7th and 8th grade and for some book dummies. The interaction effects are jointly significant, though. The coefficient of the immigrant dummy ranges between minus 9 points for math and minus 21 points for reading and is always highly significant in the regression of test scores on background characteristics including ‘immigrant’ and interaction effects. When school type dummies are added as explanatory variables, the effect of being an immigrant is not significantly different from zero. School type dummies hence absorb most of the negative effect on student performance of being an immigrant. The further analysis is performed for student background variables only in order to include the effect which they have on selection into school types and to circumvent the problem of endogeneity of the school type variables. These are endogenous because both student performance and school type depend on innate ability.. 3. This is confirmed by the marginal effects and is also the result of studies using TIMSS data (e.g. Ammermüller et al., 2005). 10.
(15) After having shown the determinants of student performance for the two groups, the following section compares the results more systematically by decomposing the score gap between Germans and immigrants into different components.. 4. Explaining the test score gap. The difference observed between the test score distributions for Germans and immigrants may be due to several reasons. First, German students may have a more favorable endowment in characteristics measured by the explanatory variables. German students might for example have better educated parents, who exert a positive influence on the performance of their children. Second, the effects of the different characteristics on the performance of students might differ between the two groups of students. In other words, the same characteristics might be less efficient in producing reading literacy for immigrants than for Germans. A greater return to family background characteristics in terms of test scores would imply a higher social differentiation of students. The educational achievement is then predetermined to a higher degree by the family of a student and students from lower social backgrounds find it harder to perform well at school. Third, a part of the test score gap is due to the difference in the residuals of the estimated regressions. Any unobserved factors that affect skills, foremost innate ability of students and their motivation, constitute the residual effect. As the expected value of the residuals is zero, the residual effect is only important when we consider the test score gap at other points of the score distribution than the mean. These three effects, referred to as the characteristics, the return and residual effect can be quantified by the following decomposition method. 4.1. Juhn-Murphy-Pierce decomposition. This decomposition technique was first employed by Juhn et al. (1993) for a decomposition of change across time. It is also applicable to cross-section data (e.g. Blau and Kahn, 1992), like the PISA data. The method has the distinct advantage of considering not only the mean for the decomposition but the whole distribution. Moreover, it deals explicitly with the residuals from the estimation of the production function, which are equal to zero at the mean but not at specific quantiles. Following a slightly different approach, it allows one to decompose the score gap into a characteristics, return, characteristics-return and residual effect.. 11.
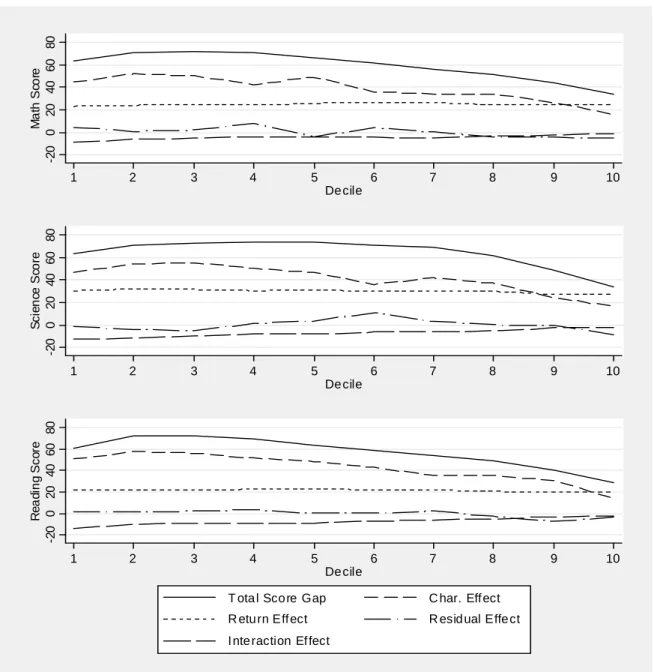
(16) The residual εi of group y can be thought of consisting of two components: the percentile of an individual i in the residual distribution θi, and the distribution function of the residuals, Fi. The inverse cumulative residual distribution function then gives us:. ε. y i. = F. y −1. (θ. y i. | X. y i. ) ,. (2). where X comprises the six sets of explanatory variables of student group y. Using the estimates from unweighted survey regressions of model (1), the actual and two hypothetical test score distributions for immigrant students can be constructed:. )M M −1 M i = β X i + F M (θ iM | X iM ). (3). )G M −1 M (1)i = β X i + F G (θ iM | X iM ). (4). )M M −1 M ( 2)i = β X i + F G (θ iM | X iM ). (5). The first hypothetical distribution M(1) shows what scores immigrant students would attain if they experienced the production process of German students and the corresponding residuals from the German residual distribution. Equation (5) presents the second hypothetical distribution M(2), which assumes that the characteristics of immigrant students are transformed into test scores by the immigrant returns, but that the residual distribution is the same as for German students. The two hypothetical German distributions are created likewise. The characteristics effect is then the difference between the test score distributions for G(1) and M. The return effect equals the difference between the two hypothetical test score functions M(1) and M(2). The third effect is due to the different distribution of residuals in the two groups and can be calculated by subtracting M from M(2). The interaction effect can be constructed as (G-G(1))-(M(1)-M). Adding up all four effects leads to the total gap (G-M) that is explained here. The resulting differences between the score distributions are discussed in the following section. 4.2. The effects and their components. First, the course of the aggregated effects is shown over the deciles of the test score distribution. Figure 3 displays the total score gap and the overall effects.. 12.
(17) Math Score -20 0 20 40 60 80 1. 2. 3. 4. 5. 6. 7. 8. 9. 10. 6. 7. 8. 9. 10. 6. 7. 8. 9. 10. Science Score -20 0 20 40 60 80. Decile. 1. 2. 3. 4. 5. Reading Score -20 0 20 40 60 80. Decile. 1. 2. 3. 4. 5 Decile. T otal Score Gap. C har. Effect. R eturn Effect. R esidual Effect. Interaction Effect. Figure 3: Overall effects. The characteristics effect is always positive and mostly higher than the return effect. On average, the difference in characteristics can explain 73 percent of the reading test score gap. For math and science, this figure is about 63 percent. The characteristics effect decreases steadily, implying that the characteristics of immigrant students are deteriorating comparatively more when going down the score distribution and thus that the inequality in characteristics is larger for immigrant students than for Germans. The return effect is almost constant over the distribution and can explain about 40 to 49 percent of the test score gaps. The problem of converting the given student background of immigrant students into high performance is thus present along the whole score distribution. The residual distributions for both groups are comparable, which is shown by the tiny residual effect. The interaction effect is slightly negative and increasing. The negative interaction effect implies that immigrant 13.
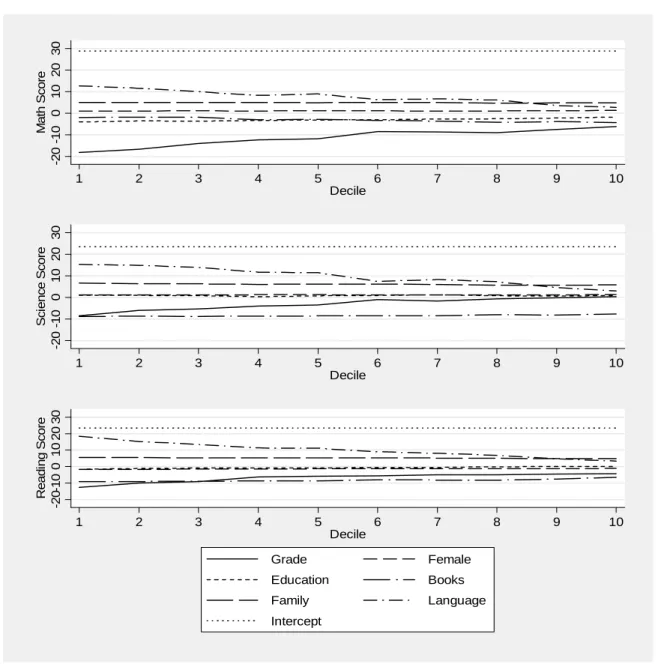
(18) students would actually score lower if they had not more of those characteristics than German students whose returns are higher for immigrants than for Germans. For the relative effects see Figure A1 in the Appendix. Now we turn to the composition of the effects. Figure 4 displays the six components of the characteristics effect. The figure shows that immigrant students score lower mainly because they are in lower classes due to later school enrolment and because the home environment for learning is less favorable, as indicated by the amounts of books and the language spoken at home. The family situation and education of parents have a far lower impact, however, which is surprising. This implies that parents’ preferences are more important than the level of education. Performing the analysis without age and the grade level dummies in order to test for their endogeneity leads to very similar results, where only the. 0. Math Score 5 10 15 20 25. characteristics effect of ‘Language’ is higher.. 1. 2. 3. 4. 5. 6. 7. 8. 9. 10. 6. 7. 8. 9. 10. 6. 7. 8. 9. 10. 0. Science Score 5 10 15 20 25. Decile. 1. 2. 3. 4. 5. 0. Reading Score 5 10 15 20 25. Decile. 1. 2. 3. 4. 5 Decile Grade. Female. Education. Books. Family. Language. Figure 4: The components of the characteristics effect 14.
(19) Figure 5 shows the return effect separately for each group of variables. The largest positive effect is due to the difference in the intercepts and thus cannot be explained. The fact that speaking another language at home has a highly negative impact on student performance adds to the positive return effect. There is hardly any return effect for student gender, the number of books at home and parental education, while the family setting contributes to the gap. While the family situation is comparable between German and immigrant students, the latter experience a higher negative impact of having a sibling. The return effect for ‘Grade’ is slightly negative and increasing. Dropping ‘Grade’ from the analysis leads once again to a. Math Score -20 -10 0 10 20 30. higher effect of ‘Language’.. 1. 2. 3. 4. 5. 6. 7. 8. 9. 10. 6. 7. 8. 9. 10. 6. 7. 8. 9. 10. Science Score -20 -10 0 10 20 30. Decile. 1. 2. 3. 4. 5. Reading Score -20-10 0 10 20 30. Decile. 1. 2. 3. 4. 5 Decile Grade. Female. Education. Books. Family. Language. Intercept. Figure 5: The components of the return effect. In order to check for the robustness of the results, the decomposition was also performed when all repeat students have been dropped, when all imputed values have been dropped and 15.
(20) when all students were included in the analysis, even those with scores of below 200 points. Dropping repeat students from the analysis leads to identical overall effects, only the components of the return effect change. Student’s age and the grade level dummies then have a slight positive impact except for the lowest deciles instead of a negative impact. For German students the negative impact of being older or in a younger grade decreases while it hardly changes for immigrant students. This implies that repeat students, who are rather old and in a lower grade, score rather lower than their fellow German students while for immigrants the difference between repeat and other students is less strong. Dropping observations with imputed values or not dropping students with extremely low scores has hardly any impact on the results. A possible further step in the decomposition analysis would be to consider the estimated coefficients along the conditional distribution, not only at the mean of the distribution. However, the coefficients estimated by quantile regressions do not differ significantly from OLS coefficients, only for very few coefficients and some quantiles. Thus, a decomposition using quantile regressions does not seem to add relevant insights and is therefore not conducted.. 5. Conclusion. Immigrant students have a higher probability of attending lower school types in Germany, have on average a lower social background and show a much lower performance than German students. This paper adds to these well-known facts by analyzing the determinants of student performance and decomposing the difference in performance along the student population, using data from the PISA-E study on student performance of 15-year olds. The gap in test scores between German and immigrant students amounts on average to an astonishingly high 56 points, which is about as large as the effect of an additional year of schooling. The test score gap increases for the first few deciles of the student population up to 70 points and falls to about 35 points for the highest scoring decile of the student groups. Hence, the problem lies at the lower end of the score distribution of immigrant students, which perform extremely poorly. Looking at the country of origin reveals no great differences within the group of immigrant students. The effect of student background on student performance differs only for few variables between immigrant and German students, while the difference in student background characteristics is rather large. If immigrant students had the same student background as German students, the score gap between both groups would close by about 73 16.
(21) percent for reading and about 63 percent for math and science. This share is slightly decreasing along the student population. The most important differences are the higher grade level of German students, more home resources as measured by the amount of books at home and the fact that a high share of about 40 percent of all immigrant students speaks another language at home. Differences in parental education and family situation are far less important. If immigrant students had the same returns to student background as German students, the test score gap would decrease by about 40 to 49 percent. For the highest decile, i.e. the best performing ten percent of both groups, the return effect is actually higher than the characteristics effect. However, the difference in the intercepts, which is the gap conditional on all student background variables and hence cannot be explained by the observable characteristics, amounts to about 25 points and contributes most to the return effect. Excluding the intercepts from the return effect shows that the difference in returns has no explanatory power for the test score gap. The effect of speaking another language and the effect of the family situation add to the positive return effect. Both the negative effect of having a sibling and having an unemployed father are larger in absolute terms for immigrant students. The residual distribution hardly differs between the two groups of students, while the interaction effect is slightly negative. The analysis shows that both the size and the structure of the test score gap between immigrant and German students differs only slightly between the subjects in which the students have been tested. The main reason for the low performance of immigrant students can be seen in the later enrolment of immigrant students and the less favorable home environment for learning. Both the number of books and the language spoken at home depend on the preferences of parents. The actual education of parents and the family situation are far less influential. An unexplainable residual test score gap between German and immigrant students remains, however. Policies to foster the educational achievement of immigrant students in Germany could include an earlier enrolment in school, which is only feasible when immigrant children already receive language training before school entry age. Moreover, also from the side of parents the will to improve the home environment for learning and to promote the language skills of their children has to increase.. 17.
(22) References Adams, R. and Wu, M. (2002), PISA 2000 Technical Report, OECD, Paris. Ammermüller, A. (2004), PISA: What makes the difference – Explaining the gap in PISA test scores between Finland and Germany, ZEW Discussion Paper No. 04-04, Mannheim. Ammermüller, A., H. Heijke and L. Wößmann (2005), Schooling quality in Eastern Europe: Educational production during transition, Economics of Education Review, forthcoming. Baumert, J. and G. Schümer (2001), Familiäre Lebensverhältnisse, Bildungsbeteiligung und Kompetenzwettbewerb, in: Deutsches PISA Konsortium (Ed.), PISA 2000. Basiskompetenzen von Schülerinnen und Schülern im internationalen Vergleich. Opladen: Leske und Budrich, 323-407. Baumert, J. and Deutsches PISA-Konsortium (2001), PISA 2000 : Basiskompetenzen von Schülerinnen und Schülern im internationalen Vergleich, Opladen: Leske und Budrich. Bos, W., Lankes, E.-M., Prenzel, M., Schwippert, K., Walther, G. and R. Valtin (Hrsg.) (2003), Erste Ergebnisse aus IGLU. Schülerleistungen am Ende der vierten Jahrgangsstufe im internationalen Vergleich, Waxmann, Münster. Blau, F. and L. Kahn (1992), The gender earnings gap: Learning from international comparisons, The American Economic Review Vol. 82(2), Papers and Proceedings of the Hundred and Fourth Annual Meeting of the American Economic Association, 533-538. Entorf, H. and N. Minoiu (2004), What a difference immigration law makes: PISA results, migration background and social mobility in Europe and traditional countries of immigration, ZEW Discussion Paper No. 04-17, Mannheim. Frick, J. and G. Wagner (2001), Economic and Social Perspectives of Immigrant Children in Germany, IZA Discussion Paper No 301.. 18.
(23) Gang, I. and K. Zimmermann (2000), Is child like parent? Educational attainment and ethnic origin, Journal of Human Resources 35, 550- 569. Hanushek, E. and J. Luque (2003), Efficiency and equity in schools around the world, Economics of Education Review Vol. 22(5), 481-502. Juhn, C., K. Murphy and B. Pierce (1993), Wage inequality and the rise in returns to skill, The Journal of Political Economy Vol. 101(3), 410-442. Kristen, C. (2003), School choice and ethnic school segregation: Primary school selection in Germany, Dissertation, MZES Mannheim. Lauer, C. (2000), Gender wage gap in West Germany: How far do gender differences in human capital matter?, ZEW Discussion Paper No. 00-07, Mannheim. OECD (2001), Knowledge and Skills for Life: First Results from PISA 2000, OECD, Paris. Silverman, B. (1986), Density estimation for statistics and data analysis, London: Chapman & Hall. Stanat,. P.. (2003),. Schulleistungen. von. Jugendlichen. mit. Migrationshintergrund:. Differenzierung deskriptiver Befunde aus PISA und PISA-E, in: Deutsches PISA-Konsortium (Ed.), PISA 2000. Ein differenzierter Blick auf die Länder der Bundesrepublik Deutschland, Opladen: Leske und Budrich, 243-260. Todd, P. and K. Wolpin (2003), On the specification and estimation of the production function for cognitive achievement, The Economic Journal Vol. 113(485). Wößmann, L. (2003), Schooling resources, educational institutions, and student performance: The international evidence, Oxford Bulletin of Economics and Statistics 65 (2), 117-170.. 19.
(24) Appendix Table A1: Weighted means and standard deviations. Germans Score math Score science Score reading Student’s age 7th grade 8th grade 9th grade 10th grade (reference) Male Parents no secondary educ. Lower secondary education Higher secondary education Tertiary education (reference) Books cat. 1 Books cat. 2 Books cat. 3 Books cat. 4 Books cat. 5 Books cat. 6 (reference) Sibling Father unemployed Other language. Immigrants. Mean. Std. deviation. Mean. Std. deviation. 512.44 509.71 509.10 6.47 0.01 0.10 0.62 0.27 0.49 0.02 0.24 0.47 0.27 0.05 0.18 0.22 0.24 0.18 0.14 0.79 0.03 0.00. 90.37 92.36 90.80 3.40 0.08 0.30 0.49 0.44 0.50 0.15 0.43 0.50 0.44 0.22 0.38 0.41 0.43 0.38 0.34 0.41 0.17 0.00. 458.19 446.85 453.56 6.54 0.04 0.23 0.55 0.18 0.50 0.14 0.15 0.51 0.21 0.14 0.27 0.23 0.17 0.10 0.08 0.81 0.04 0.39. 101.34 104.14 102.59 3.38 0.19 0.42 0.50 0.38 0.50 0.34 0.36 0.50 0.41 0.35 0.44 0.42 0.38 0.30 0.28 0.38 0.19 0.49. Table A2: Weighted means (st. dev.) of selected variables by migration status. Migration status All Sample Germans Immigrants (at least one parent) Both parents Parents & student Other language Greece Italy Poland Russia. Students (in %). Math score. Science score. Reading score. In lowest school type. In highest school type. 34,028 (104.3) 32,634 (100.0) 26,440 (81.0) 6,194 (19.0). 491.43 (102.15) 501.08 (95.36) 512.44 (90.37) 458.19 (101.34) 441.80 (97.21) 441.72 (99.40) 417.94 (92.95) 456.55 (101.81) 447.24 (76.74) 475.49 (100.31) 447.78 (95.75). 487.91 (103.84) 496.36 (98.40) 509.71 (92.36) 446.85 (104.14) 425.32 (96.61) 425.84 (95.81) 403.11 (89.60) 443.87 (100.75) 438.08 (93.77) 468.20 (97.47) 432.54 (89.68). 484.97 (108.18) 497.30 (96.15) 509.10 (90.80) 453.56 (102.59) 433.23 (99.05) 431.69 (99.48) 404.38 (94.80) 478.54 (91.01) 449.75 (93.64) 479.37 (97.30) 434.50 (94.14). .22 (.41) .22 (.42) .18 (.38) .37 (.48) .43 (.49) .43 (.49) .50 (.50) .22 (.42) .48 (.50) .23 (.42) .47 (.50). .28 (.45) .30 (.46) .32 (.47) .22 (.41) .17 (.38) .17 (.37) .13 (.33) .16 (.37) .18 (.39) .28 (.45) .15 (.35). 4,235 (13.0) 2,799 (8.6) 2,467 (7.6) 151 (.5) 328 (1.0) 886 (2.7) 1,428 (4.4). 20.
(25) 409 (1.3) 1,102 (3.4) 2,033 (6.2). Yugoslavia Turkey Other. 436.38 (103.95) 405.04 (85.94) 491.87 (101.77). 417.31 (107.77) 403.41 (94.03) 472.04 (115.03). 433.44 (107.72) 400.03 (91.07) 483.73 (103.83). .40 (.49) .53 (.50) .28 (.45). .17 (.38) .11 (.31) .33 (.47). Table A3: Coefficients of weighted survey regressions. Math Germans coef.. SE. Science. immigrants coef.. SE. -3.12* 0.35 -3.56* 0.76 Student's age th -117.66* -166.62* 12.88 13.75 7 grade -109.78* 5.59 -90.27* 11.30 8th grade -48.44* 4.32 -42.23* 9.38 9th grade 23.18* 2.45 23.27* 4.55 Male Parents no sec. -55.60* 8.69 -55.45* 9.04 educ. Lower sec-30.49* 3.09 -27.98* 6.74 ondary educ. Higher sec-23.45* 2.78 -27.12* 5.75 ondary educ. -94.66* 7.43 -102.63* 12.22 Books cat. 1 -59.31* 4.18 -71.16* 9.61 Books cat. 2 -43.52* 3.90 -34.41* 9.84 Books cat. 3 -25.65* 3.78 -31.32* 9.84 Books cat. 4 -6.93‡ 3.73 -2.48 10.08 Books cat. 5 -2.31 2.91 -9.78† 5.24 Sibling -11.40 6.31 6.58 10.66 Father unempl. -16.63* 5.52 Other language Immigrant dummy from -7.37* (12.53) joint estimation 617.24* 6.30* 606.02* 11.37* Intercept 14,689 3,399 Observations 0.2681 0.3471 R² 110.40 61.56 F-Test. Germans coef.. Reading. immigrants. SE. coef.. SE. Germans coef.. immigrants. SE. coef.. SE. -2.52*. 0.36. -3.01*. 0.84. -3.16*. 0.25. -2.84*. 0.51. -152.40*. 9.44. -121.38*. 22.13. -160.00*. 8.50. -129.69*. 15.47. -89.19*. 6.01 -79.26*. 16.92. -103.45*. 5.14. -87.59*. 12.82. -37.75*. 4.62 -39.35*. 13.68. -44.41*. 4.07. -40.92*. 9.96. 11.34†. 5.73. -19.66*. 2.11. -16.26*. 4.31. -51.79*. 8.20 -61.69*. 12.87. -61.55*. 6.32. -52.34*. 6.07. -35.61*. 3.73 -31.11*. 6.55. -38.59*. 2.58. -30.70*. 4.69. -25.52*. 3.19 -36.17*. 5.87. -30.07*. 2.40. -32.97*. 4.05. -109.71*. 6.15 -80.29*. 10.80. -105.13*. 4.56. -89.54*. 8.94. -71.61*. 4.21 -67.51*. 10.45. -64.93*. 3.20. -61.61*. 7.07. -54.03*. 4.13 -28.74*. 9.72. -48.41*. 3.20. -30.28*. 6.20. -30.82*. 3.72. -15.69. 10.30. -24.20*. 2.85. -14.67†. 6.62. -9.82*. 3.55. 2.30. 10.00. -7.00*. 2.71. 2.51. 7.27. -8.48*. 2.26 -16.08*. 4.91. -7.95*. 1.76. -12.90*. 3.75. 6.59. 8.34. 9.49. -11.75*. 4.04. -4.94. 7.96. -28.16*. 7.34. -31.42*. 5.38. 16.64*. 2.43. -3.64. -9.53* (15.78) 618.99*. 5.96*. -21.07* (9.53). 601.43*. 15.92*. 14,713. 3,381. 0.2554 132.53. 644.06*. 618.15*. 9.90*. 6,194. 0.3302. 0.3127. 0.3884. 41.41. 182.74. 90.84. Standard errors are cluster-robust. Significance level: 1 percent:* 5 percent: † 10 percent: ‡ .. 21. 5.17*. 26,440.
(26) Math Score -.2 0 .2 .4 .6 .8 1. 2. 3. 4. 5. 6. 7. 8. 9. 10. 6. 7. 8. 9. 10. 6. 7. 8. 9. 10. Science Score -.2 0 .2 .4 .6 .8. Decile. 1. 2. 3. 4. 5. Reading Score -.2 0 .2 .4 .6 .8. Decile. 1. 2. 3. 4. 5 Decile. Char. Effect. Residual Effect. Return Effect. Interaction Effect. Figure A1: Relative effects of the decomposition. 22.
(27)
Figure

+5


Related documents
For each experiment, we report four key statistics: the average borrowing interest rate, debt relative to household earnings, the fraction of households declaring bankruptcy, and
El segundo análisis comparativo, con un total de 33 compuestos para los que se dispone de los valores de LC50 en humano y de LD50 en rata, se dirige a evaluar qué ensayos de
Successful treatment of an acute migraine attack is the cor- nerstone of effective migraine management but it is only the begin- ning of managing the nervous system of a
down in the Ministerial Order on Technical and Commercial Academy Profession and Professional Bachelor Programmes As part of the AP Degree Programme in Design, Technology
Under the transitional rules included in the GST Act, GST registered businesses were to allowed to claim a refund of sales tax paid on goods that were held in stock at 1 April
This study introduces the concept of CBI into the hotel brand loyalty development equation, testing its relationships with brand loyalty as well as with several established loyalty
It was found that lower socioeconomic status, relatively inadequate marital conflict strategies, and fewer marital conflicts predicted higher child abuse poten- tial.. In
E STIMATING for electrical contractor using standard estimating processes and estimate (RFI) tracking or use industry specific functionality such as estimating/takeoff software
