Policy Research Working Paper
5124
Disparities in Labor Market Performance
in the Philippines
Xubei Luo
The World Bank
East Asia and Pacific Region
Poverty Reduction and Economic Management Department
November 2009
WPS5124
Public Disclosure Authorized
Public Disclosure Authorized
Public Disclosure Authorized
Produced by the Research Support Team
Abstract
The Policy Research Working Paper Series disseminates the findings of work in progress to encourage the exchange of ideas about development issues. An objective of the series is to get the findings out quickly, even if the presentations are less than fully polished. The papers carry the names of the authors and should be cited accordingly. The findings, interpretations, and conclusions expressed in this paper are entirely those of the authors. They do not necessarily represent the views of the International Bank for Reconstruction and Development/World Bank and its affiliated organizations, or those of the Executive Directors of the World Bank or the governments they represent.
Policy Research Working Paper 5124
The Philippine economy has been growing rapidly, at an annual growth rate of 5 percent over the past five years. Such decent growth in gross domestic product, however, did not translate into an increase in household income. Wage income declined in real terms. The poverty headcount increased slightly. The fruits of economic growth were not shared equally across the country. Challenges remain to create more jobs to keep pace with the rapidly growing active population.
Using the Philippines Labor Force Survey data (2003– 2007), this paper reviews the disparities in labor market performance and examines the contribution of regional and individual characteristics. The results show that real wages declined and disparities widened between the National Capital Region and other islands. The youth, less educated, and women face more challenges in finding
This paper—a product of the Poverty Reduction and Economic Management Department, East Asia and Pacific Region—is prepared as a background paper for the Philippines Inclusive Growth report.. Policy Research Working Papers are also posted on the Web at http://econ.worldbank.org. The author may be contacted at xluo@worldbank.org.
employment with a decent salary, other things being equal. Disparities in labor market performance are largely associated with the difference in regional structure and human capital endowment. Individual characteristics account for roughly one-third of the difference in wages between the National Capital Region and other regions; regional structures and other unobservable factors account for two-thirds of the difference.
As labor market opportunities and returns to education and other individual talents significantly differ across regions, implementation of appropriate regional labor market policies is important. Human capital, however, remains a key determinant in employment and wages. Concerted efforts to improve education will also be important.
Disparities in Labor Market Performance in the Philippines
Xubei Luo* The World Bank
Key Words: Employment, wage, disparities.
* The author would like to thank Jehan Arulpragasam, Jean-Jacques Dethier, Swati Ghosh, Ulrich Lächler, Silvia
Redaelli, Erwin Tiongson, and Nong Zhu for useful comments, and Takanobu Terada for excellent research assistance. Email: xluo@worldbank.org.
2 1. Labor market performance in the Philippines
Despite decent economic growth, labor market performance in the Philippines was less than satisfactory in the past five years. Real wages slightly declined and new job creation lagged behind the rapid increase in working-age population. Compared with other countries in East Asia, the employment rate is relatively low in the Philippines.
1.1Changes over time
Based on the Labor Force Survey (LFS) data for 2003-2007, the labor force participation rate, the employment rate, and the real wage rate all declined over the period, while the working age population rate increased marginally (Table 1). 1 In the context of a slight increase in working-age population, a 2 percent decline in the participation rate and the employment rate suggest a worrisome trend of limited job creation for a rapidly growing population. A 5 percent decline in real wages stands in contrast with the rapid economic growth. On average, 66 percent of the population was in the working age range, of which 62 percent participated in the labor force and 58 percent were employed. The mean daily wage was 195 PHP in 2000 constant terms.
Table 1: Labor Market Indicators in the Philippines (2003-2007)
Working Age Population Labor force participation rate Employment rate to working-age population NSO unemployment rate to participation Daily wage (2000 PHP) 2003 65.5% 63.0% 59.2% 6.2% 201 2004 65.9% 62.2% 58.0% 6.8% 197 2005 66.4% 63.2% 58.5% 7.4% 194 2006 66.8% 62.2% 57.7% 7.3% 190 2007 65.8% 61.2% 57.4% 6.3% 193 2003 - 2007 66.1% 62.4% 58.1% 6.8% 195 Source: LFS, 2003-2007.
Note: We employed the definitions of the National Statistics Office (NSO) of the Philippines for active
(working-age) population, participation rate, employment rate and unemployment rate. Active population rate is the ratio of working-age population (aged 15 years and above) to the country's total population. Labor force participation rate is the ratio of the working-age population that is either employed or unemployed to the overall size of their cohort (national population of the same age range). Employment rate is the percentage of work force that works or has a job to return during the reference period. Compared with ILO, the NSO employs a broader definition of unemployment as the proportion of labor force that does not work, is available for work and (1) is actively looking for work or (2) is not looking for work because of following reasons: (a) belief that there is no job available; (b) awaiting results of previous job application; (c) temporary illness; (d) bad weather, and (e) waiting for job recall. According to the LFS, daily wage is measured as the basic pay per day of the employees of private household, private establishment, government (corporation) and own family-operated business.
1.2International comparison
From a cross-country perspective, the Philippines’ labor market indicators are middling among other East Asian countries (Table 2, Table 3 and Table 4). The participation rate in the Philippines as percent of total population in 2007 (61 percent) was low compared to other East
1 There are four rounds of Labor Force Survey each year in January, April, July, and October. We use only the
October round for this study. We use the pooled data as if they were a single sample from a larger survey fielded over a longer period to calculate the mean level for 2003-2007; and use the single round data to calculate the mean level of each year and examine the changes over time.
3
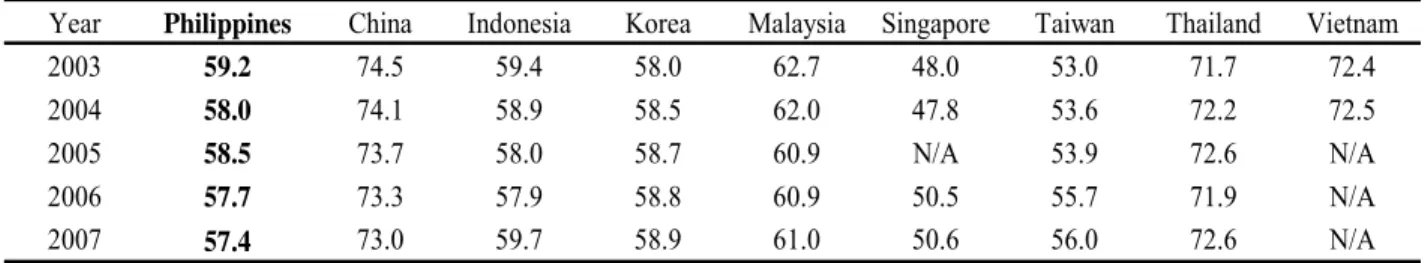
Asian countries – it was only slightly higher than Taiwan (58 percent) but lower than most other comparator countries. The employment rate as percent of working age population of the Philippines (57 percent) was also relatively low, compared with countries such as China (79 percent) and Thailand (74 percent). The relative high unemployment rate in the Philippines (6.4 percent in 2007) may to some extent be related to its definition. 2
Table 2: Participation Rate to Total Working Age Population in Selected East Asian Economies
Year Philippines China Indonesia Korea Malaysia Singapore Taiwan Thailand Vietnam
2003 63.0 77.1 67.2 60.9 66.9 65.5 55.8 73.0 73.7
2004 62.2 77.8 67.4 61.5 66.9 65.5 56.1 73.4 73.2
2005 63.2 78.4 67.6 61.4 66.9 65.4 56.2 73.7 73.0
2006 62.2 78.9 66.7 61.3 66.8 65.3 57.9 72.9 72.9
2007 61.2 79.4 67.7 60.9 67.0 65.0 58.2 73.6 72.6
Source: LABORSTAT, ILO
Note: Working Age Population is defined as the population over 15 years old except in Malaysia where it is defined
as the population over 15 years old and under 65 years old.
Table 3: Employment Rate to Total Working Age Population in Selected East Asian Economies
Year Philippines China Indonesia Korea Malaysia Singapore Taiwan Thailand Vietnam
2003 59.2 74.5 59.4 58.0 62.7 48.0 53.0 71.7 72.4
2004 58.0 74.1 58.9 58.5 62.0 47.8 53.6 72.2 72.5
2005 58.5 73.7 58.0 58.7 60.9 N/A 53.9 72.6 N/A
2006 57.7 73.3 57.9 58.8 60.9 50.5 55.7 71.9 N/A
2007 57.4 73.0 59.7 58.9 61.0 50.6 56.0 72.6 N/A
Source: LABORSTAT, ILO
Table 4: Unemployment Rate to Total Labor Force in Selected East Asian Economies
Year Philippines China Indonesia Korea Malaysia Singapore Taiwan Thailand Vietnam
2003 6.2 4.3 9.7 3.6 3.6 5.9 5.0 1.5 2.3
2004 6.8 4.2 9.9 3.7 3.5 5.8 4.4 1.5 2.1
2005 7.4 4.2 11.2 3.7 3.5 N/A 4.1 1.4 N/A
2006 7.3 4.1 10.3 3.5 3.3 4.5 5.1 1.2 N/A
2007 6.3 4.0 9.1 3.2 3.2 4.0 5.1 1.2 N/A
Source: LABORSTAT, ILO
Note: The definition of unemployed is slightly different across countries. See LABORSTAT for details. 2. Disparities in labor market performance across regions
Labor market performance varies widely across regions in the Philippines, especially between the National Capital Region (NCR) and the other three island groups (Luzon, Visayas, and Mindanao). This is related to their significant difference in industrial structure and sources of employment (Table 5).3 In NCR, the share of agriculture is negligible, and the industrial and
2 According to the NSO definition, the unemployed in the Philippines includes discouraged worker, the temporary
laid-offs, temporary disabled and etc. See Annex 1 for details.
4
services sectors account for about 30 percent and 70 percent of regional GDP (20 percent and 80 percent of employment), respectively. In Luzon, Visayas, and Mindanao, one-sixth to one-third of regional GDP and one-third to half of employment came from agriculture, while less than half of regional GDP and employment came from services.4
Table 5: Regional GDP and Source of Employment by Industry Group GDP per capita (2000 PHP) Share of GDP Share of Employment Share of GDP Share of Employment Share of GDP Share of Employment NCR 109,326 0.0% 0.9% 31.4% 21.4% 68.6% 78.1% Luzon 27,979 21.8% 35.1% 34.8% 17.6% 43.4% 47.3% Visayas 31,048 16.4% 40.7% 30.3% 13.8% 53.3% 45.4% Mindanao 26,680 31.3% 50.7% 28.5% 9.3% 40.2% 40.0% Philippines 38,861 14.5% 35.8% 31.8% 19.5% 53.7% 49.0%
Agriculture Industry Service
Source: Philippine National Statistical Coordination Board and Bureau of Labor and Employment Statistics.
Employment data are for 2006 and GDP data are for 2007.
The unique labor market environment in NCR is characterized by high active population rate, low participation rate, low employment rate, high unemployment rate, and high daily wage (Table 6).5 The scenarios in Mindanao and Visayas are at the other end of the spectrum, characterized by low active population rate, high participation rate, high employment rate, low unemployment rate, and low daily wage.
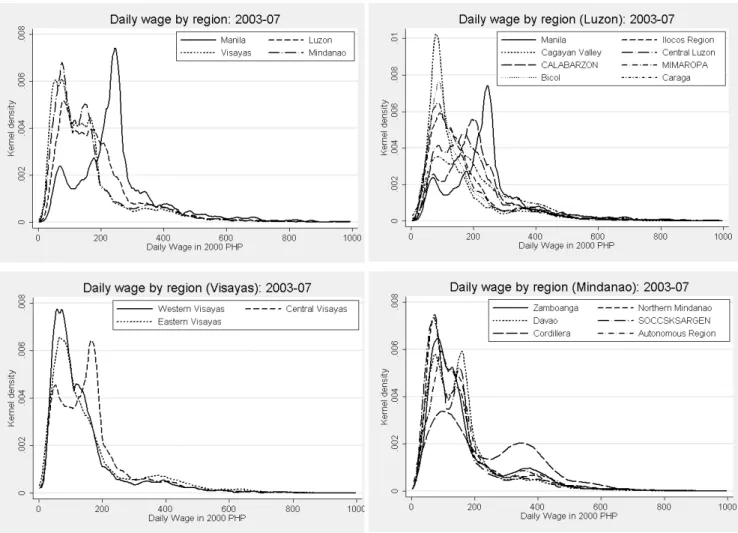
The level of daily wage varies widely across regions: wage level is the highest in NCR and the lowest in Visayas (Figure 1). In Luzon, Visayas, and Mindanao the level of daily wage of the employed clusters at two separate low levels; while in NCR it concentrates at a higher level. Within region, there is sharp difference in wage distribution. With daily wage one-third higher and unemployment rate almost doubling the national average, individuals in NCR face a tougher competition in getting a job but are likely to have better remuneration if employed.
classified into four island region groups – National Capital Region (NCR), Luzon, Visayas and Mindanao – based on their geographic location. See Map 1 for details.
4 See Manasan and Chatterjee (2003) and Balisacan and Fuwa (2004). 5 See Annex 2 for illustrations.
5
6
Table 6: Labor Market Performance Indicators by Regions
Mean %Δ Mean %Δ Mean %Δ Mean %Δ Mean %Δ Mean %Δ Mean %Δ
NCR (Manila) 70.7 -0.07 67.3 0.16 3.4 -0.22 59.2 -0.12 51.9 -0.23 12.3 0.2 262.4 -2.5
NCR 70.7 -0.07 *** 67.3 0.16 *** 3.4 -0.22 *** 59.2 -0.12 51.9 -0.23 12.3 0.2 262.4 -2.5
Luzon 66.3 0.53 61.7 0.62 4.6 -0.09 61.7 -2.24 57.5 -2.21 6.8 0.19 195.2 -2.7
I: Ilocos 67.7 1.07 *** 61.9 0.8 *** 5.8 0.27 *** 58.9 -2.25 *** 54.9 -2.42 *** 6.8 0.54 176.4 -3.9
II: Cagayan Valley 68.7 1.09 *** 63.8 1.26 *** 4.9 -0.17 ** 65.5 -1.72 ** 64.0 -2.12 ** 2.4 0.67 ** 151.9 -7.4 **
III: Central Luzon 67.7 0.21 *** 63.5 0.45 *** 4.2 -0.23 *** 59.0 -2.74 *** 53.9 -3.15 *** 8.7 1.07 ** 194.5 -4.4 **
IVA: CALABARZON 67.7 0.65 *** 63.6 0.64 *** 4.1 0.01 *** 61.2 -2.09 *** 55.7 -1.17 * 9.1 -1.21 *** 221.2 0.1
IVB: MIMAROPA 61.1 0.34 *** 57.0 0.49 *** 4.1 -0.14 ** 67.2 -1.69 64.9 -2.34 ** 3.4 1.07 ** 168.0 -0.3
V: Bicol 60.6 -0.74 *** 55.7 -0.32 ** 4.9 -0.41 * 64.6 -2.43 *** 61.8 -2.52 *** 4.4 0.31 167.7 -10.2 ***
CAR 66.4 2.56 *** 61.4 2.06 *** 5.0 0.49 *** 63.4 -0.6 60.9 -0.54 4.0 -0.07 226.0 -9.0 **
Visayas 65.2 0.95 59.7 0.96 5.5 -0.02 63.5 -2.38 59.8 -2.36 5.8 0.17 157.4 -2.7
VI: Western Visayas 66.5 1.23 *** 60.6 1.25 *** 5.9 -0.02 *** 62.8 -3.24 *** 59.3 -3.93 *** 5.6 1.37 *** 141.1 0.8
VII: Central Visayas 66.6 0.5 *** 61.4 0.48 *** 5.2 0.01 *** 62.3 1.08 * 58.0 1.32 ** 6.9 -0.48 * 170.7 -3.2
VIII: Eastern Visayas 61.1 0.96 *** 55.7 1 *** 5.4 -0.05 *** 66.5 -6.38 *** 63.5 -5.37 *** 4.5 -1.16 *** 166.8 -12.3 ***
Mindanao 63.9 -0.12 60.4 -0.08 3.6 -0.04 64.6 -1.67 61.7 -1.48 4.5 -0.18 164.6 -9.1
IX: Zamboanga Peninsula 63.0 0.57 *** 59.0 0.66 *** 4.0 -0.09 ** 63.2 -1.92 * 61.3 -1.47 3.1 -0.63 ** 172.2 -20.4 ***
X: Northern Mindanao 65.3 1.39 *** 61.0 1.18 *** 4.3 0.21 *** 71.0 -1.86 ** 67.7 -2.74 *** 4.7 1.36 *** 164.6 -7.2 ** XI: Davao 65.6 1.08 *** 62.0 1.46 *** 3.6 -0.37 65.1 -1.31 61.4 -0.56 5.6 -1.04 *** 159.7 -6.9 ** XII: SOCCSKARGEN 64.2 0.79 *** 61.0 0.8 *** 3.2 -0.01 *** 64.8 -2.79 *** 61.4 -2.11 * 5.2 -0.82 *** 149.9 -7.7 *** ARMM 61.2 -5.82 *** 59.5 -6.04 *** 1.8 0.22 *** 54.6 -0.35 52.7 -0.27 3.5 -0.12 232.7 -15.7 *** XIII: Caraga 63.1 0.56 *** 58.6 0.37 *** 4.5 0.18 *** 66.0 -1.16 63.3 -1.12 4.1 0.02 170.7 -4.0 Philippines 66.1 0.35 *** 61.7 0.42 *** 4.4 -0.07 *** 62.4 -1.82 *** 58.1 -1.76 *** 6.8 0.08 195.3 -3.5 *** Employment
Rate (to Working Age Population) Unemployment Rate (to Participation Daily Wage (2000 PHP) Working Age Population (15+) Working Age Population (15-64) Working Age Population (65+) Participation Rate Source: LFS, 2003-2007
Note: Changes of active population rate, participation rate, employment and unemployment are measured as percentage changes over the 2003 – 2007 period. A change in mean daily
wage is measured as the absolute change in PHP during the period.
Test statistics are shown for significance of change in each indicator during the 2003 – 2007 period. A positive sign of changes indicates that the level of the indicator is higher in 2007 than in 2003. *, **, and *** represent significance at 10 percent, 5 percent and 1 percent, respectively.
7
Figure 1: Inequality of Daily Wage Distribution by Region (2003-2007)
Source: LFS, 2003-2007
Note: Observations with daily wage over PHP1000 are dropped, which represents about 0.4 percent of the sample.
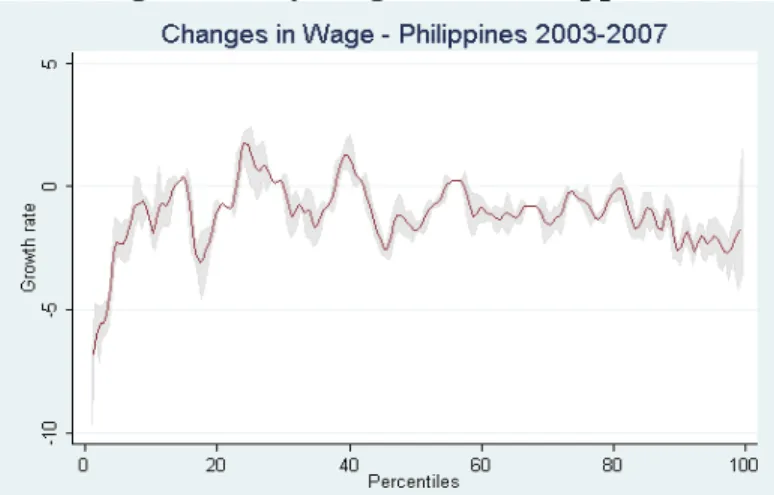
Most regions, except Calabarzon and Western Visayas, experienced a decline in daily wage. The decline is the most significant in Mindanao. Over time, the wage gaps between NCR and other regions widened. The distribution of wage income also changed over time. At the national level, the bottom end of the distribution witnessed the sharpest decline in wage (Figure 2); while at the regional level, the story was different: the poorest in NCR and Luzon saw their relative wage income increased compared with the richest while the poorest in Visayas and Mindanao saw their relative wage declined (Figure 3). 6 The worsening of wage distribution in the poorer regions, Visayas and Mindanao, led to even more daunting challenges for poor workers in these areas.7
6 This is consistent with the measures using Gini and p10/p90 ratio. In NCR and Luzon, opposite trends are observed
– the wage levels of the top end declined more substantially. These observations correspond to the fact that p10/p90 ratio improved in these regions. However, the changes in daily wage over the period are mixed at the bottom and middle percentiles. The overall Gini worsens.
8
Figure 2: Changes in Daily Wage in the Philippines (2003-2007)
Note: The shadow areas show the 95 percent confidence interval. Figure 3: Changes in Daily Wage by Region (2003-2007)
Note: The shadow areas show the 95 percent confidence interval.
3. Disparities in labor market opportunities across age and gender groups
In the Philippines, the youth (aged 15-25) has the highest unemployment rate and lowest wage (Table 7). This is consistent with the observations in many countries. As a large proportion of the youth are still in school, only 46 percent participate in labor force.8 However, for those who
8 In the Philippines, the population aged 15 years or above is considered as in working age based on the NSO
9
participate in the labor force, 15.2 percent are unemployed – the youth unemployment rate is more than twice that of the national average (6.8 percent) or three times that of 25-50 years old (4.6 percent) and almost six times of that of the 50-65 years old (2.6 percent). The mean level of daily wage for the youth (143 PHP) is 25 percent lower than the national average (195PHP). In 2003-2007, the youth unemployment rate increased by 0.6 percent and daily wage declined by 3.9 percent. This suggests that the youth, many of whom have limited working experience, face the most challenging situation in the labor market.
Table7: Labor Market Performance Indicators by Age Group
Mean %Δ Mean %Δ Mean %Δ Mean Δ
Age group (15<=age<25) 45.8 -3.48 *** 40.5 -3.1 *** 15.2 0.6 * 142.9 -3.9 ***
Age group (25<=age<50) 73.1 -1.35 *** 70.1 -1.3 *** 4.6 0.0 213.2 -9.9 ***
Age group (50<=age<65) 70.7 -0.62 ** 67.5 -0.9 *** 2.6 0.4 242.7 -17.5 ***
Age group (65<=age) 38.8 -1.17 ** 35.0 -1.0 * 1.0 0.1 165.4 5.7
Philippines 62.4 -1.82 58.2 -1.8 6.8 0.1 195.3 -8.3 Participation Rate Employment Rate (to Working Age Unemployment Rate (to Participation Daily Earnings (2000 PHP) Source: LFS, 2003-2007
Note: Test statistics are shown for significance of change in each indicator during the 2003 – 2007 period: *, **, and *** represent significance at 10 percent, 5 percent and 1 percent, respectively.
The wage rate is similar between males and females, but the participation and employment rates differ widely (Table 8). For those employed, the daily wage level is similar – the average daily wage of both males and females is 195PHP. As a result of the large difference in participation, the chances for female workers who choose to participate in the labor force to get a job are not much different from those for male workers – both with an unemployment rate of about 7 percent.
The distribution of daily wages is, however, more unequal for females and youth. While a similar share of females who participate in the labor force find a job as their male counterparts, they typically have a wider range of wages. In other words, although female and male workers have a similar level of average wages, female workers are more likely to be in both ends of the spectrum and have high-paid jobs or low-paid jobs than male workers. The P90/P10 ratio (4.8) and the Gini coefficient (0.35) of male workers’ daily wages are lower than those of female workers (8.3 and 0.42, respectively) (Table 9A). Wages increased with age/experience for white-collar jobs and declined for blue-collar jobs after a certain age. The P90/P10 ratio (5.4) and the Gini coefficient (0.34) of the age group 15-25 and 25-50 are lower than those of the age group 50-65 (Table 9B).
daily wage of those aged 15 to 65. Labor market conditions for the elderly group (over 65) are different from other age groups as a large share of the elderly chooses not to participate in labor force. For example, about two out of five of the elderly population (aged over 65 years old) participates in the labor market; only 1 percent of the elderly in labor force is unemployed.
10
Table 8: Labor Market Performance Indicators by Gender
Mean %Δ Mean %Δ Mean %Δ Mean %Δ
Male 65.5 0.56 *** 61.5 0.52 *** 3.9 0.02 *** 77.3 -2.43 ***
Female 66.7 0.13 *** 61.9 0.31 *** 4.8 -0.17 *** 47.5 -1.28 ***
Philippines 66.1 0.35 61.7 0.42 4.4 -0.07 62.4 -1.82
Mean %Δ Mean %Δ Mean Δ
Male 72.0 -2.5 *** 6.8 0.3 195.5 -7.6 ***
Female 44.3 -1.1 ** 6.7 -0.3 *** 194.8 -9.3 ***
Philippines 58.1 -1.8 6.8 0.1 195.3 -8.3
Participation Rate
Employment Unemploymen Daily Earnings
Working Age Population (15+) Working Age Population (15-64) Working Age Population (65+) Source: LFS, 2003-2007
Note: Test statistics are shown for significance of change in each indicator during the 2003 – 2007 period: *, **, and *** represent significance at 10 percent, 5 percent and 1 percent, respectively.
Table 9: Inequality in daily wage distribution by age and gender groups (2003-2007)
A. Inequality of Daily Wage distribution by Age Group
P90/P10 ratio Gini index
Age group (15<=age<25) 5.4 0.34 Age group (25<=age<50) 5.4 0.35 Age group (50<=age<65) 8.0 0.43 Age group (65<=age) 6.3 0.46
Philippines 6.3 0.38
B. Inequality of Daily Wage distribution by Gender
P90/P10 ratio Gini index
Male 4.8 0.35
Female 8.3 0.42
Philippines 6.3 0.38
Source: LFS, 2003-2007
4. The role of individual and regional characteristics in employment and wages
4.1 Description of the Model
This study employs the Heckman correction estimation instead of Ordinary Least Squares estimation in order to address the potential problem of selection bias as participation in the labor force is not random. Individuals who choose to work may be different from those who choose not to work – only those whose reservation wage does not exceed the wage offered by the
11
employers participate in the labor force. In the labor force survey, we can only observe the wage of the individuals who are employed.9
To examine the role of regional characteristics and individual characteristics in employment and wage determination, we introduce the two sets of variables in the model. Regional characteristics captures the overall labor market environment; while individual characteristics the qualification/capability of the person and his or her willingness to work. Some individual characteristics, such as age, education, and gender, affect not only the chance of getting employed (the reservation wages) but also the offered wages. On the other hand, some individual characteristics, such as marital status, being household head, and having children younger than 5 years old, may affect only the reservation wages but not the offered wages. Subject to data availability, we include the following variables to capture regional structural characteristics: 1. value-added per employee in the manufacturing sector as a proxy of labor productivity; 2. ratios of industrial and service sectors to regional GDP as proxies of production structure; 3. share of small and medium enterprises (SME) to the total establishments as a measure of role of SMEs.10 Using the pooled data from 2003-2007, we estimated the selection equation (employment determination) and income equation (wage determination) as below.
Selection equation (wage is observed if):
Income equation:
where i, j and t index individual, region and year,
respectively. Wage is the daily wage level, measured in 2000 constant terms in logarithmic form; age is age, as of the 1st of November in the surveyed year; school is the number of estimated
years of education based on the highest degree completed;sex is a dummy, which equals 1 if the
9 The LFS report daily wage only of the employee at the private household, private establishment, government or
government corporate and family-owned farm or business of their own household members. The self-employed, who often engage in the informal sector where the mean daily wage level is lower compared to that in the formal sector, may tend to show a particular pattern of personal characteristics. In addition, LFS does not report on remittances. Due to the data constraint, unfortunately, we are unable to capture the effect of self-employment and remittances on income and employment.
10 The value-added per employee in the manufacturing sector is obtained from the 2003 Annual Survey of
Philippines Business and Industry by the National Statistics Office. It is expressed in a logarithmic form in the model. The ratios of industrial and service sectors to regional GDP are calculated from the statistics of the Philippines National Statistical Coordination Board. The ratio of SMEs to total establishment is obtained from the Small and Medium Enterprises Statistical Report by the Department of Trade and Industry (2005).
12
individual is female; household_head is a dummy, which equals 1 if the individual is a household
head; married is a dummy, which equals 1 if the individual is married; child_under_5_years_old
is a dummy, which equals 1 if the individual has at least one child under five years old;
female×married is an interaction term of the dummies of female and married (=1 if the
individual is female and married); female×children_count is an interaction term of a gender
dummy and the number of children in the household; val is thevalued added per employee in the
manufacturing sector in logarithmic form; %industry_GDP is the share of the industrial sector to
regional GDP; %service_GDP is the share of the services sector to regional GDP; and %SME is
the share of small and medium size enterprises to the total establishments in the region.The island group dummies and time dummies are introduced to capture region-specific and time-specific effects (NCR and year 2003 as reference); and . To capture the non-linear effect of age on employment and daily wage, we include “age square” in the equation.
4.2 Empirical results
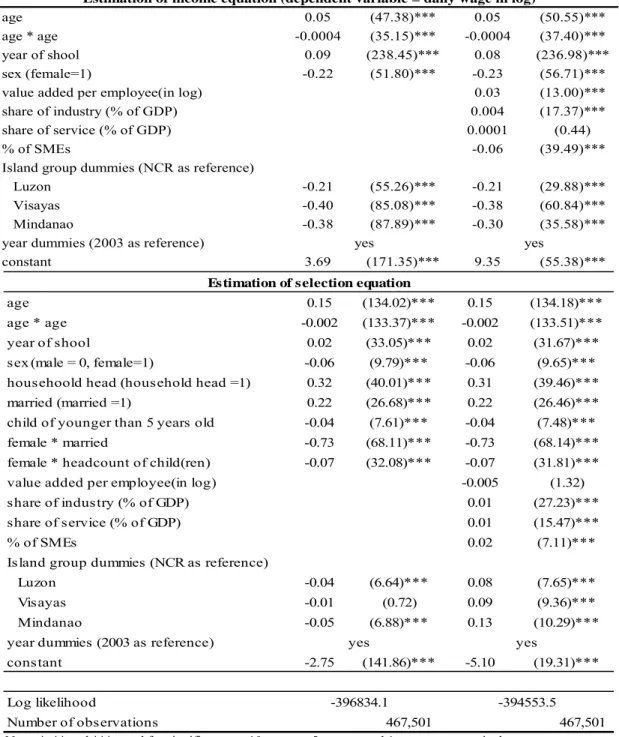
The estimated results are shown in Table 10. Regression 1 shows the role of individual characteristics on employment and wage. The coefficients of the independent variables all carry the expected signs. Age plays a positive role in employment and wage determination in a significant way. Its positive effects decline as age increases. In general, individuals with better education have a higher chance to get employed with a higher wage. 11 Like in many other countries, a Filipino female worker has a lower chance of getting employed and is offered lower daily wage compared with a male worker, all other things being equal.12 This finding is consistent with the statistics we have in the previous section that female workers tend to have better education compared with male workers with the same level of salary. Partly because of their stronger incentive to seek employment, those who are household head or married, controlling for other characteristics, are more likely to be employed. Marital and family status is more likely to influence women’s participation in labor market. Married women, women from households with a larger number of children or have child(ren) under five years old are less likely to be employed, mainly because they tend to choose staying home.
Regression 2 includes regional structural indicators. The results are similar to those of regression 1 except for the effects of region dummies on employment. Individuals in regions with a higher share of industrial and services sectors (hence, lower share of agricultural sector) face better employment opportunities. Regions with a higher share of industrial output tend to have higher prevalent wage as the industrial sector is in general more productive compared with the agricultural sector (the reference sector); while the same is not true for regions with a higher share of services output, probably due to the mixed wage structure of in the services workers – individuals with high skills (for example, financial specialists) may earn a high level of salary while those with low skills (like cleaning staff) may earn a low level of salary. Value added per employee in the manufacturing sector is positively associated with the daily wage level, while it
11
The effects of years of schooling are not quadratic when the square term was introduced into the estimations. To capture the impacts of different levels of education and test the robustness of the estimation, we will estimate a second set of Heckman regressions with three dummy variables (with “less than elementary school education” as reference) – “with elementary school certificate”, “with high school certificate”, and “with university certificate” instead of “years of schooling”. The results, available upon request, are broadly consistent with those using years of schooling as measures of education.
13
does not affect employment. This is consistent with the fact that workers in regions with higher labor productivity tend to have higher level of wage, others being equal. The prevalence of SMEs has a significant positive impact on employment but a negative impact on wage. This is consistent with the fact that many SMEs are labor intensive with less stringent skill requirement, and hence lower paid.
The significance of regional dummy and year dummy variables suggests the unobserved region-specific characteristics and difference over time both play a role in employment and wage determination. 13
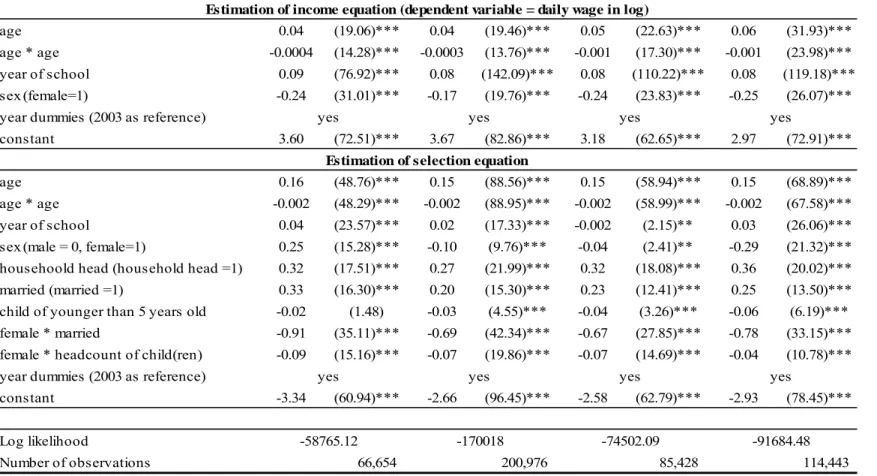
To relax the assumptions that the role of individual characteristics in the labor market is similar across regions, we estimate Heckman selection and income equations for each region separately. The results are shown in Table 11. In each region, individual characteristics – age, education, gender, marital status, household head, child(ren) under 5 years old, interaction terms of female and marital status and of female and children headcount – play significant roles in determining one’s employment status and the first three also in wage level. In each region, wage is positively associated with age, while the positive effect is declining with the increase in age. Returns to education on employment and on wage level are the highest in the NCR. Interestingly, while the wage level is lower for females than for males in all regions, a female has a higher chance of getting employed than a male in NCR, others being equal. This is probably related to the unique characteristics of female labor supply in NCR and the high share of services sector there. Wage gap between male and female workers is the smallest in Luzon.
13 If the regional characteristics, such as value added per worker, share of industry, share of services, and share of
SMEs, are not controlled for, their impacts will be captured in the regional dummies. In the selection equation, regional dummies have different signs in regression 1 and regressions 2.
14
Table 10: Determination of Employment and Daily Wage at the National Level (2003-2007)
age 0.05 (47.38)*** 0.05 (50.55)***
age * age -0.0004 (35.15)*** -0.0004 (37.40)***
year of shool 0.09 (238.45)*** 0.08 (236.98)***
sex (female=1) -0.22 (51.80)*** -0.23 (56.71)***
value added per employee(in log) 0.03 (13.00)***
share of industry (% of GDP) 0.004 (17.37)*** share of service (% of GDP) 0.0001 (0.44) % of SMEs -0.06 (39.49)*** Luzon -0.21 (55.26)*** -0.21 (29.88)*** Visayas -0.40 (85.08)*** -0.38 (60.84)*** Mindanao -0.38 (87.89)*** -0.30 (35.58)***
year dummies (2003 as reference)
constant 3.69 (171.35)*** 9.35 (55.38)***
Regression 1 Regression 2
Estimation of income equation (dependent variable = daily wage in log)
Island group dummies (NCR as reference)
yes yes
age 0.15 (134.02)*** 0.15 (134.18)***
age * age -0.002 (133.37)*** -0.002 (133.51)***
year of shool 0.02 (33.05)*** 0.02 (31.67)***
sex (male = 0, female=1) -0.06 (9.79)*** -0.06 (9.65)*** househoold head (household head =1) 0.32 (40.01)*** 0.31 (39.46)***
married (married =1) 0.22 (26.68)*** 0.22 (26.46)***
child of younger than 5 years old -0.04 (7.61)*** -0.04 (7.48)***
female * married -0.73 (68.11)*** -0.73 (68.14)***
female * headcount of child(ren) -0.07 (32.08)*** -0.07 (31.81)***
value added per employee(in log) -0.005 (1.32)
share of industry (% of GDP) 0.01 (27.23)*** share of service (% of GDP) 0.01 (15.47)*** % of SMEs 0.02 (7.11)*** Luzon -0.04 (6.64)*** 0.08 (7.65)*** Visayas -0.01 (0.72) 0.09 (9.36)*** Mindanao -0.05 (6.88)*** 0.13 (10.29)***
year dummies (2003 as reference)
constant -2.75 (141.86)*** -5.10 (19.31)***
Log likelihood
Number of observations
Estimation of selection equation
Island group dummies (NCR as reference)
-396834.1 -394553.5
467,501
467,501
yes yes
15
Table 11: Determination of Employment and Daily Wage at the Regional Level in the Philippines (2003-2007) – Using Years of School as an Indicator of Human Capital
age 0.04 (19.06)*** 0.04 (19.46)*** 0.05 (22.63)*** 0.06 (31.93)***
age * age -0.0004 (14.28)*** -0.0003 (13.76)*** -0.001 (17.30)*** -0.001 (23.98)***
year of school 0.09 (76.92)*** 0.08 (142.09)*** 0.08 (110.22)*** 0.08 (119.18)***
sex (female=1) -0.24 (31.01)*** -0.17 (19.76)*** -0.24 (23.83)*** -0.25 (26.07)***
year dummies (2003 as reference)
constant 3.60 (72.51)*** 3.67 (82.86)*** 3.18 (62.65)*** 2.97 (72.91)***
age 0.16 (48.76)*** 0.15 (88.56)*** 0.15 (58.94)*** 0.15 (68.89)***
age * age -0.002 (48.29)*** -0.002 (88.95)*** -0.002 (58.99)*** -0.002 (67.58)***
year of school 0.04 (23.57)*** 0.02 (17.33)*** -0.002 (2.15)** 0.03 (26.06)***
sex (male = 0, female=1) 0.25 (15.28)*** -0.10 (9.76)*** -0.04 (2.41)** -0.29 (21.32)***
househoold head (household head =1) 0.32 (17.51)*** 0.27 (21.99)*** 0.32 (18.08)*** 0.36 (20.02)***
married (married =1) 0.33 (16.30)*** 0.20 (15.30)*** 0.23 (12.41)*** 0.25 (13.50)***
child of younger than 5 years old -0.02 (1.48) -0.03 (4.55)*** -0.04 (3.26)*** -0.06 (6.19)***
female * married -0.91 (35.11)*** -0.69 (42.34)*** -0.67 (27.85)*** -0.78 (33.15)***
female * headcount of child(ren) -0.09 (15.16)*** -0.07 (19.86)*** -0.07 (14.69)*** -0.04 (10.78)***
year dummies (2003 as reference)
constant -3.34 (60.94)*** -2.66 (96.45)*** -2.58 (62.79)*** -2.93 (78.45)***
Log likelihood
Number of observations 66,654 200,976 85,428 114,443 Estimation of selection equation
yes yes yes yes
-58765.12 -170018 -74502.09 -91684.48
yes yes yes yes
NCR Luzon Visayas Mindanao
Estimation of income equation (dependent variable = daily wage in log)
16
The empirical results show that wages and employment opportunities considerably differ across regions. We use Blinder-Oaxaca decomposition method (Blinder, 1973 and Oaxaca, 1973) to identify the relative role of individual and regional characteristics in wage determination in different regions. Wage differential is decomposed into two parts, one part that can be explained by differences in individual characteristics, such as age, education and gender, and one residual part that may capture the effects regional structural characteristics and unobservable characteristics. 14 Table 12 presents the results of the Oaxaca decomposition study, taking NCR as reference. The results offer support to the significant difference in wage structure between NCR and the other regions. Individual characteristics account for roughly one-third of the difference between NCR and other regions while other characteristics account for about two-thirds.
Table 12: Decomposition of the Effects of Individual and Other Characteristics on Regional Wage Differentials – Using Years of School as An Indicator of Human Capital
Mean Daily Wage (pesos)
Effects of Individual Characteristics (Age, Education, and Gender) on
Mean Wage Differential between the Region in Question and the NCR
Effects of Other Characteristics on Mean Wage Differential between
the Region in Question and the NCR NCR 262 -- --Luzon 195 35.7% 64.3% Visayas 157 32.0% 68.0% Mindanao 165 28.4% 71.6% 5. Conclusions
The findings suggest large disparities in labor market performance across regions and individual groups in the Philippines. Development gaps widened between the Manila Metropolitan Area and other islands. Compared with other regions, NCR is characterized by high active population rate, low participation rate, low employment rate, high unemployment rate, and high daily wage. The youth, less educated, and women face more challenges in getting employed and earning a good salary, others things being equal.
Disparities in labor market performance are largely associated with the difference in regional structure and human capital endowment. Individual characteristics account for roughly one-third of the difference in wage between NCR and other regions; while regional structures and other unobservable factors account for two-thirds. Regional structural characteristics, such as industrial composition, labor productivity and prevalence of SMEs, are significantly associated with employment opportunities and wage levels. As expected, workers in regions with higher productivity and higher share of industry production are more likely to have higher wage, others being equal. The share of SMEs is positively associated with employment opportunities but negatively with wage, which is probably related to the nature of jobs created in SMEs. For similar reasons, a higher share of services to regional GDP is positively associated with higher employment opportunities, but not with wage. Individual characteristics, such as age, education
14 Further examination of roles of regional characteristics and that of unobservable characteristics is of interest for
17
level, gender, and family status, play an important role in employment and wage. As expected, the well-educated have better chances of getting jobs and earning higher salaries. Interestingly, although the average wage difference between male and female is small, female workers in general have higher education than their male counterparts.
As labor market opportunities and returns to education and other individual talents significantly differ across regions, implementation of appropriate regional labor market policies is important. Human capital, however, remains a key determinant in employment and wage determination. Concerted efforts to improve education will also be important. The design and implementation of relevant policies are of interest for future work.
References
Balisacan, A.M. and N. Fuwa. (2004, May). “Changes in Spatial Income Inequality in the Philippines.” Research Paper No.2004/34, World Institute for Development Economics Research. (United Nations University, Helsinki).
Balisacan, A.M. (2003), “Poverty and Inequality”, in: The Philippine Economy: Development, Policies and Challenges, New York Oxford University Press; Quezon City, Ateneo de Manila University Press , 2003
Blinder, A.S. (1973). “Wage Discrimination: Reduced Form and Structural Estimates. Journal of Human Resources, 8: 436-455.
Manasan R.G. and S. Chatterjee (2003), in: The Philippine Economy: Development, Policies and Challenges, New York Oxford University Press; Quezon City, Ateneo de Manila University Press , 2003
Oaxaca, R. (1973). Male-Female Wage Differentials in Urban Labor Markets. International Economic Review 14: 693–709.
Schady, N.R. (2000, September). “What Education Pays? Non-Linear Returns to Schooling among Filipino Men” World Bank (mimeo).
Yamaguchi, F. (2005). “Why Do Schooling Returns Differ? Screening, Private School, and Labor Markets in the Philippines and Thailand.” Economic Development and Cultural Change, 53:
18
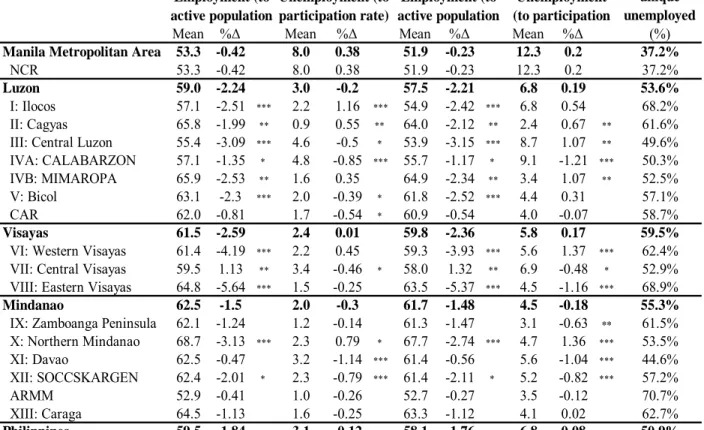
Annex 1: Comparison of employment and unemployment indicators using ILO and NSO definitions
There is difference in employment rate and in unemployment rate according to the International Labor Organization (ILO) definitions and the Philippines National Statistics Office (NSO) definitions. This annex provides statistics using both definitions for nuance.
Employment rate is defined as the proportion of the working-age population that work or have a job to return during the reference period. The difference in employment (to working age population) rates between ILO and NSO lies in the difference between their definitions of working age population. ILO defines 15 to 65 years old as working age while NSO defines 15 years and above. In this study, the NSO employment rates for the Philippines as well as for each of the 17 regions are slightly lower than the ILO employment rates.
Larger difference lies in ILO and NSO unemployment to participation rates, which results not only from the difference in working age definitions but also to a larger extent from the difference in unemployment definitions. ILO defines unemployment as the working age individual who does not work, is available for work and is actively looking for work. NSO employs a broader definition of unemployment as the proportion of labor force that does not work, is available for work and (1) is actively looking for work, or (2) is not looking for work because of following reasons: (i) belief that there is no job available (discouraged worker); (ii) awaiting results of previous job application (labor in transition); (iii) temporary illness (temporarily disabled); (iv) bad weather; and (v) waiting for job recall (laid-off).
The national unemployment rate by the NSO definition is twice that by the ILO definition (Table A1). This suggests that the NSO unique unemployment, including the discouraged, temporarily disabled, laid-off, in transit, and not looking for work because of bad weather, accounts for 50 percent of total NSO unemployment. A higher ratio of the unemployed falls into the NSO unique unemployment in some regions than others. For example, NSO unique unemployment accounts for 70 percent of NSO unemployment in ARMM, while only 37 percent in NCR. The trends of changes in ILO unemployment and the NSO unemployment also differ across regions. For instance, while the ILO unemployment rate in Western Visayas and in Eastern Visayas did not change significantly over the period, the NSO unemployment increased in Western Visayas and decreased in Eastern Visayas.15
15 The changes of NSO unemployment rate in Western Visayas and Eastern Visayas are both significant in statistical
19
Composition of NSO unique unemployment – proportions of working age population who is available but do not actively look for work because of the five reasons listed above – is shown in Table A2. In the Philippines, 42 percent of the individuals in working age who are not employed but do not look for a job are discouraged worker – they do not search for jobs because of their beliefs that there is no work available for them; 24 percent are in job transition; 10 percent are the temporarily disabled; 22 percent are the temporarily laid-off; and 2 percent do not look for jobs because of bad weather. These proportions vary across regions. For example, less than 30 percent of those who were available but did not look for jobs in NCR were discouraged; while the ratio is 47 percent in Mindanao. This may imply nuances in different policy challenges to improve labor market performance at the regional level.
Table A1: Comparison of the ILO and NSO Employment and Unemployment NSO's unique unemployed
Mean %Δ Mean %Δ Mean %Δ Mean %Δ (%)
Manila Metropolitan Area 53.3 -0.42 8.0 0.38 51.9 -0.23 12.3 0.2 37.2%
NCR 53.3 -0.42 8.0 0.38 51.9 -0.23 12.3 0.2 37.2%
Luzon 59.0 -2.24 3.0 -0.2 57.5 -2.21 6.8 0.19 53.6%
I: Ilocos 57.1 -2.51 *** 2.2 1.16 *** 54.9 -2.42 *** 6.8 0.54 68.2%
II: Cagyas 65.8 -1.99 ** 0.9 0.55 ** 64.0 -2.12 ** 2.4 0.67 ** 61.6%
III: Central Luzon 55.4 -3.09 *** 4.6 -0.5 * 53.9 -3.15 *** 8.7 1.07 ** 49.6%
IVA: CALABARZON 57.1 -1.35 * 4.8 -0.85 *** 55.7 -1.17 * 9.1 -1.21 *** 50.3%
IVB: MIMAROPA 65.9 -2.53 ** 1.6 0.35 64.9 -2.34 ** 3.4 1.07 ** 52.5%
V: Bicol 63.1 -2.3 *** 2.0 -0.39 * 61.8 -2.52 *** 4.4 0.31 57.1%
CAR 62.0 -0.81 1.7 -0.54 * 60.9 -0.54 4.0 -0.07 58.7%
Visayas 61.5 -2.59 2.4 0.01 59.8 -2.36 5.8 0.17 59.5%
VI: Western Visayas 61.4 -4.19 *** 2.2 0.45 59.3 -3.93 *** 5.6 1.37 *** 62.4%
VII: Central Visayas 59.5 1.13 ** 3.4 -0.46 * 58.0 1.32 ** 6.9 -0.48 * 52.9%
VIII: Eastern Visayas 64.8 -5.64 *** 1.5 -0.25 63.5 -5.37 *** 4.5 -1.16 *** 68.9%
Mindanao 62.5 -1.5 2.0 -0.3 61.7 -1.48 4.5 -0.18 55.3%
IX: Zamboanga Peninsula 62.1 -1.24 1.2 -0.14 61.3 -1.47 3.1 -0.63 ** 61.5%
X: Northern Mindanao 68.7 -3.13 *** 2.3 0.79 * 67.7 -2.74 *** 4.7 1.36 *** 53.5% XI: Davao 62.5 -0.47 3.2 -1.14 *** 61.4 -0.56 5.6 -1.04 *** 44.6% XII: SOCCSKARGEN 62.4 -2.01 * 2.3 -0.79 *** 61.4 -2.11 * 5.2 -0.82 *** 57.2% ARMM 52.9 -0.41 1.0 -0.26 52.7 -0.27 3.5 -0.12 70.7% XIII: Caraga 64.5 -1.13 1.6 -0.25 63.3 -1.12 4.1 0.02 62.7% Philippines 59.5 -1.84 3.1 -0.12 58.1 -1.76 6.8 0.08 50.9% ILO Employment (to active population ILO Unemployment (to participation rate) NSO Employment (to active population NSO Unemployment (to participation
20
Table A2: Composition of NSO unemployment Discouraged Labor in Transition Temporarily disabled Bad Weather Temporarily laid-off (%) (%) (%) (%) (%) NCR 29.2 33.0 8.8 0.4 28.6 NCR 29.2 33.0 8.8 0.4 28.6 Luzon 42.3 25.6 8.5 1.2 22.5 I: Ilocos 55.8 21.4 5.6 1.2 16.0 II: Cagyas 58.8 18.4 11.4 0.7 10.9
III: Central Luzon 42.8 21.0 7.7 0.8 27.8
IVA: CALABARZON 31.5 34.5 7.9 0.9 25.3
IVB: MIMAROPA 40.1 17.9 16.8 3.3 21.9
V: Bicol 55.2 15.6 11.9 3.0 14.4
CAR 39.0 33.2 13.1 1.8 12.9
Visayas 50.3 15.0 12.0 3.5 19.3
VI: Western Visayas 56.1 12.4 13.0 1.3 17.3
VII: Central Visayas 38.8 19.6 11.4 6.1 24.1
VIII: Eastern Visayas 59.8 11.7 11.0 2.9 14.6
Mindanao 46.7 20.8 14.1 1.9 16.5
IX: Zamboanga Peninsula 44.7 26.6 10.0 2.0 16.7
X: Northern Mindanao 33.8 22.8 17.2 1.4 24.9 XI: Davao 42.0 23.9 14.2 1.0 18.9 XII: SOCCSKARGEN 50.3 19.7 13.1 2.9 14.0 ARMM 69.7 15.0 9.5 1.2 4.5 XIII: Caraga 51.7 14.1 18.4 3.2 12.7 Philippines 42.4 23.9 10.2 1.6 21.9
21
22 gure 1
wb249569
C:\Users\wb249569\Documents\Xubei\Philippines\Working paper submission\final\PH Disparities in Labor Market Performance_0826.doc 8/31/2009 3:55:00 PM