Electronic copy available at: http://ssrn.com/abstract=2327001
Evidence from Indian Districts
Geeta Gandhi Kingdon
*Institute of Education, University of London and CSAE (Oxford)
g.kingdon@ioe.ac.uk
and
Sarmistha Pal
University of Surrey, Guildford and IZA (Germany)
s.pal@surrey.ac.uk
June 2013
Abstract: The Millennium Development Goals implicitly assume that the state has the prime responsibility of delivering basic education, ignoring the rapid private school growth around the world. In this context, the present paper exploits the variation in private school growth in Indian districts over time to identify the causal effect of private school growth on youth literacy and enrolment rates. The average treatment effects generally mirror the district fixed effects estimates: the effect of private school growth on literacy and enrolment rates among 10-19 year olds remains positive and significant while the corresponding effect is much weaker for gender gap in literacy and enrolment rates in our sample.
Key words: Private school growth, Delivery of basic education, Literacy and enrolment rates; Gender gap in literacy and enrolment, Fixed-effects estimates Matching estimates, Average treatment effect, Indian districts. JEL code: I21, I28, O15
*
Corresponding author. Address for correspondence: Institute of Education, University of London, 36-38 Gordon Square, London WC1H 0PD, UK.E-mail: g.kingdon@ioe.ac.uk. We would also like to thank Petia Topalova for poverty data and Mohammed Arif, Ana Maria Lugo, Yama Temouri for excellent research assistance, Paul Atherton, Debopam Bhattacharya, Erlend Berg, Sonia Bhalotra, Jean Drèze, William Evans, Irma Clots-Figures, Paul Glewwe, Pramila Krishnan, Pushkar Maitra, Karthik Muralidharan, and also participants at the UKFIET Conference on Education and Development at Oxford, Economic Growth and Development Conference at the Indian Statistical Institute New Delhi, and Social Policy in India workshop at Warwick University for many constructive comments/suggestions. Any remaining errors are ours.
Sarmistha Pal wishes to thank Leverhulme Trust for funding this research, NCERT for access to AISES data and CSAE, Oxford University for their hospitality where this research was initiated.
Electronic copy available at: http://ssrn.com/abstract=2327001
Can the Private Sector Deliver ‘Education for All’?
Evidence from Indian Districts
1. INTRODUCTION
Universal education is a key element of the Millennium Development Goals (MDG) 2000-15, which implicitly assumes that the state has the primary responsibility to ensure that this MDG is attained. Clearly this assumption is at odds with the growing importance of the private sector in the provision of basic schooling around the world, thus initiating a policy debate as to whether private schools can foster 'education for all' (e.g., Tooley and Dixon, 2003), especially beyond 2015. In this context the present paper examines the effects of private school growth on youth literacy and enrolment rates in Indian districts during 1992-2002, which remains little understood.
In general, there is a consensus emerging from individual/household-level studies from around the world that students from private unaided schools generally perform better than those from fully funded government schools (e.g., see Jimenez et al 1988; 1991; 1995; Kingdon 1996; Desai et al. 2008). It has often been argued that a greater market orientation makes private schools and teachers more accountable to parents, more sensitive to input costs and thereby more efficient than state schools. India is an important case in point. While the state sector still dominates the schooling market in India, an important feature of the 1990s has been a significant growth of private schools in India (e.g., see the Public Report on Basic Education; in short, PROBE
1999).1 While about 16% of the villages surveyed in PROBE data had access to private schools, the
corresponding figure rose to about 28% in 2003 (Muralidharan and Kremer 2008). Despite the absence of school fees, dismal state of the state schools has induced many households, even some poorer households, to take advantage of the newly emerging private unaided schools in India to meet their educational needs. To a large extent, the latter has been facilitated by the modest private school fees in India. Although there is no systematic data available for private school fees across India, Tooley and Dixon (2003) found that the average school fees were only about £2 a month in Hyderabad while the median fee across rural India was estimated to be Rs. 63 per month in the 2003 survey by Muralidharan and Kremer (2008). PROBE survey found that poorer households were not totally excluded from access to private schools in the PROBE states (Dreze and Kingdon, 2001). Tooley and Dixon (2003) study further noted that fathers were largely daily-paid labourers and 30% of mothers were illiterate, but families were active in the school choice process in Hyderabad. While there is
limited evidence of the link between school choice and performance for certain regions and certain periods generally at individual/household level (Bashir 1994; Kingdon 1996; Muralidharan and Kremer 2006), the relationship is little understood at an all-India level over a period of time. The present study aims to bridge this gap in the literature, which in turn may have important implications for school financing in an era of stagnating public budget.
Our analysis particularly focuses on upper-primary and secondary levels of schooling. This is because India has made substantial progress in primary enrolment: Pratham (2011) suggests that 96.6% of India’s primary age children were enrolled in schools in 2011. However, the country fails seriously in terms of literacy at upper-primary and secondary level, especially when it is compared with other BRIC countries like Brazil, Russia and China. For example, Kingdon (2007) suggests that Brazilian and Russian secondary school enrolment rates are 27 percentage points higher than that of India’s. Further, India is more than 30 years behind China in terms of proportion of population with completed secondary and post secondary schooling. As such, in addition to youth literacy among 10-19 year olds, we also consider the enrolment rates at upper-primary and secondary levels of schooling. Upper primary school enrolment can be regarded as a lower bound for primary school completion rate (leaving aside the dropouts after the primary school completion which we do not observe); similarly, secondary school enrolment rates can act as a proxy for upper-primary school completion rates. While there may be a need and/or family pressure for children to leave schools early to supplement family earnings, low educational achievements will obviously be associated with low future earning prospects and thus low lifetime earnings. It would also mean that children with low human capital would fail to take advantage of tremendous growth spurt happening in certain sectors of the Indian economy since the early 1990s and would be stuck in a low-income situation over generations (Kingdon, 19982; Maitra and Sharma, 2009), thus widening inequality.
Studies that analyse different aspects of private school growth in India (e.g., Kingdon 1996; Muralidharan and Kremer, 2006; Pal 2010; Chudgar and Quin, 2012) have primarily used single cross-section data. Consequently, these existing estimates are likely to suffer from endogeneity bias primarily arising from the unobserved heterogeneity among market participants (schools/parents/children). For example, in an achievement production function, a private school dummy variable is endogenous since it is likely to pick up the effect of child- or family-level unobserved factors (e.g. motivation, ambition etc.) that make it more likely that a child will attend private school and also raise achievement levels. Similarly, to extend to district level data, if we were to regress district literacy rate in a given year on the district’s ‘private school share’ in that year, the latter variable would suffer from omitted variable bias in such an OLS regression. There could also be reverse
2 Kingdon (1998) shows that the education-wage relationship in India is convex in nature: the returns to secondary schooling are much
causality: just as private school presence affects achievement/literacy, the latter may also influence private school presence. Hence we need to address these potential biases in our estimation.
We use a unique two-period district-level data for 1992 and 2002 from 17 major Indian states that we compiled from various official sources.3 Our analysis primarily focuses on literacy information available from the
Indian Census where a person is defined as literate when s/he is able to read and write in any language. In alternative specifications, we also test the robustness of our results by considering enrolment rates at upper-primary and secondary levels. The extent of private schooling in a district is measured by the share of recognised private unaided schools4 in total schools at a given level, namely, upper primary 10-14 years, secondary 15-19
years; we also pool these two levels to consider children aged 10-19 years.5
We start with the conventional pooled OLS model of literacy and gender gap in literacy with control for various factors including private schools share at a given level and binary indicator for the year 2002. Clearly, however, a pooled OLS model would suffer from the omitted variable bias influencing the variable of interest. One alternative is to consider a first difference model of changes in literacy (and gender gap in literacy) in terms of initial values of private school share and other possible control variables; while this minimises the potential simultaneity bias from literacy to private school share, it still suffers from omitted variable bias. Hence our analysis focuses on the fixed effects OLS panel data estimates using two years panel information on sample districts. While fixed-effects estimation method redresses the potential estimation bias arising from time-invariant omitted factors, concerns may still arise because of the time-varying omitted factors, e.g., income and returns to schooling, which may not only influence literacy and gender gap in literacy, but also private school shares in a district. Recent studies (e.g., Angrist et al., 2002) highlight the benefit of randomized experiments that may provide a good solution to the problem of simultaneity bias in some cases. However, randomization is unlikely to work in our case, as presence of private schools in a given location is a strategic choice of private investors (e.g., see Pal, 2010). Further despite collecting a rich array of information at the district-level, use of instrumental variable (IV) is unlikely to be convincing as the factors that influence private school growth are also likely to influence literacy or gender gap in literacy. Accordingly, we exploit the variation in a district’s access to private schools between 1992 an 2002 (since not all districts in our sample had access to private schools in these years) to identify a causal effect of private school growth on literacy. Since a district’s access to private schools is arguably non-random, we use Propensity Score Methods (PSM) to adjust for the observed differences
3 Although Census 2011 has now been completed, 8th All India School Education Survey is still being conducted by the NCERT. It
will take a good few years before the latest rounds of CENSUS and AISES data would be made publicly available. Hence, we are unable to update the data beyond 2002.
4See section 2 for a discussion of types of private schools in India.
across treatment (districts with private schools) and control (districts without private schools) groups over 1992-2002. Thus after controlling for variation in income, returns to schooling and characteristics of state schools in sample districts (all of which determine the demand/supply of private unaided schools), access to private unaided schools can be considered random in our sample. We also include various state-region dummies, year dummies and also state-region*year dummies to ensure that there are no trends in possible unobserved factors. This allows us to compare the treatment and control groups with similar observable characteristics over this period and thus to derive the average treatment effect of private school growth, using difference-in-difference (DID) matched estimator (see further discussion in section 4.4). Subsequently, we compare these average treatments effects with the corresponding fixed effects estimates obtained earlier.6 There
exists substantial variation in the growth of private schools across the sample districts at upper-primary and secondary levels, which, we argue, would affect the literacy and enrolment of children who were young enough (10-19 years old) to be in upper-primary and secondary schools during 1992-2002. It is also not unreasonable to expect that the private school effect would be larger for districts who received more private schools. Further, we show that educational attainment (literacy/enrolment) among the older cohorts (35-74 year olds), who did not directly benefit from the private school growth because they were too old to attend upper-primary or secondary schools between 1991-2001 when the private school growth was initiated, is not correlated with the access to private schools over 1991-2001. We also strengthen our controls considerably to account for unobserved trends in general and thus focus on identifying a causal effect of private school growth on literacy/enrolment in our sample.
The paper contributes to a large and growing literature on child schooling in developing countries (e.g., see Glewwe, 2002; Hanushek and Woessman 2008) and also a sizeable literature (e.g., see Bashir, 1994; Kingdon, 1996; Beegle and Newhouse, 2006; Chudgar and Quin, 2012)7 on relative efficiency of private schools
in imparting education. In this respect, three recent studies on India are worth citing. First, considering a nationally representative rural household-level sample from the major Indian states, Muralidharan and Kremer (2008) suggested that the single most distinguishing feature of the private schools in rural India is that they pay much lower salaries to teachers than the government schools. This allows the private schools to hire more
6 Note that the determination of the propensity score is facilitated by the existing literature that identifies state school characteristics and local
demand as possible determinants of local private schools in India (e.g., see Muralidharan and Kremer, 2008; Pal 2010). We are however unable to use any regression discontinuity approach which requires us to identify a discontinuity at some cut-off value of the assignment variable determining the treatment.
7 There is however no general consensus that private schools are necessarily better than state schools. Bashir (1994) indicated that students in private schools had better Mathematics achievement, but less achievement in Tamil language, compared to government school students in Tamil Nadu. Kingdon (1996) found that, ceteris paribus, students in private schools performed significantly better than those in government schools in urban Lucknow district. In the context of Indonesia, Beegle and Newhouse (2006) contrast Bedi and Garg (2000) in that junior secondary level (grades 7-9) students in public schools in Indonesia outperform those in private schools, which they attribute to unobserved higher uality of inputs in public schools.
teachers, thus ensuring a lower pupil-teacher ratio than state schools. Using PROBE household and school-level survey data from five north Indian states8, Pal (2010) found that private schools are more likely to be present in
villages with existing state schools as well as those with better off households and better access to public infrastructural facilities (e.g., transport, communications). Using district level panel data for 1992-2002, the present paper goes beyond this existing literature to link private school growth with universal literacy (and school enrolment and progression) beyond primary levels that remains little understood. Difference-in-difference matched estimator comparing districts with/without private schools over the decade suggest a significant and positive effect of private school growth on both 10-14 and 15-19 literacy rates; while the average treatment effect is negative (and small) for gender gap in literacy for both age groups, it is only significant for 10-14 year olds. While similar private school effects are found for enrolment for 10-14 and 15-19 year olds, there is no evidence that private schools significantly reduce gender gap in enrolment.
Despite huge annual state budgets allocated to schools, it is now acknowledged that state-funded schools are failing around the country. A growing number of recent studies (Chaudhary et al. 2005; Duflo and Hannah, 2005; Banerjee et al. 2007; Aslam and Kingdon, 2011) highlight the need to improving the quality of teaching and/or reducing teacher’s absenteeism in a bid to improve student participation as well as performance. The Indian government has however continued to focus their attention on the introduction of para-teachers9 (who
are contract teaching assistants, but often lack the essential training), mid-day meals for primary schools and Sarva Siksha Abhiyan, as the key input-based mechanisms to secure ‘education for all’; there has however been no significant attempt to incentivise/discipline the well-paid principal school teachers in the country. Despite tremendous growth of private schools at all levels around the country, the potential role of the private sector has been ignored by the government. For the first time, 2010 Right to Education Act acknowledged some role of private sector in the provision of basic schooling as private schools are now required to reserve 25% seats for the poor to be funded by the state. Given the gender gap in literacy and enrolment, there is further scope to protect the interests of girls, especially those from the lower castes who experience worse gender gap (Pal and Ghosh, 2012). While many countries around the world (including the US) has introduced school vouchers programme to encourage parental choice of schools, 2010 Right to Education Act gives state the right to promote
8 The survey covers households, schools and villages drawn from five Indian states including four of the country’s worst performing states, namely, Bihar, MP, Rajasthan and UP; the fifth state is a much better-off state Himachal Pradesh (HP). See Pal (2010) for further details.
9 Introduction of contract teachers, officially known as ‘para-teachers’, is somewhat different from other input-based school programs like mid-day meals, operation blackboard or Sarva Shiksha Abhiyan. Contract teacher schemes are favoured because they expand schooling access, increase teacher numbers, relieve multi-grade teaching and reduce class sizes in a fiscally manageable way (their salaries are about a third of regular teachers). More importantly, contract teachers generally have renewable (often annually renewable) contracts rather than regular teachers’ lifetime employment guarantees. As such, in addition to providing additional teaching inputs to schools, there is an important incentive mechanism in the employment of contract teachers, which in turn generates effect on student performance (relative to regular teachers) as found by Atherton and Kingdon (2010) in two north Indian states of Bihar and UP.
enrolment, attendance as well as attainment of children of school going age and as such has met with scepticism from different quarters. It is often argued that school vouchers that would fund students (rather than schools) may potentially be a more efficient as well as equitable system for boosting education for all. While the prevalence of private aided schools involves some element of public-private partnership in India, an effective role for the private sector in delivering basic education has so far been limited, as the country reserves more power for the state. It is about time to take a stock of things as we look beyond 2015.
The paper is developed as follows. Section 2 describes the data while section 3 explains the methodology. Results are discussed in section 4. The final section concludes.
2. DATA
Data has been compiled from various sources: This includes the Sixth (1992-93) and Seventh (2002-03) All India School Education Survey (AISES) data and also the Census data (1991 and 2001).10 District-level AISES data
cover information on the number of recognised schools (by management type, i.e., private/public, etc.), enrolment by gender and caste (scheduled castes, SC; scheduled tribes, ST), characteristics of teachers (gender/caste), and physical facilities at primary, upper primary and secondary levels of schooling in the district. District level census data from 1991 and 2001 provide information on population composition (by gender/caste); literacy rates for different age categories of the population (male/female and total); and access to various infrastructural facilities. In addition, we obtain district-level poverty head count rates information from the 50th (1993-94) and 55th (1999-00) rounds National Sample Survey (NSS) data. We merge 1991 Census data
and 50th round NSS data with 6th AISES to generate district-level information for 1992. Similarly, we merge
2001 Census data and 55th round NSS data with 7th AISES data to generate the corresponding district-level
information for 2002.11 This allows us to build up a two-period panel data for the period 1992-2002.12
There are three broad types of recognised schools in India, namely, government schools, private aided schools (PA) and private unaided schools (PUA) schools.13 Government and aided schools are invariably
10 Although Census 2011 district-level data would shortly be available, 8th All India School Education Survey is still being conducted
by the NCERT. It will take a good few years to obtain the latest round of CENSUS and AISES data. Hence, we are unable to update the data beyond 2002.
11 We need to do this because school census data collected every ten years are available only for 1992 and 2002.
12 Two clarifications are in order. First, given that there have been changes in the number of districts between 1991 and 2001 Census,
we consider only the districts present in both rounds of Census for the selected sixteen major states. These states are Andhra Pradesh, Assam, Bihar, Gujarat, Haryana, Jammu and Kashmir, Karanataka, Kerala, Madhya Pradesh (MP), Maharashtra, Orissa, Punjab, Rajasthan, Tamil Nadu, Uttar Pradesh (UP) and West Bengal. Second, between 1991 and 2001 Bihar, MP and UP were split to give rise to 3 new states namely Jharkhand, Chhatisgarh and Uttaranchal. Our sample districts include those districts which were parts of Jharkhand, Chhatisgarh and Uttaranchal in 2001 though were included under the parent states Bihar, MP and UP respectively.
13 In order to receive recognition, however PA and PUA schools must fulfil several requirements that are prohibitively expensive for many schools, especially those serving the poor (e.g., hold a sizeable cash bond with the government, provide sizeable playgrounds, etc.).
‘government-recognised’, i.e. they have the government stamp of approval. They are similar to each other in many respects since aided schools are almost entirely financed by the government and have little control over staffing (hiring/firing) and fee levels, despite being nominally privately managed.14 PUA schools (whether
recognised or not) are more autonomous than aided schools and are totally self-funded out of fee income. Thus PUA schools are the truly ‘private’ schools in India. At the secondary school level, all schools including PUA schools have to be government-recognised. But at the primary and upper primary levels, many PUA schools remain unrecognised.15 Non-recognised schools are not included in any government list of schools and are thus
not included in the periodic school ‘census’ (called the ‘All India School Education Survey’ (AISES)). As a result, our analysis in this paper can only include the recognised PUA schools rather than all PUA schools. This is an unfortunate but an inevitable data limitation since there is no source that provides information on unrecognised PUA schools for all districts of India going back to early 1990s16. However, in general, there is
likely to be a positive correlation between the share of recognised PUA schools and the share of all PUA schools (recognised and unrecognised) since districts that have more recognised PUA schools are also likely to be the districts that have more unrecognised PUA schools.17 As such our result would provide only a lower bound of
the growth of private schools in the Indian districts. In the rest of the paper whenever we refer to PUA or ‘private’ schools, we mean the recognised private unaided schools only. For the purposes of this paper, we exclude PA schools and compare the case of pure ‘government schools’ with the case recognised private unaided schools which we call simply ‘private schools’ or ‘PUA schools’.
Table 1 compares the quality of PUA and government schools at the district level over the decade 1992-2002, using some commonly used quality measures. In general, PUA schools tend to have better infrastructure (pucca building, access to drinking water and toilets) than government schools; however, government schools have significantly narrowed the gap in this respect over the decade. Compared to recognised PUA schools, Government schools have significantly higher pupil-teacher ratio (more than double at the primary level) and the situation does not change much over the decade under consideration. Furthermore, recognised PUA schools employ a higher proportion of female teachers. Although Table 1 does not show this, compared to government 14There is some inter-state variation in the management of PA schools. For example, PA schools in Uttar Pradesh have no control over
hiring/firing of own teachers (who are appointed by the UP School Service Commission). In contrast, PA schools in Tamil Nadu have some autonomy to select and hire their own teachers.
15 However, in most states, there are no board examinations at the primary of upper primary levels so there is no strong incentive for
private schools to seek government ‘recognition’ except if the school wishes ultimately to become a secondary school and affiliate with an exam board.
16 Even the District Information System on Education (DISE) data collection exercise – introduced in the late 1990s – does not have
the mandate/authority to collect information on all unrecognised PUA schools. Thus, even today there is no way of reliably knowing the number of unrecognised PUA schools in India, though see Kingdon (2008) for various estimates.
17 This can be supported by the PROBE data that distinguishes between recognised and unrecognised private schools in UP, Bihar, HP,
schools, PUA schools also have younger teachers, fewer teachers with (pre-service) training and fewer vacant teaching positions (see Pal 2010). Thus despite significant public interventions over the 1990s (for instance, the District Primary Education Programme since 1994 and Sarvashiksha Abhiyyan since 2001) to improve government schools, input differences between recognised PUA and government schools persisted by 2002. 2.1. Growth of private schools
Using 6th and 7th AISES data, we first calculate the average share of recognised PUA schools in total schools at a
given level (primary, upper primary and secondary) in a district, and also the corresponding district literacy rates, as summarised in Table 2. In each of the two years, the share of private schools at the secondary level (e.g., 15% in 1992) is significantly higher than at the primary level (e.g., 4.4% in 1992) 18. Over the course of
the decade 1992-2002, the pace of private school growth gathered momentum at all levels, with private school share at secondary level reaching 28% in 2002.
We also examine the nature of private school growth at primary, upper primary and secondary levels
across the regions in our sample. This is shown in Table 3. As shown in Table 2, the share of recognised PUA schools is significantly higher at the secondary level (relative to primary and upper primary levels) over the period 1992-02. Table 3 highlights the pronounced inter-regional variation in the rate of private school growth. We classify all districts into five regions, namely, east (Assam, Bihar, Orissa, West Bengal (WB)), west (Gujarat and Maharashtra), north west (Punjab and Haryana), north (Madhya Pradesh (MP), Rajasthan and Uttar Pradesh (UP)) and south (Andhra Pradesh (AP), Karnataka, Kerala and Tamil Nadu (TN)). In general, the rate of private school growth is relatively lower in the eastern states, especially at the primary and the upper primary levels. At the secondary level, the highest share of PUA schools is found in the socially backward northern states, namely MP, Rajasthan and UP, which are generally known for failing government schools (see Dreze and Kingdon, 2001). We use this regional variation in private school growth over the decade (1992-2002) to identify the causal effect of private school growth on literacy and gender gap in literacy in this paper.
2.2. Literacy rates and the gender gap in literacy
Unfortunately AISES data do not provide information on any learning outcomes. Hence we combine 1992 and 2002 AISES data with age/gender specific literacy data available from the 1991 and 2001 Census data respectively. According to the Indian Census definition, a person is considered to be literate if s/he is able to
18 It should be borne in mind that at the primary school level the share of private schools in total schools appears lower than the true
private share because there are no data on the private unrecognised schools. Kingdon (2008) shows estimates suggesting that a high proportion of private schools at the primary level remain unrecognised. Thus, our estimate of the private share of total primary schools is an underestimate.
read and write in any language. Additional information, e.g., knowledge of English (e.g., Census 1941-1971) are available in some Census. In the absence of any better alternative, we consider the ability to read and write in a given language as a learning outcome in our analysis.
Our analysis focuses on children aged 10-19 years. While this choice has been guided by the fact that we were unable to obtain 5-9 literacy rates for primary school age children, it allows us to focus on schooling beyond primary level. This is justified in the context that primary enrolment rate in India has been quite high by the turn of the century. While 10-14 literacy rates correspond broadly to literacy rates for upper primary level of education, those for 15-19 correspond to that for the secondary level. We also analyse the rate of growth of literacy rate for 10-19 years old taken together, and we do so for both male and female children. As before, we classify our sample into five regions, namely, east, west, north1, north 2 and south; this allows us to consider private school share and literacy rates not only for the whole of India, but also for the sub-regions in our sample.
Table 2 shows the literacy progress at primary, upper primary and secondary levels between 1992 and 2002, while Table 3 presents the male and female literacy rates for 10-14 and 15-19 age groups across the regions. Not surprisingly, literacy rates are lower for female children, in both the 10-14 and 15-19 age groups. The gender difference is significantly higher in the worse performing regions, e.g., see eastern (comprising of Assam, Bihar, WB and Orissa) and northern zones 2 (comprising of UP, MP and Rajasthan). Compared to the national average, age/gender specific literacy rates are lower in these two regions and higher in the west, south and north 1 (Punjab and Haryana) regions. In other words, literacy rates for a given gender not only vary across the regions and over time (1992-2002), but also across the age group (10-14, 15-19) depending on their year of birth.
2.3. Enrolment rates and gender gap in enrolment
We also consider the enrolment rates at upper primary and secondary levels where enrolment rates are defined as follows: it is the ratio of total enrolment at a given level of schooling as a share of total number of children in that age group in the district. Besides literacy, there is one advantage of looking at enrolment rates at a given level of schooling, as it also gives us an estimate of school completion at the previous level of schooling (barring the dropouts at the earlier level which we do not observe). In particular, enrolment at upper primary level is a lower bound of the estimate of primary school completion rates as children at the upper primary level are the ones who completed the primary level. Similarly, enrolment at the secondary level would give us a lower bound of the estimate of the completion rates at the upper primary level.
Table 2 summarises the enrolment rates in 1992-93 and 2002-03 at upper-primary and secondary levels of schooling in the sample districts. Interestingly, for a given year, compared to upper-primary level, slightly
lower enrolment rates are observed at secondary level of schooling for a given gender. However, as expected, enrolment among girls is significantly lower than those for boys in a given year at both upper-primary and secondary levels of schooling. Comparing enrolment figures over the decade, it appears that enrolment among boys have gone up in 2002-03 though those for girls have come down slightly for both levels of schooling considered here. As such, the gender gaps in enrolment at both upper-primary and secondary levels are higher in 2002-03.
3. HYPOTHESES AND METHODOLOGY
As set out in the introduction, we empirically model literacy rates as well as the gender gap in literacy rates, among children aged 10-19 years old. We also split 10-19 years old children into upper-primary (10-14 years) and secondary (15-19 years) school age groups and repeat the analysis separately for each age group. This allows us to explore the difference, if any, in the estimates between upper-primary and secondary school age group children. Finally, we also compare the literacy estimates with the alternative enrolment estimates.
3.1. Hypotheses
Private school growth and literacy: Clearly, increase in private school share at a given level of schooling (e.g., primary, upper-primary, secondary) in a district could affect literacy (or enrolment) through demand and/or supply forces. For a given supply of private unaided schools in a district, demand for private unaided schools would increase with income, returns to schooling and/or presence of failing state schools (e.g., see Muralidharan and Kremer 2008). Pal (2010) further argues that the supply of private unaided schools in a locality would depend not only on local demand, but also on access to local public infrastructure including access to local road, transport and communications, which maximises returns to private investment for given costs. In principle, a higher private school share may raise literacy if private schools impart higher learning than government schools, as has been found by some micro-level studies (e.g., see Kingdon 1996). The latter can be attributed to more efficient use of available resources (Jimenez, 1988), better organisational incentive structure (Jimenez et al. 1991) and lower proportion of unionised teachers and more effective class room teaching (Aslam and Kingdon, 2011). It may also raise literacy if competition from private schools boosts the quality of local government schools (e.g., Hoxby, 1994), which is, however, not supported by existing evidence from India
(Pal 2010).19 It may lower literacy rates if growth of private schools would cause the closure of or deterioration
in the quality of government schools (we are not yet aware of any such evidence). Private school growth may have no impact on literacy as well; if, for example, those who choose private schools are relatively better-off and/or more motivated towards schooling and would have become literate even in the absence of private schooling (e.g. via enrolment in government schools with/without private tuition), privatisation would not have a significant impact on literacy rates, other things remaining unchanged.
Private school growth and gender gap in literacy: A related issue is the implication of private school growth for gender gap in literacy/enrolment rates. This is particularly important for a country like India where a pronounced gender difference in literacy persists, especially in the large north Indian states such as Bihar, MP, Rajasthan and UP. Private school growth could potentially exacerbate gender difference in literacy rates since it may enable parents characterised by pronounced son-preference to send sons to private and daughters to government schools. If learning levels are better in private schools as has been documented by various micro-level studies, the gender gap in literacy and enrolment may increase with private school growth as girls, especially in the presence of son preference in school choice, are likely to be excluded from private schools. On the other hand, private schools may, at least to some extent, mitigate gender differences in educational outcomes, e.g., by fulfilling the differentiated demand for girls education. For example, private schools may encourage girls’ schooling in various ways: (i) provision of local schools so that girls do not have to travel far; (ii) provision of separate toilets for girls and boys in private schools, which may especially encourage schooling among adolescent girls; (iii) provision of English medium education, which may entail higher return for girls in the marriage market (Munshi and Rosenzweig, 2006).
Private school growth and caste gap in literacy: A further issue pertains to the caste-gap in literacy in India, which is even worse than the gender gap in literacy. Literacy rate among the lower castes (i.e., scheduled castes, SC and scheduled tribes, ST) was only 37.41% in 1991 compared to 52.21% for India as a whole; it was even lower among women belonging to the lower castes (23.76% as compared to 39.29% for all Indian women). Given the better accountability of private schools, it is expected that private school enrolment may boost performance of all students, including the SC/ST students. However given the close association between caste and poverty in India, the question is whether SC/ST students are able to attend fee-paying private schools. On balance, whether the growth of private schools has a negative, positive or neutral association with gender or caste gap in literacy rates, ceteris paribus, remains an open empirical question that we explore here.
19 The underlying hypothesis is that competition from newly emerging private schools in a community may improve student performance of local
government schools, as it may free up public schools resources. However, following Pal(2010), we argue that there is unlikely to be increased competition between public and private schools in the Indian context as school funding is guaranteed and not yet contingent on school performance.
3.2. Methodology
Having access to two-years district-level panel data, we start our analysis with the district fixed effects OLS estimates before moving on to the matching estimators.
3.2.1. Fixed effects OLS Models
Our central objective is to identify the effect of private school share (P) in a given district i at a given level l of schooling on literacy rates (Lilt) and gender gap in literacy rates (Gilt) in year t; l refers to upper primary (10-14),
secondary (15-19) or the pooled (10-19 years) level of schooling while t refers to 1992 and 2002.
The problem with the pooled OLS estimates for 1992-2002 for the sample districts is that it cannot control for omitted factors and hence may produce biased effect of private school share on literacy and gender gap in literacy. Further there could be bias arising from reverse causality: just as private school share may affect literacy, existing literacy in a district may also affect private school share. Also, a priori, it is not possible to indicate whether the estimation bias will be positive or negative.
Since we have access to data for two years, we choose to run fixed effects OLS estimates. We start with the most general specification for determining literacy (L) and gender gap in literacy (G) as follows:
′ (1)
′ (2)
Here Pilt is the share of private unaided schools (in total schools) at the l-th school level (l=14, 15-19 or
10-19 year olds) in district i in year t. In addition to P, we control for other possible factors affecting literacy and gender gap in literacy rates in our sample. In particular, the set of control variables X includes adult (25-49 years) literacy rates, share of urban population, proportion of scheduled caste (SC) and scheduled tribe (ST) population, ratio of female to male child 0-6 year olds and also supply of schools per child at the given level. Given the close link between literacy and earnings, we consider adult (25-49 years) literacy rates to be a good proxy for income or wealth. Since scheduled caste and scheduled tribe population are more disadvantaged than the general population and are also over-represented in Indian poverty, these SC and ST variables would also proxy for poverty. Since urban literacy rates are often much higher than the rural literacy rates in the Indian context, we include share of urban to rural population as a proxy for urbanisation with a view to explore its effects on literacy and gender gap.20 Son preference may also play an important role in parental allocation of
resources for education and other accounts. In the absence of a better alternative, our measure of
preference is the district ratio of surviving female to male children in the 0-6 age-range. Furthermore, it could be that in districts where there are more private schools, the overall supply of schooling is greater and that, access to schooling is greater. If so, the private school effect could capture an effect of schooling availability. In order to eliminate this possibility, we include number of total schools (at the relevant level, upper-primary, secondary or both pooled) per 100 children as an additional explanatory variable.
Given the multi-level nature of our data, we include both district ( 1, 2) and year-specific ( ,
fixed effects respectively in equations (1) and (2); the remaining errors are captured by (ε1, ε2), which are
independently and identically distributed. Use of panel data fixed effects models allow us to obtain consistent estimates net of time-invariant district-level unobserved heterogeneity.21 In particular, both private school
growth and literacy may be influenced by some unobserved time-invariant factors like district’s culture, institutions, labour market characteristics, gender and caste relations; the resultant estimates would be biased if these unobserved factors are correlated with the error term, thus justifying the use of panel data fixed effects models. Since we have only two data points for each district, these fixed effects estimates are also equivalent to the underlying first difference estimates of changes in literacy in terms of changes in private school share and also changes in other X variables.
3.2.2. Difference-in-difference matching estimator
An important problem with the fixed effects estimates discussed above is that these may still suffer from bias generated by the omitted time-varying variables, which may also influence the private school share P in a district, thus biasing the estimates. In an attempt to test the robustness of our FE-estimates, we now consider an alternative difference-in-difference matching estimator that exploits the variation in districts’ access to private schools between 1992 and 2002 to identify a causal effect of private schools share on literacy as well gender gap in literacy.
The underlying idea is as follows. Not all the sample districts had access to private schools at a given level in our sample. Between 1992 and 2002, on an average 5%-10% additional districts in our sample received access to private schools depending on the level (upper-primary or secondary) of schooling. We exploit this variation in the district’s access to private schools over 1992-2002 to identify a causal effect of private school growth on literacy and gender gap in literacy. As with fixed effects estimates, we also test the robustness of these literacy estimates by considering the enrolment estimates.
21 Nevertheless there could remain some time-varying unobservable variables like culture, institutions, gender and caste relations,
which may also influence literacy and gender gap in literacy. We however hope that a decade is not too long for these socio-cultural/institutional changes to affect literacy, accounting for which is a beyond the scope of the paper. Even if these changes are faster in some districts, we hope that on an average this variation will cancel out each other in aggregate in our sample.
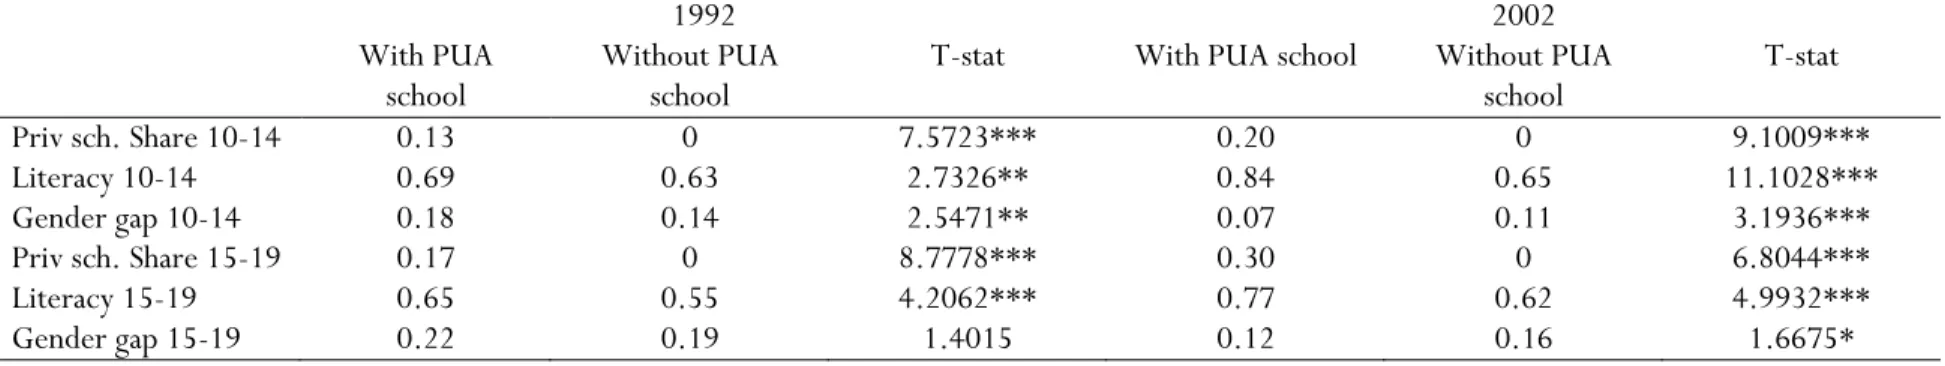
Let a treatment T be defined to be 1 if a sample district received any private schools (at a given level) during 1992-2002; otherwise it takes a value 0. Table 7 compares the mean characteristics of districts with/without private schools at a given schooling level (10-14 and 15-19) for 1992 and 2002. Clearly private schools share is increasing over time for both age groups, but more steeply for secondary school going children aged 15-19 years. Second, literacy rates for a given year are higher in districts with private schools and the literacy rate also increases more steeply for districts with private schools over the decade. Finally, gender gap in literacy is higher in 1992. Over the decade 1992-2002, the gender gap declines for each group and the gap is higher for districts without PUA schools; the latter holds for both age groups, 10-14 and 15-19 in our sample.
One of the important identification assumptions in this set-up is that there are no concerns about the unobserved heterogeneity in trends. We argue that the growth of the private schools over the decade 1992-2002 only affected the education outcomes of children who were young enough to be 10-19 year olds during this period. In other words, we assume that the private school growth did not have a significant impact on individuals in the older cohorts because they were too old to benefit from the private school growth. In this respect, allowing for late enrolment, if any, we consider the 25-49 age group in 1992 who moved on to 35-59 age group in 2002, who are unlikely to directly benefit from private school growth during 1992-2002. In an attempt to test this assumption in our sample we run the following regression. When we regress the private school share for 10-19 year olds on 25-49 literacy in 1992, the estimated coefficient of the private school share variable turns out to be 0.08 with a (robust) standard error of 0.0974; in other words, the estimated coefficient of private school share remains statistically insignificant for determining 25-49 literacy in 1992. Similarly, the estimated coefficient of the private school share variable for 10-19 year olds on 35-59 literacy in 2002 turns out to be 0.0943 with a standard error of 0.069 (robust) and again remains statistically insignificant. Although somewhat crude, we use this evidence to alleviate concerns about unobserved heterogeneity in trends.
Clearly access to private schools in a district is unlikely to be random and as such a direct comparison between treatment and control groups is not very informative. One can use propensity score matching (PSM) to adjust for the observed differences across treatment (districts with private schools) and control (districts without private schools) groups. The propensity score is the probability of receiving a treatment (in our case private schools), conditional on the covariates X. The idea is to compare districts who based on observables X have a very similar probability of receiving the treatment (similar propensity score), but some of them the received treatment and the others did not. In other words, controlling for the set of variables used to match the treatment and control districts, the growth in private schools in sample districts can be considered to be random and as such the matching estimator would allow us to identify a cleaner causal effect (in comparison to fixed
effects estimates discussed earlier) of private school growth on literacy (and enrolment) rates. This is executed as follows.
To obtain the propensity score for access to private schools at upper-primary and secondary levels, we use a logit model of district’s access to private schools on a set of explanatory variables X as guided by the existing literature. It has been argued that access to private unaided schools not only depends on the existing state school characteristics (Muralidharan and Kremer, 2008), but also on local demand for such schools (Pal, 2010). Accordingly, we use characteristics of the local government schools at a given level (e.g., pupils per teacher, access to drinking water and pucca building) and also access to local infrastructure.22 Second, we
include mean monthly per capita consumer expenditure as a factor determining the local demand for private schools. Although we do not have district-level data on returns to schooling at various levels, we argue that inclusion of state-regions fixed effects23 would control for unobserved state-regions-level returns to schooling in
our sample. The propensity score is then the predicted value of the share of private school variable generated from this first stage regression. Next we sort our sample by the propensity score obtained to divide it into blocks of observations with similar propensity sores for both treatment and control groups. The underlying rationale is that, after controlling for variation in income, returns to schooling and characteristics of state schools in sample districts (factors that determine the demand/supply of private unaided schools in a district), district’s access to private unaided schools can be considered random.
At the second stage, we classify the sample using the propensity scores for private school share, after controlling for ethnic composition of the population (SC, ST), share of urban to rural population, 0-6 female to male mortality rates. We also control for state/region dummies, year dummies and also state/region*year dummies with a view to strengthen controls for unobserved trends literacy/enrolment; we argue that the latter would control for changes in literacy/enrolment that would have happened in “natural course of events”.
. Within each block of observations, we then test (using a t-statistic), whether the means of the outcomes (O), i.e., literacy and gender gap in literacy for a given level (upper primary 10-14 or secondary 15-19) are equal in the treatment (T) and control (C) groups before/after the treatment. Accordingly, we derive the average treatment effect for each outcome variable of our choice as follows: (OT – OC)
2002 - (OT – OC)1992,
after controlling for a set of explanatory variables. Ceteris paribus, the net impact of private school growth on
22
We experimented with district’s access to various public infrastructure including roads, rail, post-office, public telephone office and but these variables were not statistically significant and hence we drop them from the final specification shown here. See further discussion in section 4.
23 We follow the conventions of the National Sample Survey (NSS) to define regions as follow. Regions are the hierarchial domains of
study below the level of state/union territory, which groups districts with similar geographical features and population densities as regions within a state. From 44th round NSS, the total number of regions has become 78. There are 61 state-regions in our district-level
any outcome variable is the difference in the treatment (who received private schools) and control (who did not receive private schools) districts over 1992-2002, which can be attributed to the treatment, after controlling for various factors to account for unobserved trends in literacy/enrolment rates in our sample.
4. RESULTS
We start with the simplest pooled OLS estimates of literacy and gender gap in literacy before moving on to the alternative OLS estimates for changes in literacy and gender gap in literacy in terms of initial values of the private school shares among other covariates. While these OLS estimates for levels and first difference of outcomes are available on request, our preferred estimates are the FE-OLS estimates (see section 4.1) which controls for the observed time invariant omitted factors. As indicated earlier, the fixed effects estimates may however suffer from bias generated by the omitted time-varying variables that may influence private school share in a district. In an attempt to test the robustness of our FE-estimates, we consider a difference-in-difference matching estimator which exploits the variation in district’s access to private schools over 1992-2002 to identify a causal effect of private school growth on literacy and gender gap in literacy (see section 4.2 for further discussion).
4.1. Pooled OLS estimates of literacy and gender gap in literacy
Pooled OLS estimates of literacy and gender gap in literacy are summarised in Table 4. After controlling for all other factors, greater private school share is associated with significantly higher literacy for 10-14, 15-19 and also 10-19 year olds; private school share does not however have a significant association with gender gap in literacy. Underlying partial correlations are 0.13, 0.10 respectively for 10-14 and 15-19 year old children in our sample while it turns out to be 0.15 for 10-19 year olds when pooled together.
Case of SC/ST children
One may also argue that the effect of private school growth on overall literacy may blur what happens to the marginalised group of low caste population, who are far behind the general population in terms of literacy achievements (Pal and Ghosh, 2012). We use 2001 Census literacy data for SC/ST children aged 10-19 years old to examine if there is any private school effect for these marginalised social groups. Since separate SC/ST literacy data for the particular age groups (10-14 and 15-19) are not available for 1991 Census and also since 2001 SC/ST literacy data from the Census does not offer separate information for male and female children in
any age group, we can only obtain robust OLS estimates (with clustered errors at the district level) of literacy rates for SC/ST children (see Table 5).
While it is difficult to establish any causal effect with single cross-section data, these OLS estimates would nevertheless highlight some important associations, which remain rather unexplored in the literature. It is interesting to compare these OLS estimates with those for all children (see Table 4). Compared to the general population, partial correlations are significantly higher for disadvantaged SC/ST children. In other words, there is suggestion from these simple OLS estimates that there are some literacy gains to be had from private school growth even among SC/ST children, especially among 10-14 year olds. It would be interesting to see if this positive private school effect on literacy is upheld in the panel data FE models.
4.2. FE-OLS estimates
Table 6 summarises the FE-OLS estimates of literacy and gender gap in literacy (the full set of estimates are shown in Appendix Table A2). All standard errors are robust to clustering at the district level. These estimates are preferred to pooled ols as it minimises any bias arising from district-level unobserved heterogeneity, if any.
Results suggest that higher private school share is associated with significantly higher literacy for all age groups while it is associated with significantly lower gender gap in literacy only among 10-14 year old children. In particular, one standard deviation (i.e., 0.16 from Appendix Table A1) increase in private school share at the upper primary level is associated with 5.9% increase in 10-14 literacy rate and 1.5% decrease in gender gap in literacy. In other words, one standard deviation increase in private school share amounts to about 8% rise with respect to the mean literacy (0.74) rate and 12% decline with respect to the mean gender gap in literacy (0.1279) in our sample. There is also a significant positive effect of private school growth on secondary literacy rate: one standard deviation increase in secondary private school share is associated with about 3% increase in 15-19 literacy rate. Evidently, the literacy effect of private school growth is most pronounced for the younger age-group, 10-14 year olds, who naturally benefitted more from the recent trend of private school growth around the country; these children started school at a time when the private school growth picked up.
In addition, adult literacy rates (25-49 years) tend to boost literacy and lower gender gap in literacy in all the relevant age groups (10-19 years old) that we consider. It also follows that districts with higher share of ST population experienced higher literacy during 1992-2002 while the effect of SC population has generally been insignificant in our sample. Rate of urbanisation also fails to have any significant effect on literacy.24
It has often been argued that the necessity of being accountable to parents causes private schools and
teachers to apply more effort. The notion that private management of schools leads to higher teacher effort is supported in some recent studies on India. For instance, using data from 20 Indian states Muralidharan and Kremer (2008) find that within the same village, teacher absence rate in private schools is about 8 percentage points lower than in government schools. This is similar to the findings in Kingdon and Banerji (2009) for Uttar Pradesh and Bihar. More generally, our findings of a positive private school effect on literacy among 10-19 year olds, especially for 10-14 year olds are consistent with a growing body of literature that finds similarly, using data from different sources and using different methods (e.g., Desai, et al, 2008).
A comparison of the pooled ols results (Table 4) with FE-OLS estimates (Table 6) is useful here. While both pooled OLS and FE-OLS estimates highlight a positive and significant effect of private school share on literacy, the size of the effect is larger in FE-OLS, especially for 10-14 age group. However unlike the pooled ols estimates (Table 4), the private school effect on gender gap turns out to be negative and significant (only at 10% level) for 10-14 year olds in FE-OLS estimates.
We next check the robustness of our literacy estimates by considering the corresponding fixed effects estimates of enrolment rates. In this respect, we consider a sequential approach to assume that enrolment at upper primary level depends on the share of PUA schools at primary and upper-primary level while that at secondary level depends on the share of PUA schools at primary, upper-primary and secondary levels. This is because enrolment at upper primary level not only depends on primary completion (which depends on access to PUA schools at primary level), but also access to PUA schools at the upper primary level. Similarly, enrolment at secondary level not only depends on primary and upper primary completion (which would respectively depend on access to PUA schools at these levels), but also access to PUA schools at secondary levels. All other control variables are as in equations (4) and (5). These estimates summarised in Appendix Table A3 corroborates the literacy effects that we observe in Table 7. In particular, there are statistically significant and positive effects of private school shares on enrolment rates at upper primary and secondary levels. In particular, one standard deviation increase in private school share is associated with 6.4% and 19.6% increase in enrolment rates respectively for 10-14 and 15-19 year olds in our sample, thus suggesting that the private school growth effect on enrolment is higher for the secondary age group children. Further, unlike the private school effect on gender gap in literacy, the effect of PUA school share is positive and significant for the gender gap in enrolment at the upper-primary level while there is no significant gender gap effect at the secondary level. One standard deviation (0.16) increase in 10-14 private school share is associated with a 3.5% increase in gender gap in enrolment. This evidence appears to be compatible with a recent Times of India article (3 November 2011) argues that India's abysmal gender inequality statistics seem to have taken a turn for the worse. It is however possible that these fixed effects estimates are likely to suffer from bias generated by the omission of time-varying
omitted factors (e.g., changes in income and returns to schooling over this period), which may be correlated with the private school share. In order to test the robustness of these estimates, we next move to consider the matching estimates.
4.4. Matching Estimates
Since it is difficult to redress the estimation bias within fixed-effects models arising from the omitted time-varying factors, we now consider a difference-in-difference matching estimates using propensity score matching.
Table 8 summarises the first stage logit maximum likelihood estimates of a district’s access to private school in our sample. There is confirmation that the greater the pupil per teacher ratio in government schools in the district, the greater is the likelihood that the district has access to private schools and this holds for both 10-14 and 15-19 year olds. Interestingly, however, access to physical infrastructure like pucca building and drinking water in the district government school is associated with growth of private schools in our sample. In other words, it seems that parental demand for private schools in our sample arises more from the unfavourable teaching rather than non-teaching inputs in local government schools. Further, as expected, higher monthly per capita consumer expenditure of a district significantly boost the likelihood of private school access in the district for 10-14 year olds, after controlling for other factors; while the effect is similar for 15-19 year olds, it is not statistically significant. We also experimented with district’s access to various public infrastructure including roads, rail, post-office, public telephone office and also the gini inequality index in the distribution of monthly per capita expenditure, but these variables were not statistically significant and hence we drop them from the final specification shown here. Many of the state-region fixed effects are significant too, thus signifying the importance of various state-region-specific factors including returns to schooling in determining a district’s access to private unaided schools in our sample.
Table 9 summarises the average treatment effects for the outcome variables (literacy, gender gap in literacy, enrolment and gender gap in enrolment) at upper-primary and secondary levels, using matching with the nearest neighbour method. The average treatment effects of private school growth are 7.2% and 7.4% for literacy among 10-14 year olds and 15-19 year olds respectively and both effects are statistically significant too. The average treatment effects for gender gap are -9% and 1.7% respectively for 10-14 and 15-19 year olds, but the gender gap effect is significant only for 10-14 year olds in our sample. We also compare these average treatment effects with those obtained by using matching with stratification method (see Table 10). Clearly the average treatment effects using stratification matching method are somewhat lower (because of different number of matched treatment and control blocks in these two methods), but both sets of estimates seem to
mirror the fixed effects estimates for literacy obtained earlier. The private school effect on gender gap in literacy, however, remains insignificant for both 10-14 and 15-19 year olds in this case.
Evidently, the size of the private school effects for literacy in fixed effects models shown in Table 6 is somewhat different than the PSM estimates suggest (Table 9); to a large extent, this can be related to the use of private school share as a continuous variable in the fixed effects model rather than access to private school as a binary variable in the matching estimator. Also, given the difference in methodology, the PSM sample is rather different from the full sample considered in FE model. Nevertheless, it is reassuring that the difference in difference matching estimates mirror the fixed effects estimates in that we identify a significant favourable effects of private school share for literacy for both 10-14 and 15-19 year olds. Gender gap in literacy is negative significant only for 10-14 year olds; as before, the effect remains insignificant for gender gap among 15-19 year olds.
Finally, we consider the matching estimates for enrolment rates as summarised in Table 9.25 These
results seem to confirm the significant effects of private school growth only on enrolment, but not on gender gap in enrolment among 10-14 and 15-19 age groups. In particular, the enrolment effect is about 10% among 10-14 year olds and about 5% among 15-19 year olds, which again suggests that the 10-14 year olds in 2002 have been the major beneficiaries of the private school growth in the country in our sample. However, the private school effect on 10-14 gender gap in enrolment is positive though not significant. In addition to the literacy effects of private school growth that we discuss above, the particular advantage of the significant enrolment effects that we identify here pertains to school completion/progression effects: private school growth is associated with at least 10% more primary completion and 5% more upper primary school completion rates in our sample. Taken together, all different methods highlight a significant and positive private school effect on both literacy and enrolment rates; the private school effect on gender gap in literacy and enrolment is however much weaker among 10-19 year olds in our sample.
5. CONCLUDING COMMENTS
Using a unique district-level panel data for the period 1992-2002 compiled from various official sources, the present paper examines whether private school growth can promote schooling in Indian districts. In the light of the available data, our analysis focuses on children aged 10-19 years old, i.e., those likely to attend upper primary and secondary schools in India, over the decade 1992-2002. Access to two years district-level panel data
from 17 major states in India allows us to estimate the causal effect of private school growth on youth literacy as well as school progression measured by enrolment rates for 10-19 year olds. The identification strategy has been to exploit the variation in private school growth across districts and over time in our sample. We also show that the schooling outcomes among the older cohorts who did not benefit from the private school growth over this period is not correlated with access to private schools in our sample districts. Using difference-in-difference matching estimator, we consider the average treatment effects of private school growth on literacy and enrolment rates in our sample, after controlling for various observable factors and also possible unobservable trends. As such, we argue that the private school share can be considered random and the resultant treatment effects yield the causal effects of private school growth on selected school outcome variables in our sample
In general, propensity score matching estimators seem to mirror the fixed effects estimates of literacy and enrolment that we obtain: ceteris paribus, there is evidence of positive and significant effects of private school growth on literacy and enrolment rates for both 10-14 and 15-19 year olds in our sample. However the average treatment effect of gender gap in literacy turns out to be negative and significant only for 10-14 year olds while we do not find any significant effect of private school growth on gender gap in enrolment rates.
While our results identify a potentially effective role for the recognised private unaided schools for securing higher literacy and enrolment, there is a need to look after the interests of the poor and the marginalised (e.g., female and low caste population) who are likely to be disadvantaged under private provision of basic schooling (our results were not unambiguous in this respect). To some extent, our results support the recent provision of the Right to Education Act 2010 that requires private unaided schools to reserve 25% of seats for children from poor families. There is scope for the act to go further to protect the interests of girls, especially those from low caste children, who are worse-off than the general population. There are also some concerns about how the Act is implemented. Currently, the Act puts the responsibility of ensuring enrolment, attendance and completion on the state and, as such, it does not offer any choice to parents as in school voucher schemes successfully offered in many other countries. We hope that the current UN efforts to reassess the MDGs will look into these emerging issues to tackle the problems of youth literacy and enrolment beyond 2015.
References
Afridi, F. (2011) ‘The Impact of Schools Meals on School Participation: Recent Evidence from Rural India’,
Journal of Development Studies 47(11): 1636-1656.
Angrist, J., Bettinger, E., Bloom, E., King, E., & Kremer, M. (2002). Vouchers for private schooling in Colombia: Evidence from a randomized natural experiment. The American Economic Review, 92(5), 1535-1558.
Aslam, M. and G. Kingdon. (2011) ‘What Can Teachers Do to Raise Pupil Achievement?’ Economics of Education Review 30(3), pages 559-574.
Banerjee, A. S. Cole, E. Duflo and L. Linden (2007) Remedying Education: Evidence from Two Randomized Experiments in India’, mimeo MIT.
Bashir, S. (1994) ‘Public versus Private in Primary Education: Comparison of School Effectiveness and Costs in Tamil Nadu’, PhD Dissertation, London School of Economics.
Bedi, A.S. and A. Garg. (2000) ‘The Effectiveness of Private versus Public Schools: The Case of Indonesia’, Journal of Development Economics 61: 463-94.
Beegle, K and D. Newhouse. (2006) The Effect of School Type on Academic Achievement: Evidence from Indonesia’, Journal of Human Resources XLI(3):529-557.
Bloom, J.E., D.E. Cohen and M.B. Malin. 2006 ‘Educating All Children: A Global Agenda’, Cambridge MA: MIT Press.
Census of India. (2001) ‘Data Highlights: Migration Tables D1, D2 and D3’, Office of the Registrar General, India, Government of India. www.censusindia.net/results/dseries/data_highlights_D1D2D3.pdf. Chaudhary, Nazmul, Jeffrey Hammer, Michael Kremer, Karthik Muralidharan and Halsey Rogers. (2005)
“Teacher Absence in India: A Snapshot.” Journal of the European Economic Association, Vol. 3(2): 658-67. Chudgar, A. and E. Quin. (2012) Relationship between Private Schooling and Achievement: Results from Rural
and Urban India’, Economics of Education Review 31(4) 376-390.
Desai, S., A. Dube, R. Vanneman and R. Banerji. (2008) ‘Private Schooling in India – A New Educational Landscape’, mimeo University of Maryland and NCAER.
Drèze, J. and G. Kingdon. (2001) “School Participation in Rural India”, Review of Development Economics, 5(1): 1-33.
Duflo, E. 2001. ‘Schooling and Labour Market Consequences of School Construction in Indonesia: Evidence from An Unusual Policy Experiment’, American Economic Review 91(4): 795-813.
Duflo, Esther and Rema Hanna (2005) “Monitoring Works: Getting Teachers to Come to School”, NBER working paper 11880.
Glewwe, P. (2002) ‘Schools and Skills in Developing Countries: Education Policies and Socio-economic Outcomes’, Journal of Economic Literature, 40(2): 436-482, 2002.
Hanushek, E. 1997. ‘Assessing the effect of school resources on Student Performance: An update’, Educational Evaluation and Policy Analysis, pp. 141-164.
Hanushek, E. and L. Woessman. (2008) ‘The Role of Cognitive Skills in Economic Development’ Journal of Economic Literature 46(3): 607-668.
Hoxby, C. (1994) ‘Do Private Schools Provide Competition for Public Schools?’ NBER working paper No. 4978d.
Jimenez, E., Lockheed, M., & Wattanawaha, N. (1988). The relative efficiency of private and public schools: The case of Thailand. The World Bank Economic Review, 2(2), 139-164.
Jimenez, E., & Lockheed, M. E. (1991). Private versus public education: An international perspective.
International Journal of Educational Research, 15(5), 353-497.
Jimenez, E., & Lockheed, M. E. (1995). Public and private secondary education in developing countries: A comparative study. World Bank discussion papers no. 309. The World Bank, 1818 H Street, NW, Washington, DC 20433.