The State of
AMERICAN
INDIAN
&
ALASKA
NATIVE
Education in California
2014
PREFACE SPECIAL THANKS INTRODUCTION SPONSOR ACKNOWLEDGEMENTS EXECUTIVE SUMMARY STRUCTURE AND METHODOLOGY PART I DEMOGRAPHICS AND ENROLLMENT OF AI/AN IN PSE
TABLE
OF
CONTENTS
PART II CSU & UC 10-YEAR ENROLLMENT AND TRANSFER TRENDS PART III INSTITUTIONAL PROFILES PART IV POSTSECONDARY EDUCATION AI/AN DATA REPORTS PART V K-12 UPDATES4
5
13
13
10
8
6
17
21
66
47
PART VI PROMISING PRACTICES AND NEXT STEPS PART VII CONCLUSION APPENDIX 2014 FIGURE AND TABLE INDEX 2012 TABLE AND CHART INDEX BIBLIOGRAPHY AND DATA SOURCES NOTES
68
71
73
74
76
77
78
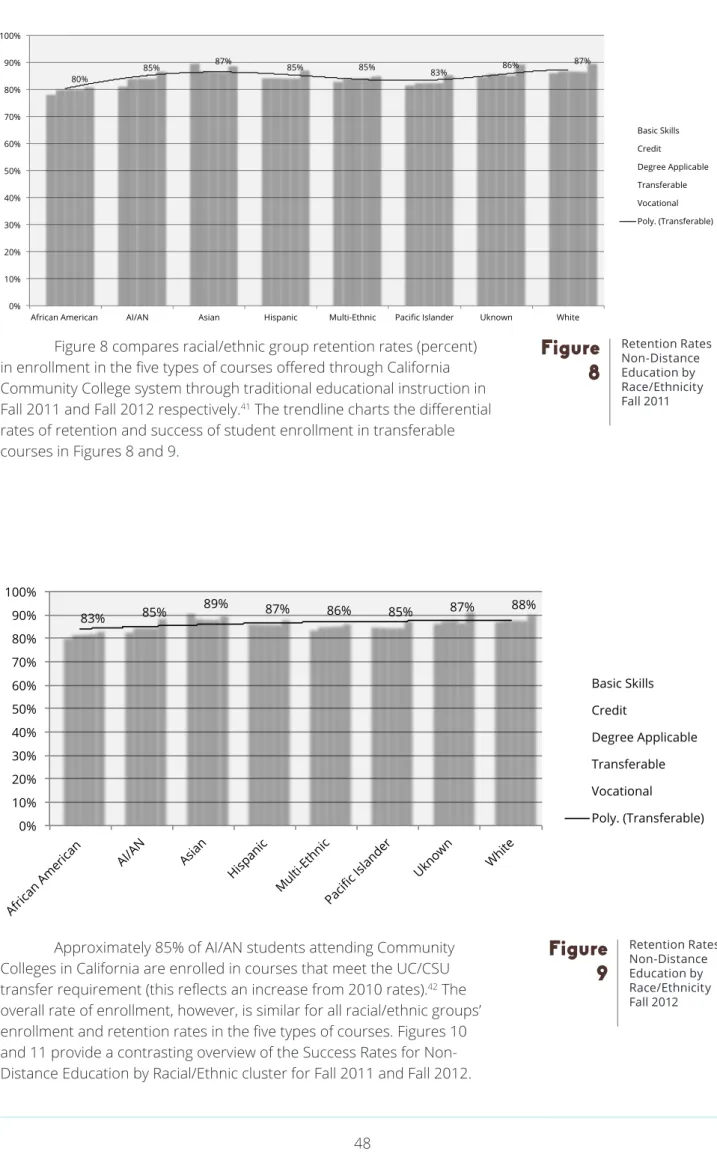
The California Department of Education in 2012 received the first in a series of reports assessing the educational enrollment, retention, and graduation rates of American Indian and Alaska Natives (AI/AN) in California’s public educational system.
That report,The State of the American Indian and Alaska Native Education in California,
revealed alarming gaps in AI/AN matriculation and graduation compared to other ethnic groups in the state. In particular, the decline in overall college readiness for AI/AN students to meet the “A-G” college entry requirements points to the specific work that must be done to improve college-readiness for California’s AI/AN population.
The second year report shines a brighter light on where and when the decline in AI/AN enrollment is occurring, specifically within the California State University and University of California systems.
In the following pages you will find updated data about the AI/AN enrollment, retention, and graduation rates and workforce breakdowns across the three-tier system. You will also find institutional profiles highlighting the community outreach, student support, and academic resources available to assist AI/AN students achieve their goals in
postsecondary education.
The California Indian Culture and Sovereignty Center at California State University San Marcos, under the direction of Dr. Joely Proudfit, is breaking new ground and leading the way in providing valuable research. These findings should help innovate institutional approaches to recruiting, enrolling, retaining, and graduating from college AI/AN
students.
The State of American Indian and Alaska Native Education in California 2014report is a resource for tribal leaders, educators, and the community. Please join me in putting to work the information contained in this report to help ensure our American Indian/Alaska Native students—and all California students—learn the skills they will need to be successful in the21st century.
Best regards,
Tom Torlakson
Thank
You
The report on the State of American Indian and Alaska Native (AI/AN) Education in California2014 is the second publication in a three-part series made possible by financial support from the San Manuel Band of Mission Indians.
The San Manuel Band of Mission Indians is an invaluable tribal partner and has made an
“investment change”1 in public policy reporting about the educational attainments, roadblocks, gaps, and
achievements of American Indians and Alaska Natives in the State. Without their progressive investment this work would not be possible.
INTRODUCTION
The findings from the California Indian Culture and Sovereignty Center’s 2012 report confirmed the need for greater efforts to prepare, to recruit, to retain, and to graduate Native youth from institutions of higher education. In particular, the realization that AI/AN enrollment rates are declining across the CSUs was alarming. These results provided the basis to delve deeper into the program, outreach, and support of postsecondary institutions in the 2014 report to determine where enrollment and transfer numbers are decreasing or increasing; to determine what the best practices at state colleges and universities to attract, retain, and graduate AI/ANs are; and correspondingly to determine where we, as educators of AI/AN students in the state of California, need to improve.The second report of the State of American Indian and Alaska Native Education in California presents its results from a cross-sectional examination of the programs and services offered to AI/AN students and communities in the state at our postsecondary institutions of higher education and includes updated data for high school achievement rates, dropout rates, and K-12 education in the state, as well as information regarding AI/AN personnel at all levels of education at public institutions.
The underlying problem the 2014 report addresses is where the numbers of AI/AN at community colleges and California State Universities are declining and where the enrollments at University of California are increasing. The ten-year enrollment and transfer numbers presented in the 2014 report show us precisely where our AI/AN students are enrolling and in what quantity at CSU and UC campuses. The institutional profiles in the report detail the
2012
FINDINGS
AI/AN high school students have a disproportionately high dropout rate compared to the state average
AI/AN are severely underrepresented in California’s three-tier higher
education system
AI/AN graduation rates at CSU are lower than the state average for other ethnic groups in 2004 cohort
AI/AN personnel at all levels in public education and postsecondary institu-tions are lacking, in particular at schools and colleges with high rates of AI/AN enrollment due to the close proximity and concentration of AI/ANs in an urban or reservation location
2012
RECOMENDATIONS
A call to centralize the data about AI/AN educational enrollment and attainment in a coherent and accessible formand location
Development of a Tribal Workgroup to discuss and determine the type of data and research that would be most effec-tive, beneficial, and informative for tribal communities to further their educational goals
Create a procedure to evaluate where educational funding is being spent, who it is given to, and what results they are achieving with the funding
Increase teacher training and resources at all levels of AI/AN education to include AI/AN culture competency and community-based methodologies to support AIAN learning
work being done across the state; we highlight the work as models of “promising practices;” and evaluate across a 10-year period where the rates of enrollment and transfer admissions are increasing or decreasing at these schools. The research staff at the CICSC utilized a quantitative and a qualitative process to provide a more comprehensive
understanding about the state of AI/AN education at participating schools in this report. Despite our best efforts to include the widest sample of institutional profiles, our requests for participation did not result in a complete portfolio of all the schools offering programs and services to recruit, retain, and graduate AI/AN students.
CICSC researchers sent out a statewide survey to community colleges, state universities, and UCs with high concentrations of AI/AN populations and/or reservations in the school’s service area based on the 2010 census. The result from this effort is presented here with 4 CCCs, 4 CSUs, and 3 UCs profiles.2 Although our response
pool is smaller than we initially planned for, the CICSC is encouraged by the geographic range of responses from northern, central and southern California postsecondary institutions; and we hope, that with support from the CSU and UC’s Chancellor’s respective offices, to include all 23 CSU and 10 UC campuses in future reports.
The model the CICSC used to develop its approach and methodology in the 2014 report is the Pathways for Native American Students: A Report on Colleges and Universities in Washington State (2009). While the Washington state report represents what is possible when public, private, and tribal stakeholders fund and support, at a high institutional level, research to inform educational policy pertaining to American Indians and Alaska Natives, the CICSC has a lone tribal investor funding this project and no other public, private, institutional, or departmental support. Nonetheless just as the Pathways for Native American Students report is the first of its kind and provides critical insights and analyses of the state’s obligations and outcomes in providing access and support of AI/AN education from preschool to graduate school for the state of Washington, so do the first and second year educational reports from the CICSC.
Our goal with each report is to gather relevant data, present it in a user-friendly format, and provide our tribal educators, business owners, leaders, and community members with the
facts needed to make informed decisions about accessing higher education in California. While our resources are limited, we, like our ancestors before us, make do with the tools we have and hope that through our hard work and small
but diligent contribution, we will help make our communities stronger.
At his visit to CSUSM in October 2013, Chancellor Timothy White reported that 1 out of every 10 employees in California’s workforce are products of the CSU system. In 2012 alone, the CSU system produced nearly 100,000 degrees; this is an institutional accomplishment that Chancellor White remarked, “nobody else in the state, the country or the world can say.” The total number of degrees awarded to AI/AN in the CSUs in 2011-2012 was 470 or 41% of the state.3 During the
Campus Forum, I had the opportunity to address Chancellor White and compliment him on his track record working with tribes to establish regional Memorandums of Understanding for educational achievement in Idaho and in Riverside County, California. In response to my reference to the overall decline of AI/AN enrollment rates across the CSU and my desire to have his support in the CICSC’s research of this issue, Chancellor White said “you bet; I am on your side” to which the audience applauded. He then added that my “comments portend to the bigger, noble cause for California to succeed and for the nation to succeed in the bigger, global set of forces, we have to have every people succeed.”
No words could be more true or dire for American Indian and Alaska Native peoples in California. Higher education is vital for Tribal Nations to effectively build sustainable economies, preserve Native languages and cultural traditions, and advance in digital technology. Education is the great equalizer, and although AI/ANs are a fraction of the general population, our political and cultural futures depend on an educated workforce: both tribal and nontribal. In the end, we share the same threats from “global forces” and the same belief in the “noble cause” that Chancellor White alluded to in his remarks.
ACKNOWLEDGEMENTS
The work at the CICSC is not created in a vacuum. Several people collaborated, passionately discussed, and painstakingly sifted through hours of statistics to create this report. My vision from the moment I was hired to coordinate the Native American Studies program at CSUSM and direct the CICSC is one of community advocacy and participatory research with our tribal, non-tribal, and campus communities. At all levels of this project from inception to publication, my research team helped me chart a course of action for our still maiden voyage into groundbreaking waters.
Mr. Seth San Juan (Yaqui) was the research associate for the 2012 report and he conducted the interviews for the institutional profiles featured in the 2014 reports. He recently joined the faculty ranks at Palomar College in the American Indian Studies department; a special thanks goes out to him for his contributions to the report. Dr. Theresa Gregor, a Kumeyaay descendant from Santa Ysabel, joined the CICSC in the fall semester 2013 to replace Mr. San Juan. She is an active tribal community presence, voice, and representative at the CICSC. Dr. Gregor sifted through the data to answer my questions, streamlined the findings, then analyzed and prepared the report for publication. Megan Doughty is responsible for the layout, photos, and final format of the report. Gratitude is also extended to CSUSM’s Office of the Tribal Liaison, Ms. Tishmall Turner (Luiseño), whose work to bridge cultural divides and promote the institutional changes in American Indian education at CSUSM on and off campus is exemplary and unparalleled in the state; finally, a special note of appreciation must be acknowledged to all the CICSC student workers, who assisted in drafting the appendices. They are our future leaders and their presence and work at CSUSM speaks for itself.
Finally the financial support from the San Manuel Band of Indians, the commitment from the tribal leadership locally in San Diego County, and throughout California is acknowledged. Credit goes to those members who show up, speak out, and demand the fulfillment of treaty obligations to AI/ANs in education; this report is good fuel for your “Council Fires” and it is knowledge to be shared and used for future tribal-institutional collaborations.
SPECIAL
THANKS
from
The California Indian
Culture and
Sovereignty Center
Joely Proudfit, Ph.D.
Director of the California Indian Culture and Sovereignty Center Director of Native American Academic Strategic Planning Director of Native Studies
EXECUTIVE
SUMMARY
AI/AN students in 9th-12th-grade continue to fall disproportionally below state achievement levels for graduation and completion of UC/CSU requirements for college entry.• Statewide Totals for Graduation: » Total Graduation Rate: 78.7% » AI/AN Graduation Rate: 72.3%
» Graduation Rate Difference for AI/AN: 6.4% lower
The AI/AN high school dropout rate for 2011-2012 remains higher than all other ethnic/racial groups in the state except for Hispanic/Latinos despite the fact that AI/ANs comprise 1.9% of state demo-graphics and Hispanic/Latinos comprise 37.6% of the state population.
• Statewide Totals for Dropout Rates: » Total Dropouts for State: 13.1% » AI/AN Dropout Rate: 18.5%
» Dropout Rate Difference for AIAN: 5.4% higher
75% of AI/AN high school graduates do not complete UC/CSU requirements for college admittance: » Total for State: 38.3%
» AI/AN Total: 24.9%
» Rate Difference for AIAN: 13.4% lower
The AI/AN enrollment rate at postsecondary institutions in the state is declining in the community college and CSU system, while there is a slight increase of enrollment of AI/AN students in the UC system.
» The enrollment rates from Fall 2011 to Fall 2012 for AI/AN at Community Colleges shows a de-cline of 16% (or a loss of 1,386 students)
» The enrollment rates from Fall 2011 to Fall 2012 for AI/AN students at California State Universi-ties shows a 61% reduction (or a loss of about 1,100 students)
» The University of California system shows an increase of 67% in enrollment of AI/AN students from Fall 2011 to Fall 2012
Enrollment at California Community Colleges and transfer rates to both CSU and UC are declining: • AI/AN enrollment at CCC shows declined by 0.05% from 2011-2012
• Transfer admits to CSU from 2010-2012 decline by 74% (from 272 in 2010-2011 to 156 in 2011-2012) • Transfer admits to UC declined from 2010-2011 by 26% (from 241 students to 170) and although the numbers increased by 36 students in 2011-2012, the overall rate is still a 4% reduction from the 2010 rates (actual students increased from 2011-2012 from 170 students to 206)
K-12 AI/AN Personnel and Faculty Updates
• The number of AI/AN students enrolled in K-12 for the 2012-2013 academic school year was 40,414 (0.65%).
• AI/AN teachers, administrators, and staff for K-12 comprise 3,417 personnel (1.58%).
Postsecondary Institutions AI/AN Personnel and Faculty Updates
• We reported that the AI/AN employment rate at California Community Colleges in 2010 was 0.8%, in 2011 and 2012 the employment rate decreased to 0.7% and 0.73% respectively.
» According to the 2012 Annual Fall Reports on staffing AI/ANs make up 0.93% of the total workforce at the California Community Colleges totaling about 793 employees across 112 campuses. » Compared to the rates reported in our 2012 publication, the data
shows an increase in AI/AN workforce by 115 personnel, which includes one more tenure(d) track appointment for an AI/AN. • AI/AN Faculty and Personnel Updates, California State University
» 29% of 11,348 faculty and ethnic minority
» 12% of minority women (894) are tenured compared to 28% of men (2,883)
» 17% of tenured minority men (1,249) versus 40% of tenured white men (2,883)
• AI/AN Faculty and Personnel Updates, University of California » 218 personnel classified as Academic
» 692 personnel classified as Non-Academic
» 52 Senior Management (SMG) & Management and Senior Professionals (MSP)
» 640 Professional & Support Staff (PSS)
AI/AN First-Time Full-Time Freshman (FTF) at CSUs (2002-2012) • Highest number of FTF AI/AN enrolled at CSUs in 10-year period:
» San Luis Obispo with 37 students (2007)
• Lowest number of FTF AI/AN enrolled at CSUs in 10-year period: » Dominguez Hills with 0 students (2003, 2005, & 2008) » Maritime Academy with 0 students (2009 & 2010) » Channel Islands with 0 students (2002)
» Stanislaus with 0 students (2009)
• High/Low number of FTF AI/AN enrolled at CSUs in 10-year period: » Chico with 28 student (2007) and 9 students (2010) » Humboldt with 25 students (2007) and 6 students (2009) » SDSU with 27 students (2007-2008) and 3 students (2012) » CSUSM with 14 students (2008) and 4 students (2002,2004 and
Transfer Admissions of AI/AN at CSUs (2002-2012)
• Highest number of AI/AN transfer students at CSUs in 10-Year Period: » Sacramento with 35 students (2007)
» San Diego with 31 students (2004) » Fresno with 25 students (2006)
• Lowest number of AI/AN transfer students at CSUs in 10-year Period:
» Maritime Academy with 0 students (2003-4 & 2006-08, & 2010-2012) » Monterey Bay with 1 student (2011)
» San Luis Obispo with 1 student (2011-12)
• High/Low number of AI/AN transfer students at CSUs in 10-year period: » Chico with 30 student (2002) and 11 students (2010-2011) » Humboldt with 27 students (2003) and 7 students (2010) » SDSU with 31 students (2005) and 6 students (2010) » CSUSM with 12 students (2006) and 2 students (2011) AI/AN First-Time Full-Time Freshman (FTF) at UCs (2002-2012)
• Highest number of AI/AN FTF enrolled at UCs in 10-year period: » Santa Barbara with 53 students (2012)
• Lowest number of AI/AN FTF enrolled at UCs in 10-year period: » Merced with 2 students (2006)
» San Diego with 5 students (2011)
• High/Low numbers of AI/AN FTF enrolled at UCs profiled in 2014 Report: » Davis with 45 students (2010) and 18 students (2005)
» Santa Cruz with 39 students (2010) and 24 students (2005 & 2007) » Los Angeles with 27 students (2011) and 10 students (2004 & 2008) Transfer Admissions of AI/AN at UCs (2002-2012)
• Highest number of AI/AN transfer students at UCs in 10-year period » Davis with 32 students (2013)
• Lowest number of AI/AN transfer students at UCs in 10-year period » Merced with 0 students (2013)
• High/Low number of AI/AN transfer students at UCs profiled in 2014 report » Davis with 32 students (2010) and 10 (2005)
» Santa Cruz with 25 students (2010) and 8 students (2002 & 2005) » Los Angeles with 24 students (2007) and 12 students (2002)
STRUCTURE
&
METHODOLOGY
Part I of the State of AI/AN Education in California 2014 provides an overall review of AI/AN demographics in California and the enrollment rates for AI/AN in postsecondary institutions (PSI). Part II reviews and assesses the growth and decline in AI/AN 10-year enrollment from Fall 2002-2012 at CSU and UC campuses. The data used in Part II was gathered from the California Community Colleges Data Mart, California Department of Education DataQuest, Integrated Postsecondary Education Data System, and California State University Graduation Rates Consortium for Student Retention Data Exchange (CSRDE), the University of California Information Center, and the 2010 Census. The quantitative analysis is provided to create an analytical framework to contextualize the presentation of institutional profiles in Part III. The institutional profiles in Part III have two principle objectives: 1.) To identify models for AI/AN student success throughout institutions of higher education in California and 2.) To share models across institutions. Part IV provides quantitative analysis of data reports for AI/AN PSI enrollment and achievement rates for 2012, including a 10-year overview of CSU and UC AI/AN first-time full-time freshman and transfer student admissions to each system. Part V provides an overview of the AI/AN PSE workforce in the state; Part VI updates data for K-12 achievement, college readiness, and staffing. Part VII outlines promising practices, next steps, and conclusions drawn from the report’s findings.California Three-Tier Postsecondary Education System
Figure
1
PART I
DEMOGRAPHIC
&
ENROLLMENT OF AI/AN IN PSE
California State University System (CSU) University of California Stystem (UC) California Community Colleges (CCC)
8,814 7,430 1,802 1,640 1,630 1,714 0 1,000 2,000 3,000 4,000 5,000 6,000 7,000 8,000 9,000 10,000 California Community Colleges California State University System University of California Campuses CCC 2011 CCC 2012 CSU 2011 CSU 2012 UC 2011 UC 2012
The 2010 Census reported the total population of American Indian/Alaska Native in Cali-fornia as 723, 225. Table 1 above shows a breakout comparison of the AI/AN populations in the US reported alone or in combination with another race. California is second only to Oklahoma as having the highest number of people identifying as American Indian and Alaska Native. Furthermore, California ranks highest for all census respondents who identi-fied as American Indian or Alaska Native alone or in combination with another race with 14%.4
California’s public four-year university sys-tem is a two-part syssys-tem that includes the California State University (CSU) system and the University of California (UC) system. The CSU system has 23 campuses and the UC system has 10. In 2012 these
33 campuses enrolled 3,354 AI/AN students at both the undergraduate and graduate level (see Figure 2). The CSU system is the largest university system in the nation and considers itself the “gateway insti-tution for the great majority of students seeking a baccalaureate education in California, and for those who seek professional training as teachers, nurses, social workers, and engineers.” The University of California is also a publically funded state university system with an emphasis on research. Added to the accessibility and abundance of community colleges in the state, the three-tier system in California en-sures that higher education is available and attain-able for everybody.
The enrollment rates for Fall 2011 to Fall 2012 of AI/AN in postsecondary institutions in Cal-2010 Census AI/AN Populations in US
Table
1
AI/AN Enrollment in Postsecondary Institutions Fall 2011-2012Figure
2
59.9 9.2 6.8 4.2 4.2 13.9 54.1 11.0 10.1 5.8 6.6 12.4 61.8 7.0 6.3 15.8 All other states OK AZ TX NY NM WA CA Note: Percentages will not add to 100.0.American Indian and Alaska Native in combination American Indian and Alaska Native alone
African-American 110,416 (6.98%) AI/AN 7,429 (0.47%) Asian 179,437 (11.34%) Filipino 46,921 (2.97%) Hispanic 612,096 (38.68%) Multi-Ethnicity 51,028 (3.22%) Pacific Islander 7,803 (0.49%) Unknown 86,821 (5.49%) White Non-Hispanic 480,360 (30.36%) Student Enrollments at CCC by Race/ Ethnicity (2012)
Figure
3
ifornia declined consistently at the CSUs between 2011 and 2012. The CCCs also experience a drop in enrollment from 2011-2012; while the UCs continue to chart an overall increase in enrollment each year from Fall 2011 to Fall 2012. The data used to deter-mine overall AI/AN enrollment at the CSUs and UCs includes all AI/AN students from lower, upper, and post-baccalaureate and graduate levels.
The total student population in California Community Colleges for the annual term 2011-2012 was 2,425,290 students and in the annual term 2012-2013 the enrollment dropped to 2,292,158, which is a decrease of 133,132 students from Fall 2011 to Fall 2012 or a 5% reduction rate in total statewide enrollments. Figures 3 and 4 capture the total student count by race/ethnicity and also pro-vides the percent each group represents across the community college statewide system.
In 2013, the CCCs continue to report a decrease in AI/AN enrollment with 6,715 students attending community colleges in the state; and the total number of AI/AN in the CSU further declined in 2013 with a reported overall enrollment of 1,481 students. However, out of the 1,481 total AI/AN students in the CSU’s 1,258 are undergraduates with 217 admitted as first-time full-time freshman. We were unable to determine the total number of new AI/AN enrollment at the UCs for 2013 at the time this report was published because the total enrollment (undergraduate, graduate and
post-bac-calaureate) numbers for fall/winter were not re-leased in time. The UCs reported the following data for California Resident Freshman for Fall 2013: 709 applications, 388 admissions, and 176 AI/AN enroll-ments.
California’s Community College system (CCCs) is the largest education system in the nation consisting of about 2.6 million students at 112 colleges throughout the state. The CCC was es-tablished in 1967 as part of California’s three-tier system of public education along with the California State University system and the University of Cal-ifornia system. The Community Colleges in Califor-nia have the highest enrollment of self-identified American Indian/Alaska Native (AI/AN) of any of the institutions of public higher education in California. High AI/AN enrollment at the community college level is due in large part to the fact that AI/AN high school students qualify to attend the CSU or the UC at a lower rate than any other ethnic group in Cal-ifornia.5 The California Community Colleges offer a
broad range of academic programs for the general student population but there are also programs at various community colleges throughout the state designed to specifically serve the unique education-al and cultureducation-al needs of AI/AN students and com-munities.
The first section of institutional profiles highlights the work being done by three Community Colleges in California. Each of the schools voluntarily participated in interviews to discuss their program development and course offerings for American Indian Students. The approach to American Indian education depends on the campus location and the availability of resources at the school and in the community to create and implement its program. The trend in higher education over the past ten years is to create a community-involved, culturally
relevant, and interdisciplinary approach to American Indian education.
The AI/AN enrollment for the 2012-2013 academic-year at the four participating California Community Colleges included in this report document a slight increase in enrollment for
American River College and decreases in enrollment at Mendocino College, Palomar College and at College of the Redwoods. Despite the decrease in AI/AN enrollment form 2011 to 2012, College of the Redwoods maintains the highest enrollment of AI/AN students with a steady 7.00% of the total student headcount. Table 2 provides a specific look at student enrollments profiled in this report.
African-American 108,949 (6.92%) AI/AN 6,715 (0.43%) Asian 172,823 (10.98%) Filipino 45,982 (2.92%) Hispanic 642,084 (40.80%) Multi-Ethnicity 55,875 (3.55%) Pacific Islander 7,273 (0.46%) Unknown 76,532 (4.86%) White Non-Hispanic 457,518 (29.07%) Student Enrollments at CCC by Race/ Ethnicity (2013)
Figure
4
Profiled CCC 2011-2012 2012-2013 American River 368 373 Mendocino 224 217 Palomar 300 268 Redwoods 589 510 AI/AN Enrollment at Profiled CCCs (2011-2013)Table
2
The CSU campuses highlighted in blue are profiled in this report. At each profiled institution in the ten-year period the highest and lowest number of full-time freshman are in bold type. Notice that after 2008 there is a general decline in enrollment rates at all institutions. The data used to create this table was collected from the California State University Graduation Rates Consortium for Student Retention Data Exchange (CSRDE).
PART II
CSU
&
UC 10-YEAR ENROLLMENT
&
TRANSFER TRENDS
AI/AN First-Time Full-First-Time Freshman at CSU Campuses (2002-2012)
Table
3
2002 2003 2004 2005 2006 2007 2008 2009 2010 2011 2012 CHICO 20 24 25 24 2028
25 229
16 22 EAST BAY 8 4 2 6 2 2 8 3 1 3 25 HUMBOLDT 22 21 11 12 2125
226
16 7 16 MARITIME ACADEMY 1 2 4 1 1 2 1 0 0 1 1 SAN FRANCISO 19 16 22 14 16 23 19 6 6 9 13 SAN JOSE 15 8 10 9 14 18 17 3 1 4 7 SONOMA 9 12 6 7 15 7 21 6 15 5 8 STANISLAUS 7 7 4 7 5 7 7 0 5 1 10 CENTRAL SACRAMENTO 21 17 22 23 34 18 27 12 11 8 13 BAKERSFIELD 8 11 9 8 6 7 11 3 4 4 9 FRESNO 12 16 10 16 23 20 16 13 6 6 15 MONTEREY BAY 4 3 7 6 6 9 6 5 2 3 4SAN LUIS OBISPO 20 19 15 30 25 37 26 13 14 8 7
SOUTHERN CHANNEL ISLANDS 0 3 2 7 3 8 5 3 4 2 4 DOMINGUEZ HILLS 5 0 1 0 2 2 0 3 1 2 4 FULLERTON 16 19 15 15 24 27 27 6 7 10 4 LONG BEACH 21 22 27 27 35 19 26 4 9 4 12 LOS ANGELES 5 3 5 9 7 5 7 2 4 2 4 NORTHRIDGE 23 17 9 13 13 20 14 8 7 7 9 POMONA 12 7 10 7 12 24 15 0 2 7 8 SAN BERNARDINO 4 5 10 11 16 13 14 5 3 5 5 SAN DIEGO 25 20 18 20 25
27 27
8 7 103
SAN MARCOS4
94
7 7 1014
6 64
7 SYSTEM TOTAL 281 265 248 279 332358
355137
140 128 210 NORTHERNAI/AN First-Time Full-First-Time Freshman at UC Campuses (2002-2012)
Table
4
2002 2003 2004 2005 2006 2007 2008 2009 2010 2011 2012
NORTHERN
DAVIS
32
21
30
18
24
41
21
35
45
33
34
BERKELEY
11
14
16
11
17
18
19
19
23
28
25
SANTA CRUZ
28
27
25
24
25
24
31
37
39
32
36
SAN FRANCISCO NA
NA
NA
NA
NA
NA NA
NA
NA NA
NA
MERCED NA
NA
NA
6
2
4
4
11
9
8
9
CENTRAL
SANTA BARBARA
28
24
24
22
38
35
23
46
35
36
53
SOUTHERN
LOS ANGELES
17
13
10
17
13
14
10
23
26
27
21
IRVINE
14
15
11
20
22
9
20
15
22
21
11
RIVERSIDE
10
11
11
8
8
18
19
13
20
10
10
SAN DIEGO
19
14
15
18
22
9
14
10
22
5
8
SYSTEM TOTAL
159
139
142 144 171 172 161 209
241
200 207
When looking at the enrollment data side-by-side of first-time full-time freshman, the CSUs enrolled more AI/AN FTF than the UCs 7 out of the last 10 years. We see a decline in the FTF enrollment at the CSUs from 2008-2011 there is also a large dip in enrollment at the UC between 2010-2012.
281 265 248 279
332 358 355
137 140 128
210
159
139 142
144
171
172 161
209 241 200
207
0
100
200
300
400
500
600
2002 2003 2004 2005 2006 2007 2008 2009 2010 2011 2012
UC
CSU
AI/AN First-Time Full-First-Time Freshman Enrollment Comparison at CSU & UC (2002-2012)Figure
5
Again, the blue hightlights signal profiled institutions. The highest and lowest number of transfer admissions at each campus are in bold. Notice that after 2006 there is a general decline in transfer rates at all institutions. The data used to create these tables was collected from the California State University Graduation Rates Consortium for Student Retention Data Exchange (CSRDE) and data pulled from University of California Information Center on Admissions and Enrollments data tables.
AI/AN Transfer Admissions at CSU Campuses (2002-2012)
Table
5
2002 2003 2004 2005 2006 2007
2008
2009 2010
2011 2012
NORTHERN
CHICO
30
20
22
20
13
21
20
13
11
11
17
EAST BAY
6
3
6
13
15
5
10
7
5
4
3
HUMBOLDT
11
27
19
18
21
14
24
8
7
20
21
MARITIME
1
0
0
1
0
0
0
1
0
0
0
SACRAMENTO
30
25
25
25
35
21
32
11
23
20
25
SAN FRANCISCO
25
57
30
21
13
9
13
14
12
9
8
SAN JOSE
12
7
10
8
17
15
17
8
7
4
9
SONOMA
8
7
7
7
11
10
6
1
5
4
6
STANISLAUS
6
9
9
6
14
11
7
6
5
3
7
CENTRAL
BAKERSFIELD
7
14
7
5
9
14
8
7
9
8
9
FRESNO
16
19
18
17
11
25
23
10
14
8
7
MONTEREY BAY
8
2
3
3
3
4
8
2
4
1
3
SAN LUIS OBISPO
8
8
4
12
4
11
7
4
2
1
1
SOUTHERN
CHANNEL ISLNADS
4
4
2
8
1
7
4
3
4
3
1
DOMINGUEZ HILLS
6
7
9
9
2
2
6
8
6
8
4
FULLERTON
20
20
18
19
18
26
17
17
9
13
10
LONG BEACH
21
22
23
17
21
21
17
7
4
12
12
LOS ANGELES
4
5
10
13
6
9
4
3
9
6
3
NORTHRIDGE
22
10
15
18
18
14
15
6
7
8
5
POMONA
4
5
5
5
5
3
3
4
3
3
6
SAN BERNARDINO
14
15
11
16
11
10
12
7
10
4
3
SAN DIEGO
21
19
31
29
27
21
10
12
6
7
13
SAN MARCOS
7
4
9
9
12
11
8
8
7
2
4
TOTAL
291
309
293
299
287
284
271
167
169
159
177
AI/AN Transfer Admissions at UC Campuses (2002-2012)
Table
6
2002
2003 2004 2005 2006
2007 2008 2009 2010
2011 2012
2013
NORTHERN
Column1Column2Column3Column4Column5Column6Column7Column8Column9Column10
Column11Column12
DAVIS
18
13
19
10
16
25
18
22
28
24
26
32
BERKELEY
19
9
16
12
13
14
15
14
19
17
23
15
SANTA CRUZ
8
18
9
8
11
11
12
13
25
15
19
20
SAN FRANCISCO
NA
NA
NA
NA
NA
NA
NA
NA
NA
NA
NA
MERCED
NA
NA
NA
0
2
2
2
1
2
2
4
0
CENTRAL
SANTA BARBARA
13
7
16
8
9
10
14
28
21
15
14
13
SOUTHERN
LOS ANGELES
12
19
20
19
18
24
17
22
23
20
19
17
IRVINE
8
10
11
5
10
4
14
12
17
16
23
9
RIVERSIDE
9
6
8
5
8
5
6
6
8
8
11
10
SAN DIEGO
8
10
5
9
11
6
7
13
26
18
14
21
ALL CAMPUS TOTAL
95
92
104
76
98
101
105
131
169
135
153
137
The CSU transfer enrollment rate was greater 9 of the 10-year period surveyed and, in 2010, both CSU and UC systems enrolled the same number of transfer students.
291 309 293 299 287 284 271
167 169 159 177
95
92 104 76 98 101
105
131
169
135
153
0
50
100
150
200
250
300
350
400
450
2002 2003 2004 2005 2006 2007 2008 2009 2010 2011 2012
UC
CSU
AI/AN Transfer Enrollment Comparison at CSU & UC (2002-2012)Figure
6
College of the Redwoods
The College of the Redwoods (CR) was formed in January of 1964 and began offering instruction in 1965 at Eureka High School. Located in the North Coast of California the CR serves the counties of Del Norte and Humboldt along with the western portion of Trinity County and the Coastal region of Mendocino County. Relatively isolated from large metropolitan areas, the district serves almost 10,000 squares miles, which is one of the largest service areas of any Community College in California. Due to its large service area the CR has multiple sites that offer instruction which includes the main campus in Eureka, the Eureka Downtown Campus and the Mendocino Coast Education Center in Fort Brag, the Del Norte Education in Crescent City, the Arcata Instructional Site in Arcata, and the Klamath-Trinity Instructional Site on the Hoopa Valley Indian Reservation.
The College of the Redwoods has a long tradition of working closely with the local tribal communities. The CR the Klamath-Trinity
Instructional Site (KTIS) located on the Hoopa Valley Indian Reservation is emblematic of the partnership between the CR and the tribal communities in its service area. With the support of the CR the KTIS was established through an MOU that specifically outlined that the Hoopa could run the stand-alone site. The MOU also set out the guidelines for the site, making sure the college acted responsibly while also recognizing that the site was important to the local tribal community. Jolene Gates is the site manager for the KTIS and explains the importance of the MOU. “The MOU put us in charge of our destiny as far as our student population goes.”6
Often the KTIS is the only option for tribal members who are looking to pursue education because the reservation is very remote and isolated. Important to the KTIS success was the recognition that they needed to hire on site staff. The office has a hired a large number of native staff who interact with the students on a regular basis.
PART III
INSTITUTIONAL PROFILES OF AMERICAN
INDIAN PROGRAMS
&
RESOURCES IN CALIFORNIA
The KTIS operates two federal grants that recruit and specifically serve native students. The Hoopa Career Technical Program (HCTP) focuses on two-year certificates to increase job opportunities and the Hoopa Career Fast Track Program (HCFTP) also offers a certificate but emphasizes transferring to a four year institution. Before writing the grants it became clear that they needed to provide advising and other services on site. The MOU recognized this and gave the KTIS access to the data systems. The data systems are state systems but because of the MOU, and the fact that the positions are partially funded by the state, access was granted. This allows KTIS to access data, enroll students, and fix issues quickly when there are challenges. Prior to this system they had a three to six week turnaround. “It’s incredibly important for our students, for retention. This allows our students to be successful. We are creating an environment for success,” says Kerry Venegas.7
The Hoopa Career and Technical Program offers support services for students that are taking college courses. The HCTP has several smaller programs within the program such as paying for textbooks, retention services, and a stipend program that pays students to go to school. Students can be enrolled in degree programs, certificate programs, or state certification programs. The program itself focuses heavily on retaining students so that they can receive a degree or certificate that will help them to become employable. In order to retain their students, staff work to establish a strong rapport and to learn each students’ strengths and weaknesses. Jolene Gates runs the HCTP and explains that they try and create, “…a real family environment, when they are not feeling motivated and struggling we make sure to try and talk through it.”8
Creating an environment that allows students to be successful is important to the KTIS retention efforts. The advisors for the HCTP develop individual student education plans for each student. Part of each student’s education plan is matching the student’s strengths with particular classes. Every semester they schedule a student’s classes to include classes they may have difficulties with and classes that they may be strong in. The advisors have found that this balance in course work increases a student’s esteem and self-confidence and also encourages learning.
Another important aspect of the HCTP is creating an environment that allows both the students and the advisors to get to know the instructors at the site. Instructors are very open to communicating with students whether it’s talking before class, through email, or even over the phone. The advisors and staff at the KTIS have developed a strong rapport with the faculty to the point where the faculty feels very comfortable talking with them about academic progress, attendance and participation, how dynamic a student is, or even how they developed as a leader in the classroom. Having this relationship between the instructors and the KTIS staff and advisors is critical because sometimes the student’s perspective of their academics is not the same as an instructor’s perspective. Interestingly, Jolene Gates says, “They have found that a lot of time students have difficulty recognizing their own strengths. Many feel they are struggling and putting in a lot of extra effort and time and actually lose track at how they have grown as a student.”9 Understanding this dynamic would
be very difficult without communicating with faculty. Typically KTIS offers 15 to 23 courses a semester. KTIS faculty members are native and non-native. The Hoopa Valley Tribes Education Director, Kerry Venegas, sums it up best by saying, “It is very easy to identify the faculty who are very attached to the community. Despite the long commute student success is at the forefront of what they do. Instructors either buy in or they don’t. To some it is important to be a faculty person out here.”10
In addition to developing a strong
relationship with the students and the instructors, the KTIS creates a family atmosphere with GPA ceremonies, hosts a mid-semester celebration where instructors will nominate a student who is doing well, give out prizes and food, and it is a very public acknowledgement of the hard work and persistence of the continuing student, and they have an honoring ceremony for graduates the night before graduation. At the graduation ceremony there is a dinner for families and graduates to celebrate together. The GPA and graduation ceremonies are part of the KTIS’ effort to build solid relationships.
The Hoopa Career Fast Track Program (HCFTP) has a different type of support service than the HCTEP but retention is also heavily emphasized.
The HCFTP has a staff of two. One position is an academic advisor/retention specialist who is responsible for working closely with the students. The academic advisor/retention specialist does a lot of one-on-one advising, assessing career interests, looking at transferable schools, and also monitoring academic progress on a regular basis. The HCFTP also has a job placement specialist who provides ongoing workshops in resume writing, drafting cover letters, job interviewing, and how to complete a job application.
Contact between advisors and students is important to the success of the HCFTP. Each student has a contact file that has eight tabs divided into specific sections. This allows the advisor to see at any given moment a profile of a student across many different areas. When a student comes in for a contact visit the advisor may focus on support services or notice that there is gap in financial aid or maybe that the student needs a book, or perhaps they need to do screening for disability services. The contacts are a way for the advisors to continue to check academic progress from a variety of perspectives. Students enrolled in the HCFTP are required to meet with their advisor every week. Frequent meetings are important to rapport building and creating a family environment.
The focus of the HCFTP is to address non- traditional students. Most of the students are non-traditional aged, have had limited academic success and issues with high school graduation, and are generally unprepared to go to college. A lot of work is put into coordinating with Temporary Aid for Needy Families (TANF) Program and the tribal rehabilitation program along with the local high school. Whether they are enrolled in either of the programs, high school students can take a three-unit course and get 3 plus 1/3 the amount of credit from their high school. There are two limitations to high school student enrollment: students cannot enroll in any remedial classes or the 300 level courses. If a high school student chooses to enroll in courses at the KTIS, the assessment of the student begins when they enroll.
Matching the student with the appropriate instructor is very important. Limitation to
repeatability of a class has made it more difficult because if a student takes a class three times and is not successful they have to find a different college
COLLEGE OF THE REDWOODS
7351 Tompkins Hill Rd.Eureka, CA 95501-9300 (760) 476-4100 www.redwoods.edu Student Population: 4,827
Student to Faculty Ratio: 17 to 1
STUDENT ENROLLMENT BY ETHNICITY FALL 2012 7% AMERICAN INDIAN/ ALASKA NATIVE 3% Asian 2% Black/African American 13% Hispanic/Latino
1% Native Hawaiian/Pacific Islander 61% White
6% Two or More Races 7% Race/Ethnicity Unknown 0% Non-Resident Alien
RETENTION RATES FOR FIRST-TIME STUDENTS, FALL 2011-FALL 2012
OVERALL GRADUATION RATES BY ETHNICITY*
4% AMERICAN INDIAN/
ALASKAN NATIVE 0% Asian
0% Black/ African American 0% Hispanic/Latino
0% Native Hawaiian/Pacific Islander 9% White
5% Two or More Races 11% Race/Ethnicity Unknown 0% Non-Resident Alien
*Percentage of Full-time, First-time Students Who Began Their Studies in Fall 2010 and Graduated Within 150% of “Normal Time” to Completion for Their Program Source: http://nces.ed.gov/collegenavigator/ 45% 49% 0% 20% 40% 60% 80% 100%
to re-take the class. Re-taking a class is almost impossible because KTIS is isolated. The advisors and the student’s need to get it right the first time in order to ensure success. Kerry Venegas explains, “The advisors reevaluate what they are doing if they do not get it right the first time. Communication is really [the] key to this whole process. We do not allow the students to manipulate us, we hold the students accountable for the outcome.”11 In order
to ensure student accountability the students have to sign an extensive contract to be a participant. By signing the contract, the student agrees to attendance requirements and extensive advising. “A lot of it is about role modeling and creating and leaving a network of resources for them use.”12
Kerry Venegas, sums it up best by
saying “It is very easy to identify
the faculty who are very attached
to the community. Despite the
long commute student success is
at the forefront of what they do.
Instructors either buy in or they
don’t. To some it is important to
be a faculty person out here.”
American River College
American River College (ARC) opened its doors for instruction in 1955 and became part of the Los Rios Community College District in Sacramento County in 1965. The campus is located in the City of Sacramento and has one of the largest student populations of any Community College in California with 32,715 students reported in 2012. ARC has a Native American Resource Center (NARC) that “Provides a variety of support services for students who identify themselves as Native American or American Indian.”13
The Native American Resource Center is seven years old and started out as a small faculty space that was established with grants. The NARC came into being when English Professor Jesus Valle moved his office to the classroom level away from the faculty offices and hung a sign on his door that read Native American Resource Center. Professor Valle hired an assistant to be in his office when he was occupied by other campus responsibilities; together they began to see students and other clients. Soon the NARC wrote and received a grant to take out a wall to annex a room located next door. Over the years as the demand for space increased the NARC slowly expanded to nine
hundred square feet. Professor Valle’s office is located in the center and he hires students through the financial aid work-study program.
Due to its location in a big city like Sacramento, students from the local American Indian Communities and from reservation
communities from Central and Northern California and Western Nevada utilize the NARC. Professor Valle explained, “We have students from Hoopa, Yurok, Karuk, and the rural Paiute population from Nevada. The center is here for students to see other people like them, to socialize, and to get away from the non-Indian environment. On a good day we get thirty to forty students coming through the center.”14
The NARC offers a wide variety of support services for AI/AN students. They have tutors to assist students with their schoolwork and any academic difficulties they may be experiencing. The NARC also hosts cultural events such as water drumming lessons, jingle dress workshops, beading workshops, community potlucks, and local Rancheria youth events. The NARC students serve as ambassadors working alongside local tribal members during these events. Students also
actively participate in tepee meetings, sweats, and powwow dancing. The NARC also offers referrals to support students recovering from substance abuse. Overall the NARC is a space where students can study and socialize. It has a coffee maker, microwave, fridge, a community calendar, a small lending library and other things the students may need. The NARC has created strong networks and partnerships with other institutions of higher education including Sacramento State and UC Davis. The students from the NARC relate on a peer-to-peer basis with the students from Sacramento State and UC Davis. Much of this work is done by two clubs: the Native American Student Alliance, which is about ten years old; and the Native American Brothers and Sisters which has been around for about 6 years.
The NARC also partners with the local American Indian communities. They have a joint scholarship program with the United Auburn Indian Community. Professor Valle approached them years ago asking for support and the United Auburn Indian Community created a scholarship program of about $2,500 to award to students that apply. The scholarships are then given out to students at a banquet. The NARC also hosts meetings for the California Rural Indian Health Board, Native TANF, and the Native American Health Center in downtown.
The ARC does not currently have courses in Native American Studies but has a blueprint for a curriculum in place. What remains to be done is to actually write the curriculum and then have the faculty to offer the courses. In early stages of development, they conducted a pilot project that was curricular focused. Through the pilot project they found that switching to a center of support was a better approach. Professor Valle explained that through, “The curricular route people tended to drop in and drop out and if they dropped out we had a hard time tracking them down and keeping them looped into something.”15
AMERICAN RIVER COLLEGE
4700 College Oak Drive Sacramento, CA 95841-4286(916) 484-8011 www.arc.losrios.edu Student Population: 31,088
Student to Faculty Ratio: 28 to 1
STUDENT ENROLLMENT BY ETHNICITY FALL 2012 1% AMERICAN INDIAN/ ALASKA NATIVE 11% Asian 10% Black/African American 18% Hispanic/Latino
1% Native Hawaiian/Pacific Islander 47% White
6% Two or More Races 6% Race/Ethnicity Unknown 1% Non-Resident Alien
RETENTION RATES FOR FIRST-TIME STUDENTS, FALL 2011-FALL 2012
OVERALL GRADUATION RATES BY ETHNICITY*
0% AMERICAN INDIAN/
ALASKAN NATIVE 43% Asian
12% Black/ African American 22% Hispanic/Latino
20% Native Hawaiian/Pacific Islander 28% White
31% Two or More Races 23% Race/Ethnicity Unknown 21% Non-Resident Alien
*Percentage of Full-time, First-time Students Who Began Their Studies in Fall 2010 and Graduated Within 150% of “Normal Time” to Completion for Their Program Source: http://nces.ed.gov/collegenavigator/ 70% 45% 0% 20% 40% 60% 80% 100%
Full time students Part time students
“American River College provides
a variety of support services for
students who identify themselves
as Native American or American
Indian.”
Mendocino College
Mendocino College (MC) was founded in 1973 and serves both Mendocino and Lake Counties. The main campus is located in Ukiah, California and there are two satellite centers in Lakeport and Willits. MC is one of the smaller Community Colleges in California with a Fall 2012 student enrollment of 3,790. MC also partners with Sonoma State University to offer courses at the Ukiah campus for the postsecondary educational needs off the local communities.
Within the Mendocino College service region there are 17 tribes. The furthest tribal community is about a two-hour drive north of campus with the closest being located across the street. MC has a history of working with the local Native communities. One such example is the Native Advisory Committee, which was established in the early 1990’s to address concerns and questions regarding the quality and service of education for Native students. The Committee also works to help the college plan Native American events on campus. Committee members are both native and non-native with many members being from the reservation education centers. Darletta Fulwider, a local tribal member, works in
the counseling department at MC and is also the American Indian Alliance Advisor. She says that, “The Native Advisory Committee works to better serve the tribal communities. We are currently working on a child development course that will be taught at one of the tribal communities because child development courses are needed and wanted.”16
When a course from MC is brought out to a reservation they are usually taught at a reservation education center.
A significant part of MC efforts to work with and for the Native communities was hiring a counselor who along with general counseling responsibilities is also responsible for doing outreach work with tribal communities. A major function of the outreach work is to have an active presence in the community. The outreach counselor often visits local tribes and local high schools to tell them about the importance of school and college. These presentations are broken up by grade level. The 9th and 10th grade
presentation tends to focus more on trying to motivate the students and engrain the value of education. The 11th and 12th grade presentation
is more in depth with discussions about financial
aid and encouragement for all the students to sign up for the community college in case the four-year institution does not work out. They also discuss with the high school students what it takes to be a community college student and also what it takes to be a university student because there is a difference.
Another important component of student success is the early alert program for students who may be struggling in a class. This program encourages communication between professors and the Native Outreach coordinator when a native student may be struggling in a class. After a struggling student is identified the professor and the Native outreach coordinator meet to discuss possible solutions to ensure that the student gets back on track. Mendocino College offers a summer bridge program for local Native students. In the past the summer bridge program has had a remedial English component along with a college success course.
The campus also holds a Native American motivation day that focuses on 6th to 12th grade
students. On Native American Motivation day they bring the Native students to an open house and have a ceremony. They also bring in representatives from local universities, they have break out panels where native leaders lead topical discussions, career information and financial aid information. To sum up Mendocino College’s outreach efforts for AI/AN students, the outreach counselor, Guillermo Garcia explains, “The programs at Mendocino College focus heavily on two components, getting Native youth interested in college and getting them transferred to a 4-year university.” 17
“The programs at Mendocino
College focus heavily on two
components, getting Native
youth interested in college and
getting them transferred to a
4-year university.”
MENDOCINO COLLEGE
1000 Hensley Creek RoadUkiah, CA 95842 (707) 468-3235 www.mendocino.edu Student Population: 3,788
Student to Faculty Ratio: 17 to 1
STUDENT ENROLLMENT BY ETHNICITY FALL 2012 4% AMERICAN INDIAN/ ALASKA NATIVE 3% Asian 2% Black/African American 25% Hispanic/Latino
0% Native Hawaiian/Pacific Islander 62% White
3% Two or More Races 1% Race/Ethnicity Unknown 0% Non-Resident Alien
RETENTION RATES FOR FIRST-TIME STUDENTS, FALL 2011-FALL 2012
OVERALL GRADUATION RATES BY ETHNICITY* 25% AMERICAN INDIAN/
ALASKAN NATIVE 0% Asian
10% Black/ African American 28% Hispanic/Latino
0% Native Hawaiian/Pacific Islander 20% White
9% Two or More Races 14% Race/Ethnicity Unknown
*Percentage of Full-time, First-time Students Who Began Their Studies in Fall 2010 and Graduated Within 150% of “Normal Time” to Completion for Their Program Source: http://nces.ed.gov/collegenavigator/ 64% 42% 0% 20% 40% 60% 80% 100%
Palomar College
Formed in the late 1960s as a result of local American Indian demands for an academic program that supported tribal needs, the American Indian Studies program at Palomar College has been in existence for over 40 years. Palomar has responded to and filled the needs of the local American Indians in its service area from its inception. Community partnerships and programs range from offering satellite courses at the Pauma Indian Education Center on the Pauma Indian Reservation to more recently implementing and offering cultural monitoring courses and certificates used for land development and planning on or near Indian reservations.
Palomar offers 36 courses that incorporate various disciplines such as American Indian Studies, history, art, music, language, anthropology, science, literature, political science, archaeology, sociology, and interdisciplinary studies. Many of these courses are cross-listed with other programs and disciplines at Palomar. The majority of these classes fulfill the college’s diversity requirement.
Palomar offers a 21-unit certificate in American Indian Studies to help make transferring to a four-year institution a seamless pathway; however, these relationships are not formalized.
Because Palomar is a two-year community college and a commuter–school, student interaction on an ongoing and consistent basis is minimized. In spite of this fact, the American Indian Studies (AIS) department has a designated meeting room for students to gather and hold social gatherings, and the college regularly offers up larger meeting facilities as needed.
AIS classes have been offered through distance learning for the past ten years. Professor Patti Dixon, Chair of AIS, explains: “it is extensively integrated into the class schedule, college
homepage, and student experience. Some courses only succeed through distance learning. We have discovered most of the American Indian students prefer face-to-face classes, but enjoy [the] use of technology as well.”
Palomar has a long tradition of adapting its curriculum to fit the needs of its AI/AN students and communities. Much of its success is due to the fact that the program originated from student activism, its practice in hiring local California Indian educators, and its commitment to forging pathways to education both from the tribal community and across the campus.
PALOMAR COLLEGE
1140 W. Mission San Marcos, CA 92069-1487 (760) 744-1150 www.palomar.edu Student Population: 24,626 Student to Faculty Ratio: 28 to 1STUDENT ENROLLMENT BY ETHNICITY FALL 2012 1% AMERICAN INDIAN/ ALASKA NATIVE 7% Asian 3% Black/African American 35% Hispanic/Latino
1% Native Hawaiian/Pacific Islander 46% White
4% Two or More Races 3% Race/Ethnicity Unknown 1% Non-Resident Alien
RETENTION RATES FOR FIRST-TIME STUDENTS, FALL 2011-FALL 2012
OVERALL GRADUATION RATES BY ETHNICITY* 38% AMERICAN INDIAN/
ALASKAN NATIVE 43% Asian
15% Black/ African American 19% Hispanic/Latino
25% Native Hawaiian/Pacific Islander 27% White
27% Two or More Races 18% Race/Ethnicity Unknown 64% Non-Resident Alien
*Percentage of Full-time, First-time Students Who Began Their Studies in Fall 2010 and Graduated Within 150% of “Normal Time” to Completion for Their Program Source: http://nces.ed.gov/collegenavigator/ 72% 45% 0% 20% 40% 60% 80% 100%
Full-time students Part time students
Palomar College has responded
to and filled the needs of the
local American Indians in its
service area from its inception.
San Diego State University
San Diego State University was founded in 1897 as the San Diego Normal School with the purpose of training elementary school teachers. In 1921 the school changed its name to the San Diego Teachers College becoming a four-year public institution controlled by California’s Board of Education. As the campus continued to grow, SDSU became part of the California State College system in 1960. San Diego State University became the official name in 1970.
SDSU has had an American Indian Studies Department for over 35 years. Currently the AIS Program has four full-time and three part-time faculty members. The university offers a substantial and diverse amount of coursework that covers the scope of American Indian Studies. The Department offers eighteen courses, three of which are lower division courses and the remaining fifteen are upper division courses. Two of the lower division courses, U.S. History from an American Indian Perspective to 1870 and U.S History from an American Indian Perspective Since 1870 fulfill the state’s American Institutions requirement if the student passes both courses.18 These two courses
usually have large enrollments and offer all students
the opportunity to engage with material outside of traditional disciplines such as work in history and political science.19
About four years ago the department became one of only two CSU’s to offer students the opportunity to major in American Indian Studies. In order to major in American Indian Studies students must complete 30 units within the discipline. American Indian Studies at SDSU is interdisciplinary with faculty from history, linguistics and anthropology to name a few. The breadth of faculty expertise and the interdisciplinary approach is a strength and value to AIS students.
Professor of American Indian Studies, Margret Field states,” students get to know all of the different ways and different perspectives to view the various issues in Indian Country.”20 Since they
started the major in American Indian Studies the department has seen about 10 to 15 students over the last couple of years major in American Indian Studies. Because the coursework is extensive, SDSU prides itself as a research university.
SDSU is home to the Sycuan Institute on Tribal Gaming (SITG).21 The SITG is run by the
Hospitality and Tourism Management Program at SDSU and was established in 2005. The program is supported by an endowment from the Sycuan Band of Kumeyaay Indians. The SITG research wing works to produce reports on tribal gaming that are relevant and timely. Research topics of interest include regulatory and legal issues, policy and political issues, economic development, tribal culture, and economic factors in surrounding communities. The course offerings at the SITG cover a wide range of topics that relate to the rapidly growing and ever-changing field of tribal gaming. While most of the courses are taught through the Hospitality and Tourism Management Program, one course, Tribal Gaming: Cultural and Political Context is cross-listed with American Indian Studies.
Professor of American Indian
Studies, Margret Field states,
”Students get to know all of the
different ways and different
perspectives to view the various
issues in Indian Country.”
SAN DIEGO STATE UNIVERSITY
5500 Campanile DriveSan Diego, CA 92182 (619) 594-5200
www.sdsu.edu Student Population: 34,000 Student to Faculty Ratio: 20 to 1
STUDENT ENROLLMENT BY ETHNICITY FALL 2012 0.5% AMERICAN INDIAN/ ALASKA NATIVE 14% Asian 4% Black/African American 29% Hispanic/Latino
0.3% Native Hawaiian/Pacific Islander 38% White
5% Two or More Races 5% Race/Ethnicity Unknown 4% Non-Resident Alien
RETENTION RATES FOR FIRST-TIME STUDENTS, FALL 2011-FALL 2012
OVERALL GRADUATION RATES BY ETHNICITY* 70% AMERICAN INDIAN/
ALASKAN NATIVE 67% Asian
63% Black/ African American 60% Hispanic/Latino
59% Native Hawaiian/Pacific Islander 68% White
71% Race/Ethnicity Unknown 54% Non-Resident Alien
*Percentage of Full-time, First-time Students Who Began Their Studies in Fall 2010 and Graduated Within 150% of “Normal Time” to Completion for Their Program Source: http://nces.ed.gov/collegenavigator/ 89% 81% 0% 20% 40% 60% 80% 100%