Journal of Physics: Conference Series
PAPER • OPEN ACCESS
Development a new costing structure for palm oil industry using time
driven activity based costing
To cite this article: S N A M Zaini and M Y Abu 2020 J. Phys.: Conf. Ser. 1529 052034
View the article online for updates and enhancements.
JICETS 2019
Journal of Physics: Conference Series 1529 (2020) 052034
IOP Publishing doi:10.1088/1742-6596/1529/5/052034
Development a new costing structure for palm oil industry
using time driven activity based costing
S N A M Zaini1 and M Y Abu1 1
Faculty of Manufacturing and Mechatronic Engineering Technology, Universiti Malaysia Pahang, 26600, Malaysia
Abstract. Palm oil is one of the agricultural commodities most marketable in the world. The Malaysian palm oil industry is undoubtedly the pride of the country. There are few problems in this plantation at present, which do not represent a time frame to measure operations deviation, a rate establishment did not properly explain the connection between supplied assets and functional capacity and a method for tracking unused capacity was not available to the manager. This work aims at developing a new costing model specifically for ramp areas for improved precision. Time-driven activity-based costing (TDABC) is introduced because it can measure time output effectively, correctly identify idle energy and separately list the unused capacity. Costing based on time activity has been implemented. It also offers a better understanding of operating instruments and associated costs when assessing processes and promoting improvements in quality. There are three main divisions in the plantation in Pahang. The maximum utilized ramp capacity and the level of capacity cost rate (CCR) were successfully established with 4800 minutes and 1.00 RM / minute respectively. Finally, the manager finds the unused capability that can be used to improve ramp-resource management on a regular basis. However, the unused capacity created in ramp activities is not present in this case study.
1.Introduction
Malaysia's palm oil industry performed poorly in 2018 compared to 2017. Fresh fruit yields, production of crude palm oil, and exports of palm oil decreased as palm oil importations grew, while palm oil stocks closed. Higher transportation stocks and increased imports of palm oil, and lower exports, as of the end of December 2018, have pushed palm oils up to more than 3 million tons. The adoption of technology can be noted in all areas of research, driving clear improvement in agriculture and processes, while also ensuring sustainable industry growth [1]. It occurred probably due to a lack of economic knowledge due to an unsuitable costing system. Until the 1980s, conventional standard cost models were less common, because the direct work content of goods decreased. Applying the conventional method on a particular issue, including specific working hours, is less detailed and clearly no longer a function of economic reality. Assume costs of the activities carried out to develop a better cost structure, and then orders, products and customers. The costing methodology proposed by Cooper (ABC) is the activity-based costing methodology. Kaplan assumes that multiple products have the same activities, requiring resources of different dimensions [2]. In general, if consisting of a portion of events or practices based on people in a single center [3], it offers a more accurate estimate of the costs of product or service. It also involves modelling and defining value added operations, evaluating the cost structure for these activities and making use of the cost factors that are identified [4]. This approach is precise process mapping particularly to analyze the company's business processes and is very relevant to applications where the largest portion of the cost is spent on skilled workers [5].
JICETS 2019
Journal of Physics: Conference Series 1529 (2020) 052034
IOP Publishing doi:10.1088/1742-6596/1529/5/052034
2
driver-based methodology, implementation is slow and difficult to regularly update [6]. TDABC, however, is a revised ABC that, through the cost of energy, explicitly assigns the costs of assets from function items. This converts cost drivers into time formulas that reflect time required to conduct a defined operation [7]. The main principles of this approach are The method has shown few advantages for the applications concerned. [8] had speculated the potential for a reduction in costs that would not jeopardize patient outcomes through recognizing the causes of costs variability. [9], [10] and [11] successfully applied TDABC in electric and electronic industry which revealed the greatness of time equation and capacity cost rate. [12] confirmed that TDABC could help managers to focus on value addition activities and limit non-value adding activities, something that is very important in all businesses in the acceptance of protocol deviations and enhanced decision-making power. [13] have agreed that the TDABC method can assist decision makers in obtaining the best product mix configuration.
2.Literature review
From 2010 to 2018, a sample was made of 56 published papers on TDABC usage. The TDABC as its cost accounting framework is used in three key sectors: health care (66%), industrial (23%) and library (11%). It has been shown that no work is done on the basis of a previous research survey on TDABC system in plantation. The strengths of the TDABC were divided into supporting the improvement of operating activities, informing reimbursement policies, accurately capturing the cost, managing the complexity inherent, more efficient and simpler than traditional ABC, according to [14]. This study thus exploited the elements to further reassure the research difference in 2010-2018. In terms of TDABC applications, the element of accurate cost capture has the highest percentage with 39%. Subsequently, the operational improvements of support is 26%, manage the inherent intricacy is 22%, 9% for more efficient and finally inform reimbursement policy and simple than the traditional ABC shared the same value which is 2%. This work focused on the more efficient part, because the present plantation really needs a new cost structure with specific costs. [15] analyzed several essential tasks and gained exposure to all relevant TDABC elements such as system mapping. The research focuses exclusively on commercial facilities. Besides this, industrial service studies [16] have only been conducted with two components which are the cost of capacity and time equation. [17], [18] and [19] focused on process mapping, capacity cost rates and time equations at medical care. Additionally, the research of [20] used TDABC in library system but did so in the same way. [21] used only the value of resources to find true costs in the area of bibliography. Simply put, this aggregate study discrepancy is focused on legit research findings and was designed to conform with current data. Through the method charts, the resource cost levels and time calculations, this study has analyzed the power of TDABC in order to develop a new plantation costing system.
3.Methodology
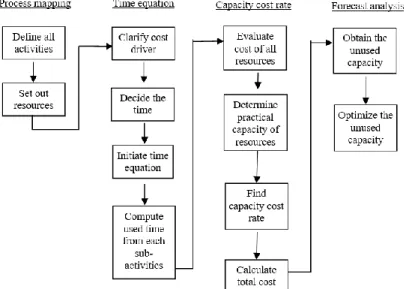
The case study on palm oil plantation in Muadzam Shah, Pahang was carried out in this research. The plan comprises of three major divisions and this research is based on Simpai Division 1. Division 1 was subsequently classified into three main areas, mature (1545.2 acre), immature (1091 acre) and replanting (449 acre). In the mature area all of the plants were planted since 1990 and 1991, in 2015 and 2016 for the immature area and in 2017 the youngest plants were replanted. Many activities and sub-activities are carried out starting from receiving the ordered seeds to harvesting and end with transportation of fresh fruits to the factory for production of crude palm oil. There are three principal centers of activity from which all data and information has been collected. It began with the nursery, then the field was replanted and finally ended with the ramp. Since this work deals with costing growth, it is very necessary to collect data for all activities. The amounts for ramp operations in conjunction with certain events for the period January to July 2018 are shown in Table 1. This is very important in determining the value of the supplied manpower. The new costing structure shown in Figure 1 contains 4 important elements of TDABC, with specifically dozen steps. The flow is broken down into process mapping, time equation development, capacity cost rate and forecast analysis.
JICETS 2019
Journal of Physics: Conference Series 1529 (2020) 052034
IOP Publishing doi:10.1088/1742-6596/1529/5/052034
Figure 1. Flowchart of TDABC implementation
The process mapping identified and detailed all possible resources and activities in relation to the production of palm oil, particularly in Simpai division 1. Then a time formula is created, which is directly proportional to the value of the activities by defining the cost operator. CCR are established through an estimation of the total capacities provided and the practical capacities currently utilized in production. Ultimately, the prediction is rendered by calculating unused capacity as a foundation for efficiency in terms of time and cost.
4.Result and discussion
This is very important for all the activities which influence the final cost. The analysis was split into three centers for a good grouping. The activity centre 1 focuses on nursery while activity center 2 focuses on replanting. The center 3 for activity centering on ramping involves one activity that ramps up in one sub-activity. Such work shows that the division of mapping into three centers essentially reduces waste in movement as centers 1 and 2 are quite far apart, which ensures that the design of the time formula does not take into account wasteful operation. This work focuses only on ramp for the development of a new costing structure in order to reduce the complexity with better understanding. Ramp activity began with a grading bunch of fresh fruit (FFB). The FFB is classified in the quality when the FFB arrives from the estate. If too much FFB with poor quality including unripe, orange, long stalk and a vacuum bunch of fruit, the grading record is the aspect of any changes. The FFB will weigh to obtain the full load weight. The FFB will then be moved from the ramp to the milling centre. With this mapping of processes, this work identified a large number of resources that were needed to cover materials, expansions, maintenance and workforce costs. The time equation is used to incorporate all the necessary time to perform all sub-activities within a single equation in each activity centre. To develop this, it is crucial to consider the time for major activities, the time for further sub-activities and its driver. To measure the estimated time used, a time formula must be created. The estimated time was based on the principles of motion and time studies for each activity. For an example, an average duration of about 15 minutes was taken for moving collected fruit from the collecting point to the ramp. Table 1 for the ramp describes every parameter in this time formula.
Table 1. Time taken for the ramp
No. Sub-Activities Minute/round
1. Grading 240
2. Weighing 240
JICETS 2019
Journal of Physics: Conference Series 1529 (2020) 052034
IOP Publishing doi:10.1088/1742-6596/1529/5/052034
4
In each operation, the total time taken is 240 minutes. The time operator relies on the features of its operation, which must be compounded by the time function or not. The time equation for each sub-activity needs to be identified (min / month) in this study. By quantifying the intensity of events during one month, the average manpower needed for each operation was assessed. Once measured by the period a given task was performed, the overall time spent on the event could be determined. The volumes of cost-drivers for the activity centers are summarized in Table 2.
Table 2. Volume of cost-drivers for ramp
Var. Driver Quantity/month
X1 Grading (rounds) 20
X2 Weighing (rounds) 20
X3 External transport (ramp to mill) (rounds) 20
The scope takes 20 trips to cover the entire 400.83 acres FFB gathered (1 hectare = 1 ton), two cycles within a month for ramping, loading, weighting and internal transportations. For each trip, the trailer trucks used can hold 40 tons. Table 1 was then multiplied by the relevant variables in Table 2 or cost-drivers to develop a complete time equation for ramp as shown in Equation (1).
Tramp = 240X1 + 240X2 + 240X3 (1)
Table 3 shows on how to get the actual used capacity for each sub-activities in all activity centers by multiplying the value of quantity or round needed for each sub-activities per month with total time taken for every round.
Table 3. Total used time for sub-activities of the ramp
Var. Driver Quantity/month Minute/round Used capacity
(min/month)
X1 Grading (rounds) 20 240 4800
X2 Weighing (rounds) 20 240 4800
X3 External transport (ramp to mill) (rounds)
20 240 4800
TOTAL: 14400
The total used capacity for ramp is 14400. The actual time spent (used capacity) on this activity center per month was 14400 minutes. If the services used are all provided by the same company, expenses can be directly applied to that business. Nonetheless, an allocation approach focused on the correct cost-driver should be used when services are used for multiple operations. This analysis separates researchers into (i) labor cost, and (ii) the value of the equipment, machinery and other facilities on the basis of the kinds of services used for each operation. All plantation workers should receive a basic salary of RM1300 with the exception of nursery, ramp, harvesting and FFB transport. Estimated costs of all the resources used in each of the sub-activities described above are summarized in Table 4.
Table 4. Labor, equipment, machinery and other equipment costs within the ramp
No Sub-Activities Labor costs Overheads Cost of all
resources supplied
1. Grading 4809.96 - 4809.96
2. Weighing 4809.96 - 4809.96
3. External transportation (ramp to mill) 4809.96 20843.16 25653.12
JICETS 2019
Journal of Physics: Conference Series 1529 (2020) 052034
IOP Publishing doi:10.1088/1742-6596/1529/5/052034
Both grading and weighing of fruit have same labor cost and overhead cost which resulting in same total cost of resources supplied. Labor cost in external transportation is same to the other, RM4809.96 but different in overhead cost. The total cost of resources supplied in this activity center is RM35273.04. Capacity reflects current practice as to the resources available to perform this specific activity. Working hours are Monday through Saturday, from 8 a.m. to 6 p.m. and on Sunday, 8 a.m. to 1 p.m. The staff work from Monday through Saturday for an average of eight hours a day (26 days a month) and Sunday for five hours a day (4 days in a month). Breaks, training and maintenance are not deducted from these time periods, which means that employees have an acceptable capacity of 13.680 minutes each month. Table 5 shows the summary of CCR for each activity for ramp.
Table 5. CCR of each sub-activity for the ramp
No. Sub-Activities
Cost of all resources supplied (RM/month)
Practical capacity
(min/month) Capacity cost rate (RM/min)
1. Grading 4809.96 4800 1.00
2. Weighing 4809.96 4800 1.00
3. External transport (ramp to mill)
25653.12 4800 5.34
TOTAL: 35273.04 14400
From Table 5, the CCR in all sub-activities in activity center 3, ramp are 1.00, 1.00 and 5.34 respectively. By having this rate as reference, the unused capacity can be measured directly. The resource planning system splits into three stages to assess the specifications of the service level and evaluate current capacity and the expected outlook. Three stages exist in this first step: workloads are established, work unit is established and service levels are established. The current production plan is then analyzed in order to assess the capacity to evaluate increasing task or process in its entirety. The prediction plan is the final step in understanding the amount of incoming work that is expected during the next lots. The researcher has thus proposed ways of reducing costs on the basis of the capacity utilization analysis, with a view to increasing production capacity and reducing cost of waste as shown in Table 6.
Table 6. Analysis of capacity utilization in the palm oil plantation activity centre
Activities Practical capacity (min/month) Used capacity (min) Unused capacity (min) Capacity cost rate (RM/min) Waste Cost (RM) Utilization cost (RM) Grading 4800 4800 - 1.00 - 4800 Weighing 4800 4800 - 1.00 - 4800 External
transport (ramp to mill)
4800 4800 - 5.34 - 25632
Total: 14400 14400 - - 35232
The used capacity will affect utilization costs and the unused capacity would add to excess costs. The rates of utilization and waste cost calculations vary accordingly, every business center has different CCR. Furthermore, only activity center 3 does not resulting any unused capacity and waste cost. This is because the sub-activities in ramp which are grading, weighing and external transportation of FFB to mill are fully following standardized schedule. The factors that may have an impact to this are only when the number of FFB is decreasing or increasing from the general amount collected every cycle. It associates with the number of trips for each sub-activity, which have a major basis for the resources costs and practical capacity. This study found that TDABC was able to identify total costs in keeping with the actual use of planting industry resources. The value of each operation was shown to vary because the prices of capital and energy are impacted by various factors. It takes more time to perform complex operation and those with more phases tend to grow faster. The results
JICETS 2019
Journal of Physics: Conference Series 1529 (2020) 052034
IOP Publishing doi:10.1088/1742-6596/1529/5/052034
6
costs and work efficiency. The study outlined the value-adding practices and events and the challenges in the plantation method. Resource use can be minimized by improving efficiency, especially by optimizing realistic capabilities.
5.Conclusion
Through the system illustrates for the palm oil plantation ramp, the time equation was successfully developed. All centers of operation are shown that the benefits are directly proportional to them. So, the time formula developed as a Tramp = 240X1 + 240X2 + 240X3 was 14,400 minutes. Therefore, the CCR is 1.00 RM / minute for this operation. Time equation and CCR can be used to evaluate the unused ability of the manager. The administrator can reduce resources to better save from the idle manpower cost of 37515.31 minutes. So, based on analysis of the capacity utilization, the administrator has an apparent viewpoint on increasing manufacturing costs in order to maximize operational efficiency and lower waste costs.
Acknowledgments
This research is fully supported by RDU1903105. The authors fully acknowledge University Malaysia Pahang for the approved fund which makes this important research viable and effective.
References
[1] Kushairi A, Abdullah MO-, Nambiappan B, Hishamuddin E, Bidin MNIZ, Ghazali R, Subramaniam V, Sundram S and Parveez GKA 2019 Journal of Oil Palm Research31 (2):165-94
[2] Cooper R and Kaplan RS 1991 Harv Bus Rev69(3):130-35
[3] Abu MY, Jamaludin KR and Zakaria MA 2017 International Journal of Automotive and Mechanical Engineering14(2):4211-24
[4] Kamil NNNM and Abu MY 2018 Journal of Modern Manufacturing Systems and Technology
1:39-51
[5] Abu MY, Nor EEM and Rahman MSA 2018 IOP Conference Series: Materials Science and Engineering342:1-10
[6] Zheng CW and Abu MY 2019 Journal of Modern Manufacturing Systems and Technology2
:1-14
[7] Zaini SNAM and Abu MY 2019 Journal of Modern Manufacturing Systems and Technology 2:15-22
[8] Erhun F, Mistry B, Platchek T, Milstein A, Narayanan VG and Kaplan RS 2015 BMJ Open 5(8):e008765
[9] Zamrud NF, Abu MY, Nik Mohd Kamil NN and Safeiee FLM 2020 Proc., of the Int., Manufacturing Engineering Conf., & The Asia Pacific Conf., on Manufacturing Systems 81-87 [10] Nik Mohd Kamil NN, Abu MY, Zamrud NF and Safeiee FLM 2020 Proc., of the Int.,
Manufacturing Engineering Conf., & The Asia Pacific Conf., on Manufacturing Systems 74-80 [11] Mohd Safeiee FL, Abu MY, Nik Mohd Kamil NN and Zamrud NF 2020 Proc., of the Int.,
Manufacturing Engineering Conf., & The Asia Pacific Conf., on Manufacturing Systems 88-95 [12] Ridderstrale, M 2017 J Diabetes Sci Technol11(4):759-65
[13] Tsai WH, Chang JC, Hsieh CL, Tsaur and Wang CW 2016 Sustainability8(12):1-22 [14] Keel G, Savage C, Rafiq M and Mazzocato P 2017 Health Policy121(7):755-63
[15] Wouters M and Stecher J 2017 International Journal of Production Economics183:235-44 [16] Sarokolaei MA, Saviz M, Moradloo MF and Dahaj NS 2013 Procedia - Social and Behavioral
Sciences75:338-45
[17] Anzai Y, Heilbrun ME, Haas D, Boi L, Moshre K, Minoshima S and Lee VS 2017 Acad Radiol 24(2):200-8
[18] Yu YR, Abbas PI, Smith CM, Carberry KE, Ren H, Patel B and Lopez ME 2017 J Pediatr Surg 52(6):1045-49
JICETS 2019
Journal of Physics: Conference Series 1529 (2020) 052034
IOP Publishing doi:10.1088/1742-6596/1529/5/052034
[19] Yun BJ, Prabhakar AM, Warsh J, Kaplan R, Brennan J, Dempsey KE and Raja AS 2016 Ann Emerg Med67(6):765-72
[20] Kont KR 2015a Collection Building34(2):41-50