DBLint: A Tool for Automated Analysis of
Database Design
Benjamin Krogh, Andreas Weisberg, Morten Bested
January 7, 2011
Abstract
Evaluating the quality of a database schema by manual review is time-consuming, error-prone and requires a good overview. To accommodate these problems, we propose DBLint, a tool for automated analysis of database design. DBLintincludes 25 design rules which encapsulate good database design practices. The architecture inDBLint is highly extensi-ble in that new rules can be added easily. This paper presents a num-ber of novel components necessary to create a thorough analysis of a schema design. This includes the use of PageRank to find central tables, a visualization component providing a comprehensible overview of the schema, and automatic discovering and checking of naming conventions. Furthermore, DBLint provides a score which summarizes the quality of the schema. DBLinthas been implemented and evaluated on a large set of widely used database schemas, and a great number of design issues were identified. An evaluation of issues verified that the 25 implemented rules identify relevant issues. DBLintwas tested by two database design teams that responded with positive feedback and suggestions to the tool.
1
Introduction
Maintaining the quality of an evolving database schema is a difficult challenge. If the schema is maintained by different persons, and there are no clear agreements on design principles, the quality of the schema design may degenerate over time. Possible issues that arise through development are inconsistent use of data types, foreign keys and naming conventions. As the schema grows, the process of ensuring quality by manual review becomes both time-consuming and error-prone.
In this work we develop a static analyzer for database designs. The main purpose is to contribute to consistent and maintainable database designs by identifying patterns of bad database practices. These patterns are expressed as
rules in theDBLinttool. These rules are then used to analyze the input schema,
and the tool outputs a list of design issues.
We envision DBLintto be used in development, such that developers catch
common design issues before applying them to the Version Control System
(VCS), e.g. as part of the test suite in Test Driven Development (TDD).DBLint
can be used by developers with high domain knowledge to control the quality of changes made to a database, by verifying that the changes follow their
to fast and easily gain knowledge about the existing system, and verify changes made to the database before committing to the VCS.
The main philosophies in DBLint are that it should be close to zero
con-figuration, employ domain-independent rules and be extensible. The minimal
configuration overhead is a benefit as it reduces the cost of using DBLint. An
example of a zero configuration rule is a naming convention checker that detects
the used naming convention and locates all inconsistencies. Due toDBLint’s
ex-tensible architecture, database designers can implement more specialized rules that may only be relevant for a specific team.
The visualization component in DBLintprovides an overview of how tables
are related, based on foreign keys. Existing tools are not capable of rendering such an overview properly when the schema becomes non-trivial. We decompose large schemas into smaller independent clusters, such that each cluster is com-posed of a set of strongly connected tables. This makes it easier to comprehend large schemas, compared to the approaches found in existing tools.
We introduce the notion of table centrality, used to rate the relative impor-tance of tables based on their foreign-key relationships. This is useful in various contexts, e.g., the impact or severity of a design issue can be estimated based on the importance of the table in which it was found. We utilize the PageRank algorithm [1] to calculate the centrality of tables.
DBLint’s scoring system provides a metric that summarizes the overall qual-ity of a schema, based on design issues reported by the rules. A metric can, e.g.,
be used to compare different schema versions or design alternatives. DBLint
also assigns a score to each table, such that the most problematic parts of the schema can be identified easily.
To summarize, the main contributions of this work are the following.
• A pluggable rule architecture, which can be extended with more rules
easily.
• A rule that automatically discovers a naming convention and detects
de-viations.
• A visualization component which decomposes a database schema into
com-prehensible pieces.
• A centrality measure based on the PageRank algorithm, used to estimate
impact and importance of tables.
• A scoring system that rates a given database between 0 and 100.
DBLinthas been evaluated on eight open source schemas. The issues in two
of these schemas were examined thoroughly and it was verified that DBLint
reports real issues. The evaluation shows that our tool is able to identify a large number of relevant design issues in existing schemas. This proves the need for a static analyzer to help the database designer develop a consistent and maintainable database design.
2
Related Work
Some of the problems that DBLint concerns have been addressed in existing
discuss the related tools that DBLint is inspired by. We have not found any academic paper that thoroughly addresses automatic diagnosis of database de-sign. However, attempts have been made to quantify what a good data model is. These are relevant even though the approaches taken is different than ours. Following are two sections describing the related tools and related academic papers.
2.1
Tools
The main source of inspiration is a number of existing tools from other domains. The original Lint program was written to detect bugs and obscurities in C pro-grams [2]. Lint-like tools have since been made for many other programming languages such as Python [3] and Java [4]. The idea of reporting obscurities or inconsistencies through static analysis is very similar to ours, except that
DBLintis for a different domain. The original Lint examines source code, while
DBLintexamines database schemas. The relation between Lint andDBLint be-comes clearer when considering that a Database Management System (DBMS) is comparable to a compiler in that it captures errors, but does not care about inconsistencies or other bad design decisions. FindBugs [5], a Lint tool for Java, has provided inspiration on how to build a system that supports extensible rules, or “bug patterns” in FindBugs jargon.
SchemaSpy [6], SchemaCrawler [7], Schema Examiner [8] and SQL Audi-tor [9] are all tools for analyzing database schemas. The first two are open source and provide limited Lint-like functionality for schemas. However, the core features of these are extraction and presentation of database metadata, and does not provide a thorough analysis of a schema design. Schema Exam-iner and SQL Auditor are commercial tools with a purpose similar to that of
DBLint, but DBLint differs in four main areas. (1) An extensible rule system that allows quick development of additional rules. (2) Automatic consistency checks, e.g. a naming convention rule. (3) A centrality measure of tables based on foreign-key relationship. (4) Visualization of large schemas by decomposing them into independent clusters. Furthermore, SQL Auditor only supports SQL
Server, and Schema Examiner supports just a few enterprise DBMSs. DBLint
supports major DBMSs such as SQL Server, Oracle, MySQL and PostgreSQL.
2.2
Academia
An effort has been put into the development of methods which quantifies the quality of a data model or a relational schema using a set of metrics. Piattini et al. [10], Calero et al. [11] propose and evaluate three metrics for estimating the maintainability of relational schemas. These are simple measures such as the number of attributes and foreign keys in the schema. Compared to our work, we give a broader estimation of quality as we include the result of 25 design rules.
Moody [12] has identified 25 metrics for evaluating the quality of a schema for quality factors such as understandability, correctness and implementability. However, they rely on manual evaluation as most of these metrics cannot be measured automatically on a database schema. An example of such a metric is the number of user requirements which are not represented in the data model. To calculate this, a complete set of requirements must be available and evaluated
against the data model manually. The strength of the manual approach is that it is possible to identify design problems that are hard to find automatically. However, our focus has been to develop a tool that automatically evaluates a schema within a few minutes. This reduces the cost of evaluation and makes it affordable to apply it many times throughout development. We regard the two approaches as complementary because they identify different design problems.
Teniente et al. [13] presents a tool for validating schemas in SQL Server. Schemas are verified according to desirable properties such as non-redundant integrity constraints. The properties verified are limited, but the work is
inter-esting and similar checks could be adopted inDBLint.
3
Running Example
The example introduced in this section shows instances of bad database design. All of them have been observed in real-world schemas and it should give an idea
of the type of problems identified byDBLint. We will refer back to this example
in following sections to explain how some of our rules work.
The example schema consists of three tables: users,threadsandposts. It
models a very simple Bulletin Board System (BBS), in which users can create threads that other users can respond to. Figure 1 shows the SQL create script for this example.
create ta b l e u s e r s ( i d varchar( 1 0 ) , user_name varchar( 3 2 ) , e m a i l 1 varchar( 3 2 ) , e m a i l 2 varchar( 3 2 ) , e m a i l 4 char( 3 2 ) d e f a u l t ’ ’ , l a s t _ p o s t int, msn# varchar( 0 ) , primary key( i d ) , f o r e i g n key ( l a s t _ p o s t ) r e f e r e n c e s p o s t s ( p o s t _ i d ) ) create ta b l e t h r e a d s ( CreatedBy varchar( 3 2 ) , i d int, s u b j e c t varchar( 3 0 ) , p o s t s int, primary key ( i d ) , index ( i d ) , index ( i d , s u b j e c t ) , f o r e i g n key ( CreatedBy ) r e f e r e n c e s u s e r s ( i d ) ) create ta b l e p o s t s ( p o s t _ i d i n t unique, s u b j e c t varchar( 3 2 ) , p o s t _ t e x t varchar( 1 5 0 0 ) , t h r e a d _ i d int, u s e r varchar( 1 0 ) , f o r e i g n key ( t h r e a d _ i d ) r e f e r e n c e s t h r e a d s ( i d ) )
Figure 1: SQL code for the simple BBS schema.
DBLint identifies 18 design issues in just these three tables. The issues are listed in Table 1. Many of these issues are apparent when manually examining the SQL code, but become much more difficult and time-consuming to identify in databases with hundreds of tables. Notice that the tool does not automatically correct the listed design issues, but focuses on creating a diagnosis of a schema.
# Issue description
1 Tablepostsis missing a primary key
2 Column users.msn#is a varchar with length zero
3 Datatype of the foreign-key column threads.CreatedBy does not
match referenced datatype
4 The columnusers.msn# contains special characters
5 Char column of length 32 has default value of length 0 (users.email4)
6 All columns are nullable in table posts
7 All columns except the primary key are nullable in tableusers
8 5 varchar columns have length 32, and 1 of length 30. Consider using
a common length
9 Cycle found between tables: posts, threads, users. None of the
foreign keys are deferred
10 Sequence of related columns inusersdo not have the same datatype
11 Missing colum in sequence: email1, email2, email4 in tableusers
12 Different datatypes for columns namedid
13 Column threads.CreatedBydoes not follow naming convention
14 Column users.msn#does not follow naming convention
15 Index namedidin tablethreadsis redundant
16 Varchar column posts.post_text, of length 1500, is too long.
17 The primary key of tablethreadsshould be positioned first
18 The reserved worduser is used as a column name in tableposts
Table 1: Design issues discovered by DBLint for the example. The issue
de-scriptions are edited for layout purposes.
4
Database Design Rules
DBLintidentifies design issues in database schemas by applying a set of design rules. Each rule examines the database for a concrete design problem and are based on good practices of database design. Reese [14] illustrates a number of good practices in database design, such as: primary keys should consist of the smallest number of columns possible, and constraints should be used to enforce the integrity of the data in the database. Furthermore McConnell [15] states the importance of agreeing on design conventions and practices in programming. This ideology can be applied to database design, where a similar agreement for a database design would enhance the quality of the final result. We have designed the rules such that they reflect these guidelines.
4.1
Rules Overview
Table 2 shows the 25 rules implemented in DBLint. All rules are assigned a
severity, which are explained further in Section 4.2.
As shown in the table, rule 4 and 5 have two severity levels, because these rules report two kinds of design issues. For instance, rule 5 will report a critical issue if no foreign keys are used at all or a medium issue each time it detects a table island, i.e. a table with no relations to other tables.
# Rule Severity
1 Missing primary key critical
2 Varchar columns with zero length critical
3 Different data types between foreign-key column
and referenced column
critical
4 Inconsistent naming convention critical / medium
5 Too many table islands critical / medium
6 Foreign-key cycles high
7 Use of special characters high
8 Too long column names high
9 Table with too few columns high
10 Too many nullable columns high
11 Too many columns in primary key high
12 Long char columns with empty string as default
value
high
13 Inconsistent varchar lengths high
14 Redundant indices medium
15 Too many text columns in one table medium
16 Missing columns in sequence medium
17 Inconsistent data types in column groups medium
18 Wrong position of primary key low
19 Foreign keys without index low
20 Very large varchar columns low
21 Different data types for columns with same name low
22 Columns with same name but different default value low
23 Missing foreign key info
24 Use of reserved SQL words info
25 Composite primary keys consisting of columns not
used in foreign keys
info
Table 2: Rules implemented and the severity level from critical to info.
4.2
Severity Levels
Design issues are categorized into five severity levels to weight issues differently. Besides being able to arrange issues, severity ratings can be used to tell some-thing about the quality of individual tables, as well as the overall quality of the schema, i.e. as part of the scoring system. The five severity levels are the following.
Info Used on issues that can be allowed if intentional, or issues that cannot be
determined accurately when only looking at metadata. For instance, use of an SQL keyword can be accepted if it improves the understandability of a table.
Low Used on issues indicating that the database developer did not maintain an
overview of the database, e.g. did not position the primary key as the first column(s) in the table. These issues do not influence the overall integrity of the data in the database.
Medium Used on issues that contradicts good design practice. For instance,
redundant indices, which is exemplified in the threads table from the
example in Section 3.
High Used on issues indicating a design that deviates significantly from good
database design practices, e.g. the use of special characters in identifiers.
Critical Used on issues potentially leading to compromised data integrity, e.g. a table without primary key.
4.3
Naming Convention Rule
A consistent naming convention is important for archiving a maintainable data-base schema. We have observed that many real-world schemas have uniformly named identifiers, but often with a few deviations. However, deviations can be hard to find manually in databases with thousands of identifiers. We are tar-geting two database design issues: missing naming conventions and inconsistent use of naming conventions.
Forcing a specific naming convention upon the database designers would
be against the philosophy of DBLint. Instead it should be entirely up to the
designers to decide what works best for them. Therefore, we want to check that the naming is consistent with whatever convention the designers use most. The usefulness of a specific naming convention can always be argued, while inconsistencies are almost always a bad thing.
The purpose of the rule is to detect the used naming convention and then find identifiers that do not adhere to this naming convention. The challenging part is to automatically detect the naming convention from a set of identifiers. To reduce the complexity of the problem we only consider: casing, word separators and symbols. A naming convention involves other aspects such as consistent use of domain specific terms. We omit these and focus on the syntax of the identifiers instead. For example, consider the following set of identifiers from the example in Section 3:
user_name, thread_id, CreatedBy, post_id
It is easy to see that CreatedBy stands out, because it uses Pascal casing
while the others do not. The naming convention rule should locate this identifier and report it as an instance of inconsistent naming.
The first step in our approach is to tokenize each identifier, to get an ab-straction of the name, representing the syntax. The four names in the example above are tokenized as seen in Table 3.
Identifier Tokens
user_name [ begin,word,underscore,word,end]
thread_id [ begin,word,underscore,word,end]
CreatedBy [ begin,WORD,word,WORD,word,end]
post_id [ begin,word,underscore,word,end]
Table 3: Example identifiers and the comma separated list of tokens they are converted into by the tokenizer.
One or more lowercase letters are represented by awordtoken and uppercase
letters by aWORD token. The goal of tokenization is to extract the pattern used
for a given name, such that names that follow the same pattern outputs the similar list of token types. We can see that this is the case in the example in Table 3 above.
The next step is to build a first-order Markov chain. A Markov chain is a finite state automaton in which transitions represent probabilities of moving from one state to another [16]. In our approach, states represent tokens, and transitions represent the probability of going from one token to another. Note that the number of states in the Markov chain is limited by the number of
different tokens, n, and that the number of edges is bound by n2. Figure 2
shows the Markov chain for the list of tokens above. There is a probability of 0.75 that a name is going to start with a lowercase word. Intuitively, a name that do not adhere to the general convention will at some point follow a transition with low probability.
begin word WORD under-score end .75 .25 1 .5 .375 1 .125
Figure 2: A Markov chain for the identifiers in Table 3. Three identifiers use lowercase words separated by underscores, and one deviating identifier uses Pascal casing. begin word WORD end 1 1 .3 .7
(a) Camel case.
begin word under-score end 1 1 .3 .7
(b) Word followed by underscore and then word
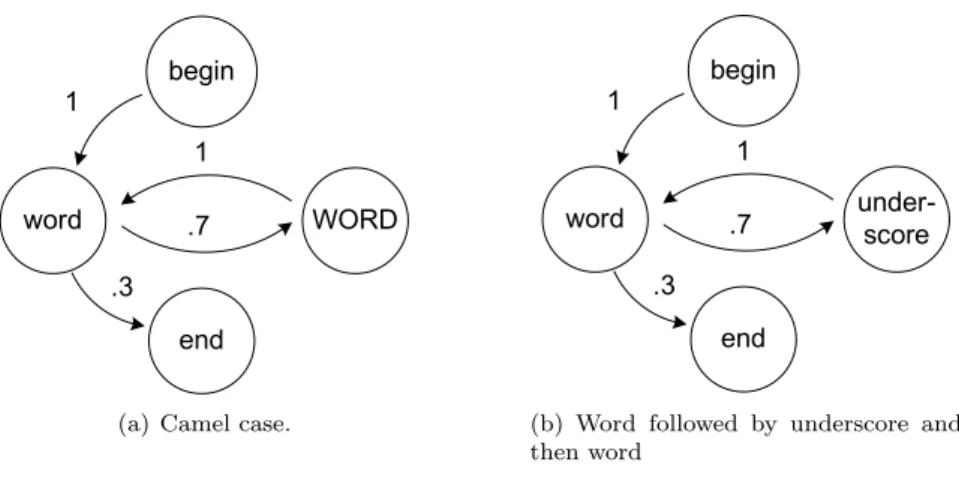
Figure 3: Markov chains representing two known naming conventions. Note that consistent naming yields a simple Markov chain.
Two sample Markov chains are shown for two common naming conventions in Figure 3. The number of states and transitions can be considered a measure of
the complexity and uniformity of the naming convention. Simple and consistent names yield a Markov chain with few states and transitions. Appendix A shows
a Markov chain that was generated byDBLintfor a real-world schema without
consistent naming. In our study of that schema, we found several inconsistencies and oddly named identifiers, and the Markov chain clearly reflects that by its many edges.
4.4
Cycle Detection Rule
Tables and foreign keys can be interpreted as a directed graph, where tables are vertices and foreign keys are edges. Interpreting the example in Section 3 as such a graph, it becomes apparent that a cyclic dependency exists between the three tables. Such a cycle is not necessarily a design issue if the referential actions and deferability have been thought through. A cycle is only considered a design issue if one of the following two predicates hold.
No Deferred If no foreign keys in the cycle are set to deferred it will be im-possible to insert any values into the tables.
Cascade Delete If the delete referential action of all foreign keys in the cycles are set to cascade delete, it is possible to delete all data in the tables when deleting a single row.
DBLint detects cycles by using Tarjan’s strongly connected components al-gorithm [17]. Each discovered cycle is then tested against the two predicates and if either is true, an issue is reported. In the example in Section 3, all foreign keys are not deferred, hence a cycle issue is found.
5
Report
When the rules have been executed on a given database, DBLint generates a
document describing what it has discovered. This is the main output ofDBLint.
It contains a list of all design issues, schema visualizations, the score for each table as well as the total score, etc.
5.1
Visualization of Relations
When inspecting an issue on a table, it is helpful to illustrate the context in which that specific table is used. Such a context is defined at the database level by foreign keys.
Another reason for creating some means of visualization is to provide an overview of large schemas. It is necessary to decompose a large schema into several smaller contexts to be able to comprehend it. This problem is experi-enced by many developers beginning to use or extend an existing schema.
Two approaches to visualize schemas are the following.
• Put everything into one big graph, which becomes impossible to
compre-hend, or print on A4 paper.
• Group tables manually into clusters and draw each cluster, which is very
Simply drawing the directed graph defined by the foreign-key relationships does not work. This approach on a large schema such as Magento [18] which has 300 tables, results in a huge spiderweb of tables and edges, illustrated by Figure 10 in Appendix B. As can be seen the result is incomprehensible for schemas this large, hence it is not a good enough approach.
5.1.1 Our Approach
To make the graph comprehensible, we cluster the tables and draw a graph for each cluster. We have evaluated two algorithms for decomposing large graphs, namely Edge Betweenness clustering [19] and Voltage clustering [20], with sim-ilar results. We base our approach on Edge Betweenness clustering, because it produces better clusters.
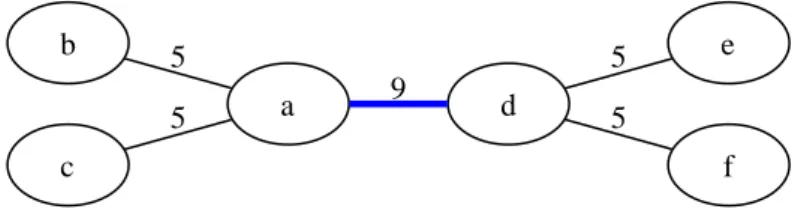
The Edge Betweenness of an edge refers to the number of shortest paths between all pairs of vertices which uses the given edge, illustrated in Figure 4. The intuition behind the Edge Betweenness clustering algorithm is that a graph already consists of clusters, and that clusters are connected through only a few edges. An overall sketch of the Edge Betweenness clustering algorithm is as follows.
1. Calculate edge-betweenness for all edges 2. Remove the edge with highest betweenness 3. If not enough edges removed, go-to step 1
The algorithm takes as input a graph and the number of edges to remove. How to determine the number of edges to remove is not immediately clear. Using a
simple heuristic such as “removeeedges per vertex in the graph” does not result
in a usable set of clusters, because the largest cluster will contain the majority of tables. b a 5 d 9 c 5 e 5 f 5
Figure 4: Edge betweenness of an example graph. The number associated with each edge is that edge’s betweenness score, i.e. the number of shortest paths
that use the edge. The thick edge between a and d is the next edge to be
removed by the clustering algorithm.
One explanation of the poor effectiveness of these clustering approaches is that in the schemas examined, a few tables are referenced a lot. A reduced example is shown in Figure 5, and one is easily convinced that such a case cannot be clustered by some heuristic.
Instead of removing edges, removing central vertices results in a set of small clusters, which are independent of each other. On the Magento example from before, we find a few central tables. Removing the five most central tables,
a core b c d e f
Figure 5: An example graph which cannot be clustered easily by removing edges. The graph cannot be clustered because the edge betweenness of all edges is six.
produces small-enough clusters to be printed on A4 paper. To estimate the most central tables the degree of each table is used, i.e. the number of ingoing
foreign keys. The removed tables are collected and returned as amain cluster.
Input Parameters The algorithm as described above takes two inputs: the
number of central tables to remove v and the number of edges to remove e.
These are determined by increasing v iteratively until all vertices have been
removed. For each iteration, remove edges iteratively using edge betweenness, thus combining the two approaches of removing edges and vertices. For each
combination ofv ande, compute a score, and return the combination with the
best score.
The algorithm that computes the score uses two metrics. The best score is 0, and a higher score indicates a worse combination. The metrics are defined as follows.
Coupling A score which estimates how self-contained all cluster are.
Coupling(C) =X c∈C
FKoc(c)·CR(c)
Cis a set of clusters,cis a cluster fromC,FKoc(c)counts foreign-keys in
c to other clusters andCR(c)counts clusters referenced byc. Intuitively,
if a cluster has many foreign keys to other clusters, it has high coupling and scores worse.
Comprehensibility A measure of how comprehensible all clusters are.
Comprehensibility(C) =X c∈C
TableCount(c)2
C is a set of clusters, c is a cluster from C, TableCount(c) returns the
number of tables in the cluster c. This function penalizes large clusters
based on their table count, as we have observed a link between the com-prehensibility of a cluster, and its number of tables.
The squaring in the comprehensibility score is necessary, because the scoring function must be non-linear with respect to the number of vertices. If a linear
function is chosen, the score of two clusters a and b would always yield the
same result, independent of how the vertices are distributed. By using the
square function the total score is best when all clusters have the same number of vertices. To be able to compare scores for two sets of clusters, coupling and comprehensibility are combined to one score by multiplication.
When drawing the graph for a cluster, we insert a vertex for each table in the cluster, and an edge for each foreign key to a table in the same cluster. Whenever a foreign key to a table in another cluster is encountered an edge to that cluster is inserted instead. Finally when a foreign-key points to a central
table from themain cluster, the specific table is inserted. This causes the tables
from themain cluster to appear in many clusters.
5.1.2 Cluster Algorithm
The cluster algorithm is divided into two functions: Remove and Cluster.
Remove, see Algorithm 1, is a function which copies the graph, and then
re-moves a number of vertices and edges. Cluster, see Algorithm 2, tries to find
the best combination of removed edges and vertices.
Remove Removeuses four functions: Copy,Delete,VertexWithHighestRank
andEdgeWithHighestBetweenness. Copymakes a copy of a graph andDelete
removes a vertex or an edge. VertexWithHighestRankreturns the vertex with
the highest rank from an input graph. EdgeWithHighestBetweennessreturns
the edge with the highest edge betweenness score from an input graph.
Remove can be summarized into three steps: Line 1: make a copy of the graph. Line 2-5: remove vertices. Line 6-9 remove edges.
If the input variableeis larger than the number of edges in the graph, then
Removeonly continues until it has removed all edges.
Algorithm 1The Remove(G, v, e) algorithm.
Require: A graph G= (V, E). The number of verticesv to be removed. The
number of edges eto be removed
Ensure: The input graphG, withv vertices andeedges removed
1: G0 ←Copy(G) 2: fori= 1tov do 3: vertex←VertexWithHighestRank(G0) 4: Delete(G0, vertex) 5: end for 6: fori= 1to edo 7: edge←EdgeWithHighestBetweeness(G0) 8: Delete(G0, edge) 9: end for 10: return G0
Cluster The Cluster part is the backbone of the algorithm. It maintains the score and configuration of the best seen configuration so far. The function
Subgraphssplits an input graph into a set of connected graphs, such that in each graph it is possible to follow edges from one vertex to any other vertex
from that graph. Finally theScorefunction rates a given set of clusters, using
the previously described metrics Coupling and Comprehensibility. The overall view of the algorithm is as follows.
Line 1-3 Initialize score, vertices and edges removed to zero.
Line 4-15 Try out all combinations of edges removed vs. vertices removed
Line 8-13 For each combination rate the result. If it is lower than the best seen so far, update the best score and store vertices and edges removed.
Line 16-18 Recreate the best found combination and return the result.
Algorithm 2The Cluster(G) algorithm
Require: A graphG= (V, E)
Ensure: The best set of clusters discovered
1: score←0 2: v ←0 3: e←0 4: fori= 0 to VertexCount(G)do 5: forj= 0to EdgeCount(G)do 6: G0←Remove(G, i, j) 7: clusters←Subgraphs(G0) 8: s←Score(clusters) 9: if score < sthen 10: score←s 11: v←i 12: e←j 13: end if 14: end for 15: end for 16: G0←Remove(G, v, e) 17: clusters←Subgraphs(G0) 18: return clusters
To sum up, Cluster iterates over all combinations, gives a score to each
combination and returns a set of clusters.
5.2
PageRank
To make a report for a large schema easier to navigate, we emphasize central
tables such that they are easily identified. For example, the core vertex in
Figure 5, should be emphasized in some way to see that it is a central table. Furthermore, an issue related to a central table should be considered more severe than the same issue on a peripheral table.
A central table is a table that is integral to a system and therefore has large impact on modifications. A table which other tables depend on becomes a central table, because modifying it will most likely influence the depending tables also.
With only metadata available we base the detection of central tables on foreign keys. Interpreting a schema as a directed graph, makes it possible to use the graph centrality algorithm PageRank [1], which computes a ranking of each vertex in a given graph. Specifically PageRank calculates how many times a given vertex is visited by randomly following edges, and sometimes jumping to a random place in the graph. PageRank was originally developed for estimating the relative importance of web-pages based on links.
The centrality calculated by PageRank is utilized byDBLintin the following
areas.
Visualization Tables are sized according to their ranking when drawing clus-ters. This gives a better overview because central tables can be identified quickly.
Naming Convention A naming convention is derived from a list of identifiers, as described in Section 4.3. The influence that each identifier has on the naming convention is determined by ranking, such that a central table contributes more to the convention than peripheral tables.
Scoring The scoring system, as will be described in Section 5.3, weights design issues such that an issue in a central table is considered more severe. This is based on the assumption that changes or errors are likely to propagate to other tables. For instance, a primary key with an inappropriate data type is less severe for a peripheral table compared to a central table where the primary key is referenced by many other tables.
5.2.1 The PageRank Algorithm
PageRank is an algorithm which assigns a numerical weight to each vertex in a directed graph based on the weights of its neighbors. The weight of a vertex,
i.e. its PageRank, is calculated in a number of iterations. Each vertex, with m
outgoing edges, gives in each iteration m1 of its PageRank to each connected
ver-tex. It terminates when the difference between the weights from two iterations
is lower than some predefined constant.
A fundamental assumption of PageRank is that a website u linking to
an-other website v corresponds roughly to u saying that v is important. In the
context ofDBLint and PageRank this is also assumed to be true, such that a
table f with a foreign key to table p, corresponds tof saying that table p is
important. This is based on the fact that a foreign-key ensures an inclusion dependency relationship, yielding a strong relation between the two tables.
For PageRank to be useful on a database, it is assumed that most foreign-keys are specified in the schema. If many foreign-foreign-keys are not specified the
approach will degenerate, until the point where each table has a rank of n1, n
being the number of tables. We have observed a lack of foreign-keys in many open source schemas, and thus some cases in which PageRank does not yield useful information.
5.3
Scoring
A simple list of design issues does not tell much about whether the given schema is good or bad in overall. A metric can solve this problem by summarizing the quality of the schema and individual tables.
We give a score to each individual table. This allows us to direct the user towards the most problematic parts of the database. A total database score is also given, as a number between 0 and 100. A higher score indicates a better schema design. Database designers will benefit from a score in the following ways.
• Different schema versions or design alternatives can easily be compared
by considering the score. For instance, the database designer can see
whether a number of schema changes have improved the overall quality of the schema or degraded it.
• The team can use the score to agree on a minimum acceptable standard for
tables. This is an easy way to assure quality of new tables when extending or modifying the database.
• The score reveals the overall state of the schema. This information can be
used to determine whether more work needs to be put into the database design in general.
• A score for each table reveals the most problematic areas of the
data-base design. This can be used to direct the focus onto the tables which contribute negatively to the overall score.
• The team can use the score as a motivational factor or encourage
compe-tition between developers.
5.3.1 Table Score
We define a table score function,score(t), that returns the score of a table. We
calculate the score by considering the number and severity of design issues that was found for the given table. The initial score of a table is 100, and for each issue a number is subtracted depending on the severity of the issue. Therefore, the score 100 is given to tables with no issues. The score function is defined as follows. score(t) = 100−w1(t) X issue∈t p(issue) where p(issue) = 80 if severity(issue) = critical 60 if severity(issue) = high 40 if severity(issue) = medium 20 if severity(issue) = low 10 if severity(issue) = info
p(issue) is a penalty function that determines the negative impact of an
issue. For instance, a critical issue has a negative impact of 80 points on the table score. These constants are estimated based on numerous trials and the best of our judgment. Because of the policy nature of these estimates, a later version of DBLint should allow them to be user-defined. The penalty of each issue is
multiplied a weightw1(t)such that issues are graded differently depending on
the table where they were found. Issues in central tables are thus considered more severe, because they are likely to propagate to other tables.
5.3.2 Total Score
The score of a database Dis found by calculating the weighted mean of scores
from the individual tables. The function is defined as follows.
totalScore(D) = X t∈D max(0, score(t))·w2(t) X t∈D w2(t)
By using weighted mean the score of certain tables will contribute more to
the total score than others. The weighting functionw2(t)reflects the PageRank
oft, such that central tables have the biggest influence. All negative table scores
are changed to 0, because we want to prevent one very bad table from having too much negative influence on the score.
5.3.3 Example
Running the table score algorithm on the tables in Section 3, yields scores that are all below 0. This is not surprising since the example has almost all
kinds of issues thatDBLint checks for. The total score will therefore be 0 as a
consequence of this.
To illustrate the scoring, Table 4 shows an example with two fictitious tables,
emp anddpt.
Table w2(t) Score w2(t)·Score
emp 3 25 75
dpt 1 100 100
4 175
Table 4: Example of two tables with different scores and weights.
The table emp has a weight that is three times bigger than the weight of
dpt. Therefore, its score contribute more to the total score than the one ofdpt.
The total score is calculated as follows.
totalScore= 175
4 = 43.75
6
System Architecture
DBLint is implemented in C#.NET and Java, in a total of 9200 lines of code excluding blank lines and comments.
DBLint has a multi-layered architecture which divides the system’s respon-sibilities into several layers with low coupling. The result is a flexible and
main-tainable architecture that is not tied to any concrete DBMS. DBLintsupports
most common database systems, with minimal DBMS-specific code. The rule system uses a plug-in architecture, which decouples the rules from the rest of the system. This makes the system highly extensible and maintainable.
Figure 6 shows how the architecture of DBLint is composed. It is divided
into two parts,DBLint and data sources. Data sources are external databases
providing the metadata that rules are checked against. DBLint extracts the
metadata from the system tables which defines the structure of the data. The
boxes inDBLint on the figure represents separate layers. Each layer is further
divided into subcomponents (controller, model builder, etc.). As shown, the
rules are not considered a part of the DBLint core. These are loaded at
run-time, represented by an arrow on the figure. The following sections describe the layers in more detail.
DBLint Architecture
Data sources DBLint E x tr a c ti o n L a y e rOracle MySQL PostgreSQL
Generic Database Interface Extractor M o d e l L a y e r Model builder Model U I L a y e r
Report Main GUI
R u le L a y e r MsSQL
Controller Issue Reporter
Rules & Providers
Plug-ins Standard rules
User rules
Providers
Figure 6: The multi-layered architecture ofDBLint. Rules are plug-ins loaded
at run-time. Data sources are running databases containing the metadata that
DBLintexamines.
6.1
Extraction Layer
The extraction layer’s main responsibility is connecting to a database and ex-tract its metadata. A generic database interface allows us to process databases from different DBMS vendors in a uniform way. Java Database Connectivity (JDBC) [21] provides such a standard interface for accessing metadata, and
since JDBC drivers exist for most common database systems, we have decided to use JDBC.
6.2
Model Layer
The model builder constructs an object representation of the metadata. This metadata model is the main data structure used when expressing rules. The model provides a fast and convenient way to access the metadata while being completely DBMS independent. The model is limited in a few ways due to time constraints: it does not support User Defined Types (UDT), check-constraints and views.
6.3
Rule Layer
Rules are decoupled fromDBLint and written as plug-ins, which increases the
maintainability and flexibility of the architecture. New rules can thus be added easily, even by third-party developers. This is especially useful for companies which have their own constraints that need to be enforced by specialized rules. The definition of a provider is similar to a rule, but instead of reporting design issues, a provider exposes additional information about the schema. For instance, PageRank is implemented as a provider that exposes tables’ ranks to other rules or even other providers.
The main task of the rule controller is to schedule rules and providers for execution. They are scheduled such that they run in parallel if possible. The controller solves dependencies between providers and rules, and ensures that they are executed in the right order. The issue reporter collects and manages issues identified by individual rules.
6.4
UI Layer
The UI layer contains components for generation of reports over the issues that are reported during the execution of rules. Reports are the main output of
DBLint, and they provide an overview of all design issues and allow the user to browse various metadata and figures. Besides the report generator, there is a user interface for configurating the database connection and executing rules.
7
Evaluation
We have evaluated DBLint on eight real-world schemas. The output from
ex-amining these systems will be used to evaluateDBLinton performance and the
quality of the design issues found.
We will look at the performance of runningDBLinton databases of varying
size. As we envisionDBLintto be used in a TDD process, the result of examining
a database schema must be available in a short time.
To verify that the rules in DBLint find actual design issues we will review
the reports from two examined systems. These issues will be categorized as true positives, false positives or undecidable depending on the certainty of the issue being a real problem. We will also look into the results from the naming convention rule.
As a supplement to the evaluation we have received feedback from two
de-velopment teams whereDBLinthas been used to examine databases which are
deployed. This feedback will be summarized into a number of key points.
7.1
Test Systems
We have examined eight open-source schemas, of which six are Content Man-agement Systems (CMS) and two eCommerce systems. All systems are chosen because they are widely used and have a large community engaged in an active development effort. In Table 5 the systems are listed together with the number of tables, columns and foreign keys.
System Version Tables Columns Foreign keys
Drupal [22] 6.20 46 305 0 Joomla [23] 1.5.22 34 299 36 Magento [18] 1.4.1.1 300 2502 387 MediaWiki [24] 1.2.0 46 306 28 Moodle [25] 1.9.9 195 1758 0 phpbb [26] 3.0.7 62 546 0 PrestaShop [27] 1.3.3 114 565 170 Typo3 [28] 4.4 68 806 0
Table 5: The list of examined systems and their number of tables, columns and foreign keys. Note that four of the schemas do not use foreign keys.
7.2
Issues Found
Table 6 shows the distribution of issues found on each system. As can be seen, Joomla has the highest score and MediaWiki the lowest. Joomla has a high score because of the low number of critical issues and because it has foreign keys. MediaWiki has a large number of critical issues compared to the number of tables because of missing primary keys. If a system does not use foreign keys reasonably, e.g. by having too many data islands, it impacts the score negatively.
System Critical High Medium Low Info Score
Drupal 0 1 1 14 89 35 Joomla 3 0 10 9 26 61 Magento 19 49 88 39 189 47 MediaWiki 29 4 11 1 25 17 Moodle 0 3 27 34 252 38 phpBB 11 2 3 15 73 25 PrestaShop 21 7 65 10 33 50 Typo3 2 1 52 18 85 24
Table 6: The issues found on each system and the systems’ scores. The issues are shown for each severity.
some issues occurred more often and on most of the systems. The design rule detecting missing primary keys found issues on six of the eight systems. The
number of issues reveals that approximately 10% of all tables examined are
missing a primary key. Another rule which frequently reports an issue is “Use
of reserved SQL words”. Approximately 3% of all examined identifiers use a
reserved SQL word.
7.3
Report Examination
To verify the correctness of the issues reported byDBLint, we manually examine
two of the reports from the set of test systems: PrestaShop and phpBB. These two schemas are chosen because they are not too large, while remaining non-trivial. PrestaShop has a fair amount of foreign keys, while phpBB does not have any.
We examine the issues in the report and rate them as either: true positive, false positive or undecidable. True positive means that we found evidence sup-porting that the issue is a real problem; false positive means that we found evidence challenging the claim; undecidable means that we could not decide whether the issue should be a true positive or a false positive. It should be emphasized that our domain knowledge and application insight, is small to non-existent.
We expect to find a correlation between severity level and the extent to which all issues are true positives, such that critical issues have very few false positives whereas info issues have more.
7.3.1 PrestaShop
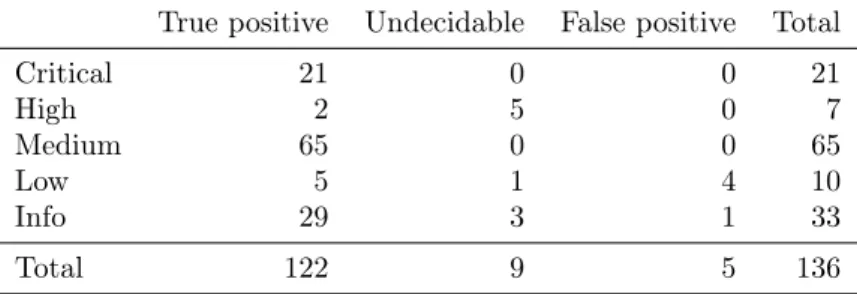
The PrestaShop issues are summarized in Table 7. The most important infor-mation is the bottom line which states that out of a total of 136 issues found, 122 are validated to be actual design issues in the schema, 9 are undecidable and 5 are false positives.
It should be noted that the 21 critical issues are tables without primary keys, the 65 medium issues are due to redundant indices, and 22 of the info issues are due to reserved words. The rules generating these issues cannot raise false positives, following the intuition that either you have a primary key or you do not. As such they will not be discussed further.
The issues raised by “Too many nullable columns” and “Table with too few columns” could not be determined to be a true positive or a false positive without better domain and application knowledge. Rule “Inconsistent length on varchar columns” reported 20 columns with length 255 and 3 columns of length 256. Inspecting the columns (all of them) did not yield any evidence supporting that this difference is justified.
Rule “Composite primary keys consisting of columns not used in foreign keys” yielded some interesting results (five issues totally, four true positives and one undecidable). One table had a composite primary-key consisting of three columns, one auto-increment column and two foreign-key columns. The primary-key is necessarily a super-key and could be reduced to only the auto-increment column. Another table was missing the declaration of a foreign key (which could be identified due to consistent names), and one table with a two
column primary key had neither column defined as a foreign-key constraint, which again could be detected due to consistent naming.
Rule “Missing foreign key”, has one issue which we believe to be a false positive, three issues where the foreign key has not been set, and two undecidable issues where we found evidence supporting both conclusions.
Rule “Inconsistent data types” reported a total of nine issues of which four are true positives, sucas the column “date_upd”, which appears 12 times as
DateTime and one time as Date. Four issues has been estimated to be false positives due to cases such as a column named “value”, which can refer to many different types of values depending on the context. The last issue is undecidable.
True positive Undecidable False positive Total
Critical 21 0 0 21 High 2 5 0 7 Medium 65 0 0 65 Low 5 1 4 10 Info 29 3 1 33 Total 122 9 5 136
Table 7: The results of examining the issues for PrestaShop.
To sum up, 122 issues identified, 9 undecidable and 5 false positives. As can be seen only low and info have false positives.
7.3.2 phpBB
The issues for phpBB are summarized in Table 8. The schema for phpBB is smaller than PrestaShop, but it scores only half as much. 104 issues are reported totally, of which 89 have been found to be true positives, 9 false positives and 6 undecidable.
In the phpBB schema there are 11 tables without primary keys, and 3 tables with redundant indices. Because of the fact nature of these issues they will not be discussed further.
Rule “Table with too few columns” reported one issues; a table with a single column which is the primary key and appears to be a foreign key to the users table. This results in a Boolean relationship and given that the users table has 76 columns already we think that it is worth the extra byte in that table. The extra byte could come from the 40 byte varchar column used to store IP addresses.
Rule “Inconsistent varchar lengths” reported five columns of length 30 and four columns of length 32, but inspection shows that the columns refer to dif-ferent concepts and as such could be justified, hence it is rated undecidable.
Rule “Missing foreign key” accounts for 62 of the issues reported, which is one issue for each table in the schema. Of these 52 has been identified to have undefined foreign keys, 8 are identified to be false positives, i.e. tables should stand alone, and 2 are undecidable.
Rule “Composite primary keys consisting of columns not used in foreign keys” reported 11 issues, of which 9 are found to be true positives, in that foreign keys
have not been specified, while the column names match primary keys in other tables. Two are found to be undecidable.
Rule “Very large varchar column” reported 15 issues of which 12 are true positives and 3 are undecidable. We have tried to estimate the usage of the columns and see whether it is better, from a performance perspective, to use a CLOB instead. Cases where the entity is likely to be used without the large varchar field has then been rated a true positive. It should be noted that of the issues reported 13 have a maximum of 4000 characters, and 2 have a maximum of 8000 characters.
True positive Undecidable False positive Total
Critical 11 0 0 11 High 1 1 0 2 Medium 3 0 0 3 Low 12 3 0 15 Info 62 2 9 73 Total 89 6 9 104
Table 8: The results of examining the issues for phpBB.
The result of examining the reports for PrestaShop and phpBB, is that the rules detect relevant and real issues, with few false positives. Furthermore, false positives occur only on issues with severity level info and low. The correctness of some issues is undecidable because they require application knowledge to be categorized as either a true positive or a false positive.
7.4
Naming Convention
To verify the approach used to find deviations in the naming convention we manually examined two schemas with respect to their naming convention to
compare the result withDBLint’s result. The two systems are Typo3, in which
DBLintfound 51 naming convention issues and Drupal which there are no issues in.
When manually examining the two systems we first looked at the identi-fiers to determine the naming convention. Afterwards, all the identiidenti-fiers were examined again to find those that deviated from the convention.
Comparing the result from the manual examination and the results from
DBLintwe can see that the results agree on all the inconsistencies and the most likely naming convention. From this we conclude that the approach taken in discovering naming convention satisfies our intentions.
7.5
Performance
All performance tests have been run on a machine with an Intel Core i5 2.53
GHz processor, 4 GB RAM running Windows 7. When executing DBLint the
time spent analyzing a schema can be divided into two parts: extraction and rule execution. The system first extracts metadata from the DBMS and then executes the rules, including generating graphs for the report. In Figure 7 the
figure shows that the largest part of the running time is spent extracting data from the server. We estimate that the extracting time is roughly proportional to the size of the schema (tables, columns, keys, foreign keys), but is also dependent on the DBMS. 10 15 20 25 S e c o n d s
Data Extraction + Rule Execution
Rule Execution Data Extraction 0 5 10 S e c o n d s Schema
Figure 7: Running time for data extraction and rule execution.
DBLintuses JDBC to extract metadata and the performance by the extrac-tion layer is thus limited by the implementaextrac-tion of the JDBC driver. Therefore, we think that it reflects more of our work to show the execution time of rules. Figure 8 shows the execution time of the 25 rules and generation of graphs for
the report for each examined system. As can be seenDBLintis very fast at
exe-cuting the rules, even for large schemas, with a total running time of less than two seconds for a schema with 300 tables. This makes the rule execution part of
DBLintsuitable for the envisioned work-flow, with a developer making schema
changes and then runningDBLintto see if any issues have been introduced.
0.0 0.3 0.6 0.9 1.2 1.5 1.8 S e c o n d s Schema
Rule Execution Time
7.6
User Feedback
DBLint has been used to examine two deployed schemas. The output from
DBLintwas reviewed by the developers of the schemas and they expressed their opinions of the found design issues and the tool itself.
They like the idea of having a tool assisting the development process and giving feedback about design quality. They found it to be less intimidating to get feedback from a tool than from a superior/colleague. Having scores for the individual tables and one for the overall design is a good feature, because it introduced a competitive aspect of database development, such as finger-pointing “You created the table that scores lowest” and show-off “My tables only scores perfect”.
The rules implemented in DBLint identified relevant issues that are
con-sidered design errors by the database developers. Examples of such issues are inconsistent varchar lengths, redundant indices and inappropriate use of
pri-mary keys. Overall,DBLint uncovered relevant issues in the database design,
which a developer should reconsider before deploying the database design. Visualizing the database design based on foreign-key relations gave a differ-ent view of the database than what the developers were used to. Normally they visualize the database based on functionality aspects, which does not give the same result. However, the visualization helps to give an overview of a database schema and the relations in a fast and understandable way.
One commented that PageRank did not rate many-to-many relational tables as central as he thought them to be. This is due to PageRank’s definition of centrality which considers only inbound edges. Besides this, he agreed on the ranks.
8
Limitations and Future Work
DBLint lays a foundation which can be extended in several directions. These directions include more rules, additional features in the metadata model, and analyzing more data sources such as: data, logs, code, stored procedures etc.
8.1
Database Model
DBLint is currently only extracting metadata from a database. In a future version it would be interesting to also extract the actual data in the database.
Analyzing the actual data would, e.g., enable DBLint to verify that the data
types match the actual data. Furthermore, data analysis would provide addi-tional information, enhancing the certainty of an issue.
All rules are applied on the entire model and all issues are reported each timeDBLintis executed. In a future version,DBLintcould take an incremental approach when examining databases. This would mean that only tables that has changed since last time is reexamined. Also the reporting of issues could be extended to highlight new issues which have emerged since the previous run.
8.2
Rules
We have a list containing 75 unimplemented rules which would look deeper into
extracting data and analyze on that, new possibilities for rules would arise. A rule such as finding missing foreign keys would become much more confident when analyzing data.
DBLint has some limitations in the analysis performed, in that it does not consider views, temporary tables, UDTs or check constraints. Extending
DBLint with support for these would give a broader analysis of the schema in question. For instance, some applications may have a physical model defined by
tables, and a logical model defined by views. As it is now,DBLintonly analyzes
the physical model.
8.3
Conceptual Improvements
All rules are designed to run with zero configuration, because it reduces the time required to get started. However, some rules would benefit from being
configurable, as the database design team could tailorDBLint to their project
by explicitly providing thresholds, conventions and setting severity levels of rules. For instance, a design team could have good reasons for allowing certain special characters in identifiers.
DBLint reports a list of potential design issues, and then the database de-signer is required to correct the issues manually. In some cases it would be useful if the tool suggested corrections, e.g. removing a redundant index.
9
Conclusion
In this paper we presented DBLint, a tool for automatic analysis of database
design. DBLint incorporates 25 design rules that checks for specific violations
of good database design practices. These are rules that can be applied to most schemas without requiring configuration. Therefore, the database designer can benefit from the tool with very little investment in time and money.
We presented a number of novel components that is not found in existing systems. These are calculation of centrality using PageRank, visualization, scor-ing and namscor-ing convention. We use centrality of tables in various contexts such as visualization, scoring and naming. The visualization component renders an overview of how tables are related based on foreign keys. Complex schemas are handled by decomposing the schema into smaller comprehensible clusters. The naming convention rule discovers the most common naming convention in a database, and reports any inconsistencies it may find. The naming convention rule is based on a Markov chain which is used to represent the syntax of all identifiers in the database.
DBLint outputs a detailed report of all issues reported by the rules. The report contains information such as descriptions of issues, tables, relationships
and various figures. Furthermore,DBLint provides a total score which
summa-rizes the overall quality of the schema. A score is also given to individual tables such that the worst tables are easy to identify.
The architecture was made with two main features in focus: extensibility and interoperability. The system is extensible in the sense that new rules can easily be added to the system. This gives database designers the option to develop more specialized rules that are relevant only for them. Interoperability
databases that provides a JDBC driver and has been tested on Oracle, SQL Server, MySQL and PostgresSQL.
DBLint has been evaluated on eight open-source schemas. The results show that the tool is able to find a large number of design issues in existing schemas. For instance, approximately 10% of all tables in these schemas are missing a
primary key. The fact thatDBLintis able to find issues in all schemas shows that
there is a need for such a tool. The rule execution time for each evaluated schema is approximately one second, including generation of graphs in the visualization component.
DBLint was used by two developer teams to examine deployed databases. The feedback from the involved database designers was positive and it substan-tiated our intuition of a need for a database design verification tool, to assist developers in keeping a consistent and high quality database design.
10
Acknowledgment
We would like to thank the database design team at Aveva Denmark for
eval-uatingDBLint and giving feedback. We would also like to thank Michael M.
Hansen from Aalborg University for evaluating and discussing the tool.
References
[1] S. Brin and L. Page. The anatomy of a large-scale hypertextual web search
engine. In Seventh International World-Wide Web Conference (WWW
1998), 1998. URL http://ilpubs.stanford.edu:8090/361/.
[2] S. C. Johnson. Lint, a C Program Checker. InCOMP. SCI. TECH. REP,
pages 78–1273, 1978.
[3] Pylint. http://www.logilab.org/857. Retrieved on January 7th, 2011.
[4] Lint4j. http://www.jutils.com/. Retrieved on January 7th, 2011.
[5] Nathaniel Ayewah, William Pugh, J. David Morgenthaler, John Penix, and YuQian Zhou. Evaluating static analysis defect warnings on production
software. In Proceedings of the 7th ACM SIGPLAN-SIGSOFT workshop
on Program analysis for software tools and engineering, PASTE ’07, pages 1–8, New York, NY, USA, 2007. ACM. ISBN 978-1-59593-595-3.
[6] John Currier. SchemaSpy. http://schemaspy.sourceforge.net.
Re-trieved on January 7th, 2011.
[7] Sualeh Fatehi. SchemaCrawler. http://schemacrawler.sourceforge.
net. Retrieved on January 7th, 2011.
[8] Embarcadero. Schema Examiner. http://www.embarcadero.com/
products/schema-examiner. Retrieved on January 7th, 2011.
[9] SSW. SQL Auditor. http://www.ssw.com.au/ssw/SQLAuditor/.
[10] Mario Piattini, Coral Calero, and Marcela Genero. Table oriented metrics
for relational databases. Software Quality Control, 9:79–97, June 2001.
ISSN 0963-9314. doi: 10.1023/A:1016670717863. URL http://portal.
acm.org/citation.cfm?id=599123.599199.
[11] Coral Calero, Mario Piattini, and Marcela Genero. A case study with
relational database metrics. In Proceedings of the ACS/IEEE
Interna-tional Conference on Computer Systems and Applications, Washington,
DC, USA, 2001. IEEE Computer Society. ISBN 0-7695-1165-1. URL
http://portal.acm.org/citation.cfm?id=872017.872249.
[12] Daniel L. Moody. Metrics for evaluating the quality of entity relationship
models. InProceedings of the 17th International Conference on
Concep-tual Modeling, ER ’98, pages 211–225, London, UK, 1998. Springer-Verlag.
ISBN 3-540-65189-6. URL http://portal.acm.org/citation.cfm?id=
647520.727704.
[13] Ernest Teniente, Carles Farré, Toni Urpí, Carlos Beltrán, and David Gañán.
SVT: schema validation tool for microsoft SQL-server. In Proceedings of
the Thirtieth international conference on Very large data bases - Volume 30, VLDB ’04, pages 1349–1352. VLDB Endowment, 2004. ISBN
0-12-088469-0. URLhttp://portal.acm.org/citation.cfm?id=1316689.1316831.
[14] George Reese. Java Database Best Practices. O’Reilly & Associates, Inc.,
Sebastopol, CA, USA, 2003. ISBN 0596005229.
[15] Steve McConnell. Code Complete, Second Edition. Microsoft Press,
Red-mond, WA, USA, 2004. ISBN 0735619670.
[16] Brian D. Hahn. Essential MATLAB for Scientists and Engineers.
Butterworth-Heinemann, Newton, MA, USA, 4th edition, 2009. ISBN
0123748836.
[17] Robert Tarjan. Depth-first search and linear graph algorithms. InSwitching
and Automata Theory, 1971., 12th Annual Symposium on, pages 114 –121, 1971. doi: 10.1109/SWAT.1971.10.
[18] Magento. http://www.magentocommerce.com. Retrieved on January 7th,
2011.
[19] Michelle Girvan and M. E. J. Newman. Community structure in social and
biological networks. Proc. Natl. Acad. Sci. USA, 99:8271–8276, 2002.
[20] Fang Wu and Bernardo A. Huberman. Finding communities in linear time:
A physics approach.CoRR, cond-mat/0310600, 2003. URLhttp://arxiv.
org/abs/cond-mat/0310600. informal publication.
[21] JDBC 4.0 API Specification. http://www.jcp.org/en/jsr/detail?id=
221. Retrieved on January 7th, 2011.
[22] Drupal. http://drupal.org. Retrieved on January 7th, 2011.
[23] Joomla! http://www.joomla.org. Retrieved on January 7th, 2011.
[25] Moodle. http://www.moodle.org. Retrieved on January 7th, 2011.
[26] phpBB. http://www.phpbb.com. Retrieved on January 7th, 2011.
[27] Prestashop. http://www.prestashop.com. Retrieved on January 7th,
2011.
Appendix
A
Markov Chain
Figure 9: Markov chain representing the naming convention of a large ERP system. The numerous states and transitions indicate a complex or non-existent naming convention.
core_website core_store core_store_group eav_entity_type catalog_product_entity eav_attribute_set customer_entity sales_flat_order eav_attribute catalog_category_entity catalog_product_option rating rating_entity catalog_product_link_type sales_flat_shipment sales_flat_quote catalog_product_entity_datetime catalog_product_entity_decimal catalog_product_enabled_index directory_country_region_name directory_country_region directory_country_format directory_country catalog_product_entity_gallery design_change catalog_product_entity_int dataflow_profile_history dataflow_profile dataflow_batch_import dataflow_batch dataflow_import_data dataflow_session catalog_product_entity_varchar catalog_product_entity_tier_price customer_group catalog_product_entity_text catalog_product_entity_media_gallery_value catalog_product_entity_media_gallery log_url_info log_visitor log_visitor_info log_visitor_online log_summary_type log_url catalog_category_product_index_enbl_idx catalog_category_product_index_enbl_tmp catalog_category_product_index_idx catalog_category_product_index_tmp paygate_authorizenet_debug catalog_compare_item paypal_api_debug catalog_eav_attribute downloadable_link_title downloadable_link paypal_settlement_report_row paypal_settlement_report catalog_product_bundle_option_value catalog_product_bundle_option downloadable_sample_title downloadable_sample admin_user admin_rule admin_role downloadable_link_price admin_assert downloadable_link_purchased_item downloadable_link_purchased api_rule api_role catalog_product_bundle_price_index api_assert catalog_product_bundle_stock_index adminnotification_inbox catalog_product_bundle_selection directory_currency_rate api_session api_user paypaluk_api_debug product_alert_price product_alert_stock poll_store poll catalog_category_entity_varchar catalog_category_entity_int eav_entity_store catalog_category_entity_text eav_entity_int eav_entity catalog_category_entity_datetime eav_entity_decimal catalog_category_entity_decimal eav_entity_datetime catalog_category_anc_products_index_tmp catalog_category_anc_categs_index_tmp catalog_category_anc_products_index_idx catalog_category_product_index eav_attribute_label catalog_category_product eav_entity_attribute eav_attribute_group eav_attribute_option_value eav_attribute_option rating_option_vote rating_option review rating_option_vote_aggregated rating_store rating_title report_compared_product_index report_event report_event_types report_viewed_product_index gift_message review_detail eav_form_type_entity eav_form_type googlebase_attributes googlebase_types eav_entity_text catalog_category_anc_categs_index_idx eav_entity_varchar eav_form_element eav_form_fieldset eav_form_fieldset_label core_cache_tag core_cache catalog_product_option_title core_config_data catalog_product_option_price core_cache_option cms_page_store cms_page cms_block_store cms_block core_email_template core_flag catalog_product_relation catalog_product_option_type_price catalog_product_option_type_value catalog_product_option_type_title catalog_product_super_attribute_pricing catalog_product_super_attribute catalog_product_super_link catalog_product_super_attribute_label catalog_product_index_price_opt_tmp catalog_product_index_price_opt_idx core_translate catalog_product_index_tier_price core_url_rewrite catalog_product_index_price_tmp core_resource core_session core_variable_value catalog_product_index_website core_layout_link core_layout_update catalog_product_link_attribute_decimal catalog_product_link catalog_product_link_attribute catalog_product_link_attribute_int catalog_product_link_attribute_varchar customer_address_entity_datetime customer_address_entity coupon_aggregated_order catalog_product_index_price_cfg_opt_idx cron_schedule catalog_product_index_price_cfg_opt_agr_tmp customer_address_entity_text catalog_product_index_price_cfg_opt_agr_idx customer_address_entity_varchar catalog_product_index_price_bundle_tmp customer_address_entity_decimal catalog_product_index_price_bundle_sel_tmp customer_address_entity_int catalog_product_index_price_opt_agr_idx catalog_product_index_price_opt_agr_tmp catalog_product_index_price_final_tmp catalog_product_index_price_idx catalog_product_index_price_cfg_opt_tmp coupon_aggregated catalog_product_index_price_final_idx catalog_product_index_eav_tmp customer_entity_decimal catalog_product_index_eav_idx customer_entity_int customer_entity_text customer_entity_varchar catalog_product_index_eav_decimal catalog_product_index_eav catalog_product_index_eav_decimal_tmp dataflow_batch_export
catalog_product_index_eav_decimal_idx catalog_product_index_price_bundle_idx catalog_product_index_price_bundle_opt_idx
catalog_product_index_price_bundle_opt_tmp catalog_product_index_price_bundle_sel_idx customer_eav_attribute customer_entity_datetime catalog_product_index_price sendfriend_log salesrule_label salesrule tag_properties tag sitemap shipping_tablerate tax_calculation tax_class tax_calculation_rule tax_calculation_rate tag_relation tag_summary sales_refunded_aggregated sales_recurring_profile_order sales_recurring_profile sales_shipping_aggregated sales_refunded_aggregated_order sales_shipping_aggregated_order salesrule_coupon_usage salesrule_coupon salesrule_customer checkout_agreement_store checkout_agreement catalogsearch_result catalogsearch_query catalogsearch_fulltext catalogrule_product_price catalogrule_product catalogrule cataloginventory_stock_status_tmp catalogrule_group_website catalogrule_affected_product cataloginventory_stock_status_idx cataloginventory_stock_status cataloginventory_stock cataloginventory_stock_item catalogindex_price catalogindex_minimal_price catalogindex_eav catalogindex_aggregation_to_tag catalogindex_aggregation_tag catalogindex_aggregation widget tax_order_aggregated_created tax_calculation_rate_title widget_instance_page_layout wishlist_item wishlist catalog_product_website sales_flat_creditmemo_comment sales_flat_creditmemo sales_flat_creditmemo_grid log_customer index_process_event index_process index_event googlebase_items googleoptimizer_code googlecheckout_api_debug log_quote log_summary sales_flat_invoice_grid sales_flat_invoice sales_flat_invoice_comment sales_flat_creditmemo_item sales_flat_order_grid sales_flat_order_address sales_flat_invoice_item review_entity_summary sales_bestsellers_aggregated_daily review_store sales_bestsellers_aggregated_yearly sales_bestsellers_aggregated_monthly sales_billing_agreement_order sales_billing_agreement sales_flat_shipment_grid sales_flat_shipment_item sales_flat_shipment_comment sales_payment_transaction sales_flat_order_payment sales_order_tax sales_order_aggregated_created sales_invoiced_aggregated_order sales_invoiced_aggregated sales_flat_shipment_track sales_flat_order_item sales_flat_order_status_history sales_flat_quote_payment sales_flat_quote_item_option sales_flat_quote_item sales_flat_quote_shipping_rate sales_flat_quote_address sales_flat_quote_address_item review_entity
Figure 10: Magento spiderweb without clustering.