Pressure gradient e
ff
ects on wake flow instabilities behind
isolated roughness elements on re-entry capsules
Alexander Theiss, Sascha Leyh and Stefan Hein DLR, Institute of Aerodynamics and Flow Technology
Bunsenstr. 10, 37073 Göttingen, Germany [email protected]·[email protected]
Abstract
Laminar-turbulent transition caused by modal disturbance growth in the wake flow of isolated roughness elements on blunt re-entry capsules is studied numerically at typical cold hypersonic wind tunnel condi-tions. Two fundamentally different heat shield shapes are considered. On the sphere-cone forebody the wake flow of the roughness is exposed to an adverse pressure gradient, whereas the spherical heat shield exhibits a strongly favourable pressure gradient. The pressure gradient effects on the development of the stationary wake flow and its modal instability characteristics are discussed for various heights and diam-eters of the cylindrical roughness element. Regions of increased shear develop in its wake which persist longer in the adverse pressure gradient case. Consequently, the results of spatial two-dimensional eigen-value analyses reveal that the unstable wake flow region extends much further downstream and the wake mode instabilities are considerably more amplified. The disturbance kinetic energy production terms are used to assess the contributions of the different shear-layer regions to the mode growth and its dependence on the pressure gradient.
1. Introduction
Accurate prediction of boundary layer transition on space re-entry vehicles is critical to design improvements of the thermal protection system (TPS). Entering aft-end first from space into a planet‘s atmosphere, the heat shield of a re-entry capsule has to withstand very high heat loads. Due to a lack of appreciation and understanding of the physics of transition on such blunt vehicles, the design philosophy so far assumed a fully turbulent flow in flight at all times leading to an over-dimensioning of the TPS, associated with cutbacks on the feasible payload. One possibility to carry more cargo with the same overall weight is to reduce the mass of the heat shield while keeping the level of safety constant. This can be achieved by applying more advanced (lighter) TPS materials or by taking all relevant flow regimes into account. For a potential TPS weight reduction, it is absolutely essential to correctly estimate the expected heat transfer while taking all laminar flow regions and the transition location into consideration.
The boundary layer on capsules with a spherical forebody does not feature any amplified modal disturbances at hypersonic speeds and typical ground-based wind tunnel conditions.35 The strong favorable pressure gradient keeps
the first mode stable and amplified second-mode disturbances do not occur due to subsonic to transonic post-shock boundary layer edge Mach numbers. Moreover, the spherical shape does not promote sufficient crossflow and its convex nature prevents Görtler instabilities. In contrast, capsules with a sphere-cone shape exhibit amplified first-mode and crossflow instabilities at similar freestream conditions (depending on the cone angle).8, 38
There exist several sources of instability and mechanisms that accelerate the laminar-turbulent transition process, which are specific to hypersonic flows over blunt capsules. One of them is out-gassing from an ablative heat shield. Li et al.24 demonstrated the destabilizing effect of ablation-induced out-gassing on a boundary layer flow over a
hemispherical capsule which otherwise did not support amplification of instability modes. Ablation of the heat shield can also cause the formation of a distributed surface micro-roughness pattern, which in turn can lead to an earlier boundary-layer transition compared to the smooth wall case. Experimental investigations on premature boundary layer transition due to distributed roughness effects on re-entry capsules have been conducted by Grossir et al.15 (EXPERT vehicle at Mach 14), Hollis18 (sphere-cone and hemisphere geometries at Mach 6) and Leidy et al.22 (Orion Crew Exploration Vehicle (CEV) at Mach 6). A different common type of roughness for realistic re-entry vehicles are discrete roughness elements, such as attachment-point cavities, compression pads, gaps or steps between heat shield
tiles or unevenly ablated TPS material. A single protuberance element can also trigger the laminar-turbulent boundary transition in its wake or even cause bypass transition if the roughness height/cavity depth is sufficiently large, though it is not as effective as distributed roughnesses with the same height (see Reda31and Reda et al.32).
Amar et al.2and Berger4demonstrated the effect of isolated protuberances on the laminar to turbulent transition on the Orion CEV capsule in wind tunnel experiments at low enthalpy conditions. Tripping of the boundary layer was achieved with diamond-shaped discrete roughness elements to evaluate the effectiveness of the trips (Amar et al.2) and to obtain turbulent forebody heating data for comparison with computational predictions (Berger4). Tanno
et al.34 and Marineau et al.27 investigated the boundary layer transition on an Apollo-shaped capsule at high enthalpy
conditions and also used discrete roughnesses to induce transition on the leeside of the model. An overshoot in heat transfer downstream of the roughness followed by a progressive relaxation to computed turbulent values was observed by Marineau et al.,27 whereby the amplitude of the overshoot increased with protuberance height. Direct numerical
simulations (DNS) of Chang et al.9 for surface irregularities (protuberance and cavity) on the CEV at wind tunnel
conditions revealed that a roughness sticking out of the surface is more effective to trigger transition than a cavity at identical roughness Reynolds number (Rekk) and Reynolds number values. An extensive summary of experimental
work, which focuses on roughness related transition in hypersonic boundary layers on blunt bodies is given by Reda31
and Schneider.33
The mechanisms leading to transition behind a three-dimensional roughness are only partly understood, but work on mainly super- and hypersonic roughness-induced transition (carefully conducted experiments,20, 40extensive
DNS simulations5, 13, 19, 28, 39and results from global,26two-dimensional linear eigenvalue (LST-2D)10, 12, 14, 36and
three-dimensional parabolized (PSE-3D)37, 39instability analyses) have considerably increased the knowledge in the recent
years. However, most investigations have been performed on flat plates with a zero pressure gradient (ZPG) and a detailed study on the influence of different pressure gradients on roughness wake flow instabilities is still missing. Theiss and Hein36 and Theiss et al.37 used LST-2D to characterize the most amplified wake modes behind different roughness elements in the symmetry plane of an Apollo-shaped capsule model and showed that the zone of modal amplification was much shorter in comparison to the length scales computed by Choudhari et al.10, 12 for a roughness element with similarRekkvalues in a flat plate flow. The authors speculated that the deviations to the ZPG result origin
in the strong favorable pressure gradient (FPG) on the capsule forebody. Recently, Plogmann et al.29 experimentally investigated the effect of different pressure gradients on the mode amplitudes behind a cylindrical roughness element in the incompressible flow regime. The authors reveal that in the near wake of the roughness the amplitude of the leading mode is very weakly dependent on the pressure gradient. However, the amplitude in the favorable pressure gradient case is slightly lower compared with the zero and adverse pressure (APG) case. For the far wake region, the authors report that the leading mode is damped in the FPG case, whereas in the ZPG and APG case the amplitude remains at a nearly constant level before being slightly damped.29 A similar observation is also mentioned in the work by Chang et
al.9
The present paper provides a continuation of our previous work (see Refs. 36, 37) on wake flow instabilities behind an isolated roughness element on the forebody of a blunt generic re-entry capsule at cold hypersonic flow conditions. The intent of this paper is to clarify the effect of different pressure gradients on discrete roughness-induced transition. This work focuses on the instability properties of the streaky wake flow behind a cylindrical roughness element located in the adverse pressure gradient region of a 50◦sphere-cone capsule. Results from laminar basic flow computations for several roughness heights and diameters at similar roughness Reynolds numbers,Rekk, and identical
slenderness ratios,d/k, as in our previous studies (Apollo-shaped capsule with a strong favorable pressure gradient), will be presented and the wake flow instability characteristics will be analyzed with the help of spatial two-dimensional instability theory. The influence of different pressure gradients (spherical capsule forebody versus sphere-cone shape) on the various types of wake modes, the length of the amplified wake flow region and the maximum cumulative amplification ratios (N-factors) will be discussed.
2. Numerical methods
The first part of this section provides an overview of the investigated capsule configurations and the applied freestream conditions for the numerical simulations. Details about the laminar basic flow computations are subsequently given for the sphere-cone capsule without and with an isolated roughness element located on the conical part of the cap-sule forebody. Subsection 2.3 explains the two-dimensional linear stability theory used to characterize the wake flow instabilities behind the isolated roughness element.
Apollo
MSL,θ =50◦ Figure 1: Investigated cap-sule forebody geometries.
Table 1: Overview of investigated freestream conditions.
Model AOA [◦] Re
∞[1/m] Ma p∞[Pa] T∞[K] Twall[K]
50◦-MSL 16 24.05×10⁶ 6.02 2090 63.8 300
Apollo 24 10.00×10⁶ 5.9 764.9 59.0 295
2.1 Capsule models and freestream conditions
The first model studied is an Apollo-shaped capsule with a base diameter ofD=170 mm. This geometry features a strong favorable pressure gradient on the spherical forebody. The second configuration with an APG is a variant of the Mars Science Laboratory vehicle with a sphere-cone forebody and a base diameter ofD=152.4 mm (50◦-MSL). An overview of the investigated forebody shapes is given in Fig. 1. The freestream values for the laminar basic flow computations were determined from wind tunnel conditions to match the experiments of Ali et al.1 for the Apollo
capsule and Hollis et al.17 for the MSL configuration and are summarized in Table 1.
2.2 Laminar basic flow computation
This subsection outlines the meshing strategies and the numerical tools used to simulate a generic re-entry capsule at hypersonic flow conditions without and with an isolated cylindrical roughness element on its forebody. The focus here is on the MSL configuration and details about the basic flow computations for the Apollo-shaped model can be found in Refs. 35, 36. Furthermore, section 2.2.2 includes considerations on the optimal roughness position to work out the effects of an APG on wake flow instabilities.
2.2.1 Smooth capsule configuration
The unperturbed boundary layer flow on the inclined MSL surface is computed on block-structured grids using a second-order accurate AUSMDV upwind scheme, as implemented in DLR’s finite-volume compressible Navier-Stokes flow solver FLOWer.30A grid convergence study was performed (details can be found in Ref. 25) and the singularity-free, shock-adapted mesh has about 12.1×10⁶points with at least 100 cells in the boundary layer. Due to the short operating times of the wind tunnel, a uniform isothermal wall boundary condition was imposed (see Table 1).
2.2.2 Capsule with isolated roughness element
A cylindrical roughness element of various heights and diameters is placed in the leeward symmetry plane on the conical part of the capsule forebody. Only half of the element was simulated in the truncated computational domain (depicted in Fig. 2), exploiting the azimuthal symmetry of the flow field. The approach of using a smaller domain for the simulations with roughness element substantially decreased the required number of points for the laminar basic flow computations. As an additional benefit, the truncated domain is located below the bow shock, so a 2nd-order central scheme was chosen for the spatial discretization in order to speed up the simulations.
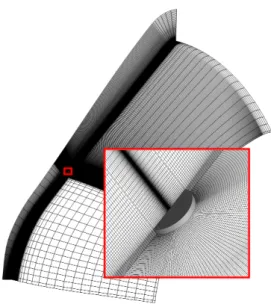
Figure 3 depicts the structured grid used to discretize the flow field around the sharp edged roughness elements (only every 4th grid point is shown). To maintain a reasonable computational effort, clustering of grid points towards the element in all direction was applied and the mesh consists of approximate 150×106points with about 1100, 260, and 300 points behind the roughness in streamwise, spanwise, and wall-normal direction, respectively. The mesh topology, as well as the number of grid points, is identical to the one of our previous studies (see Refs. 36, 37). Nevertheless, grid convergence was also checked.23
The cylindrical roughness element is placed on the conical part of the capsule at x2/R = 0.45. As indicated
in Fig. 4, at this position the protuberance is in the APG region and exhibits an adequate margin towards both the FPG region on the spherical nose part and the downstream position where first-mode instabilities start to grow (see Refs. 8, 25, 38). The objective of this work is to exclusively study convective wake flow instabilities and to exclude hybrid modes with significant fluctuations in the wake region as well as in the outer region. The solid lines in Fig. 4
1 3 2 Ma=6.02 16◦ Ma Θ d k Front view R x2 x1 x3 Stagnation Point Flow Top view 0.5 1.5 2.5 3.5 4.5 5.5 1: Symmetry 2: No Slip 3: Supersonic Outflow others: Dirichlet
Figure 2: Scheme of the truncated domain used for the roughness wake flow simulations with the specified boundary conditions.
Figure 3: Detail of the computational grid with close-up near the roughness position. Only every 4th point is shown for clarity.
show the evolution of the roughness heightkalong the capsule surface at constant roughness Reynolds numbers (the values that are used in this work). The roughness Reynolds number,Rekk, is based on the roughness heightkand the
flow values of the unperturbed basic flow at that height. For the chosen roughness position, it is assumed that a shock will not occur above the cylinder, due to a sufficient vertical margin towards the sonic roughness Mach number Mak,
which is also defined with the values of the unperturbed basic flow at the roughness edge.
Mak =1.2 Mak =1.0 Mak =0.8 Mak =0.5 Mak =0.2 Rekk=150 Rekk=254 Rekk=348 Rekk=424 first mode 0 30 60 90 120 150 0.2 0.3 0.4 0.45 0.5 0.6 0.7 x2/R[−] k [ µ m] favorable pressure gradient amplified
Figure 4: Evolution of the resulting roughness height along the 50◦-MSL capusle centerline at fixed roughness Reynolds number. The vertical dashed line atx2/Rmarks
the roughness position.
300 600 original domain reduced domain 0 0.2 0.4 0.6 0.8 0 z [mm] u[m/s] 0 0.2 0.4 0.6 0.8 z [mm] 300 340 380 T[K] 0 0.2 0.4 0.6 0.8 z [mm] 0.29 0.33 0.37 ρ[kg/m3]
Figure 5: Comparison of boundary layer profiles for the smooth sphere-cone capsule computed in the original and in a reduced domain,x2/R=0.45.
The numerical boundary conditions imposed are those as depicted in Fig. 2. Converged basic flow data without the protuberance element on the capsule are specified on all sides of the computational domain via a Dirichlet boundary condition, except for the wall, the outflow region, and the capsule zero meridian, where the no-slip, supersonic outflow, and symmetry conditions are set, respectively. The suitability of the Dirichlet boundary condition was checked by simulating the reduced domain without disturbance element. The boundary layer profiles of the converged flow within the smaller domain show a very good agreement with the original solution as depicted in Fig. 5 for the roughness location as an example.
2.3 Two-dimensional linear stability theory - LST-2D
The wake flow behind an isolated roughness element has a strong inhomogeneous character in both wall-normal and spanwise direction. Thus, the conventional linear stability analysis, which is based on the assumption of inhomogeneity in just one spatial direction, is not appropriate to analyze the stability characteristics of wake flows and a 2D eigenvalue problem is solved instead.
The LST-2D is based on the non-dimensional version of the compressible Navier-Stokes equation and analogue to the ansatz of classical linear stability theory. All flow quantitiesq=ρ,u,v,w,TTare split into their steady primary
stateqand unsteady perturbation part˜q:
q(x,y,z,t)=q(y,z)+˜q(x,y,z,t), 1, (1)
whereby the primary stateqand the total flow fieldqare assumed to satisfy the Navier-Stokes equations. However, two spatial inhomogeneous directions are simultaneously resolved on a plane (wall normalzand spanwise y direc-tion), whereas spatial homogeneity in the third direction is assumed (streamwisexdirection). The infinitesimal three-dimensional perturbations˜qare inhomogeneous inzandyand periodic inx. After applying the modal perturbation ansatz˜q, one may write
˜q(x,y,z,t)=qˆ(y,z)Θ(x,t)+c.c., Θ =exp [i(αx−ωt)], (2) withqˆdefining the vector of the two-dimensional complex amplitude functions in a plane perpendicular to thex-axis,Θ representing the complex phase function andc.c.denoting the complex conjugate. The LST-2D equations are obtained by substituting the perturbed state (Eqn. 1) into the Navier-Stokes equation, assuming local parallel flow, subtracting out theO(1) basic flow terms and neglecting terms at (O(2)). In this work, the spatial framework is used to study convective wake flow instabilities. Therefore,ωis real and linked with the circular frequency of an eigenmode˜q, while
αis the complex eigenvalue and its associated eigenvectorsqˆare to be sought. The real partαr=< {α}is related with
the wavenumber of˜qalong the homogeneous directionxwith wavelengthλx=2π/αr, whereas the imaginary part,αi= = {α}, is its growth/damping rate. A negative value ofαistands for spatial growth of the eigenmode, while a positive
value denotes spatial decay of˜q. After discretization, a two-dimensional Generalized Eigenvalue Problem (GEVP) can be formed, but the resulting system is non-linear in eigenvalueα. The companion matrix method7is used to convert
the system into a linear eigenvalue problem by defining the auxiliary vectorqˆ+=hρ,ˆ uˆ,vˆ,wˆ,Tˆ, αuˆ, αvˆ, αwˆ, αTˆiT. The resulting two-dimensional GEVP is:
Aqˆ+=αBqˆ+. (3)
2.3.1 Boundary conditions
Adequate boundary conditions must be specified for the disturbance variables to solve the GEVP (Eqn. 3). No-slip, isothermal boundary conditions are imposed at the wall, i.e., ˆu = vˆ = wˆ = Tˆ = 0. In wall-normal direction, the perturbations are forced to decay by imposing homogeneous Dirichlet conditions at the upper boundary, which is placed far away from the region of interest to avoid reflections. The symmetry at the capsule zero meridian is exploited by imposing symmetric ( ˆρy = uˆy = vˆ = wˆy = Tˆy = 0) and anti-symmetric ( ˆρ = uˆ = vˆy = wˆ = Tˆ =0) boundary
conditions to reduce the computational effort. Corresponding Dirichlet conditions are set on the opposing side.
2.3.2 Spatial discretization
Equation 3 is solved on a grid independent from the one used for the basic flow computations. The wall-normal and spanwise directions are discretized with stable high-order finite differences schemes of orderq(FD-q), developed by Hermanns and Hernández.16 For the present study, the sixth-order scheme (FD-q6) is used for both spatial directions. The number of discretization points was varied to ensure that the relevant flow quantities are insensitive to further improvement in grid resolution.23 All subsequent 2D spatial eigenvalue computations were performed with 89 points in spanwise and 101 points in wall-normal direction.
The interval of the non-uniform grid point distribution required by the FD-qscheme (η ∈[−1,1]) usually does not coincide with the physical domain of the problem studied (here: ξ ∈ 0, ξ
∞withξ=ˆy,z), therefore appropriate mappings need to be applied. In this work the same mapping function is chosen to cluster the points in the region of the roughness element wall normal extension and towards the symmetry plane
ξj=l 1−ηj 1+b+ηj , b=2l/ξ∞, l= ξ∞ξh ξ∞−2ξh , (4)
whereξ∞ denotes the location where the domain is truncated andξh represents the position where the number of
3. Results
In the following, results for the sphere-cone capsule will be presented for the flow cases summarized in Table 2. The roughness Reynolds numbers,Rekk, as well as the slenderness ratio,d/k, are similar to the cases investigated with a
cylindrical roughness element positioned in the leeward symmetry plane on the Apollo-shaped capsule (Cases 1–10 from Table 2 in Ref. 37) and corresponding results will also be shown again to facilitate comparisons. The differences in the laminar basic flow with regard to varying pressure gradients at equivalent roughness dimensions are addressed in the first subsection. In the second subsection, spatial 2D stability theory is used to work out the effect of roughness height on the instability properties, followed by considerations on the impact of the cylinder diameter in the last subsection.
Table 2: List of all investigated roughness dimensions.
Case k[µm] d[mm] d/k k/δ k/δ1 Rekk Mak 1 51.5 0.6866 13.33 0.094 0.587 150 0.49 2 82.2 0.6324 7.69 0.150 0.937 348 0.75 3 92.0 0.6134 6.67 0.168 1.048 424 0.83 4 69.0 0.6580 9.54 0.126 0.786 254 0.64 5 69.0 0.3450 5.00 0.126 0.786 254 0.64 6 69.0 0.4600 6.67 0.126 0.786 254 0.64 7 69.0 0.5750 8.33 0.126 0.786 254 0.64 8 69.0 0.6900 10.00 0.126 0.786 254 0.64 9 69.0 0.8050 11.67 0.126 0.786 254 0.64 10 69.0 0.9200 9.54 0.126 0.786 254 0.64
3.1 Laminar basic flow
Figure 6 illustrates the impact of a cylindrical element on the mean flow field for the two capsule configurations. At both investigated pressure gradients, the presence of the protuberance leads to a region of flow reversal both upstream and downstream of the roughness and to a formation of a counter-rotating vortex pair, known as the horseshoe vortex. The legs of the vortex bring down high-speed fluid from the outer region of the boundary layer towards the wall and transport low-speed fluid from the wall to the upper boundary layer region. This transport of momentum is known as the lift-up effect and generates streamwise velocity high and low-speed streaks,21 as depicted in Fig. 6 for different
downstream positions (s). The cylinder also induces a central low-speed streak due to the streamwise velocity blockage. The flow field along the capsule surface differs depending on the pressure gradient. The Mach number isocontours at z = 2/3 k for the 50◦-MSL capsule highlight the flow deceleration on the conical capsule part, whereas an almost constant acceleration occurs on the spherical forebody of the Apollo-shaped geometry. However, the spanwise profiles of streamwise velocity at selected locations behind the roughness trailing edge reveal a similar wake-flow development, though the amplitudes and spanwise gradients are more pronounced for the MSL capsule. Furthermore, both wake flows have in common, that due to the downwash motion of the vortices (high-momentum fluid from the upper boundary layer part is pushed towards the wall) the velocity deficit in the central low-speed streak region is first annihilated and then replaced by a high-speed streak. For the investigated different pressure gradients, the wake flow in the FPG case nearly relaxes towards the unperturbed state before it reaches the capsule shoulder, while for the APG condition a roughness-induced perturbation persists up to the end of the analyzed domain.
Figure 7 depicts the normalized wall-normal shear distribution in the symmetry plane at similar roughness Reynolds numbers (50◦-MSL capsule: Re
kk = 348, Apollo-shaped capsule: Rekk = 336) and identical
slender-ness ratio (d/k=7.69). In addition, the solid black line indicates the spatial extent of the upstream and downstream reversed flow, revealing an upward tilt of the rearward recirculation zone in the APG case. For both pressure gradi-ents, the intensity of the shear layer (originating at the roughness leading edge) decreases with downstream distance, whereas there is a second maximum in the wall-normal streamwise velocity gradient above the rear part of the reversed flow region on the 50◦-MSL capsule, accompanied by an increase in wall-normal distance of the detached shear layer. In the FPG case, the vertical position of the shear layer remains nearly unchanged, probably due to a much smaller increase in boundary layer height compared to the APG condition.
The thickening of the boundary layer on the sphere-cone geometry is also depicted in Fig. 8 in terms of isolines of the streamwise velocity component in spanwise planes at three different downstream locations behind the cylindrical
Ma:0.20 0.37 0.54 Ma:0.08 0.42 0.76 s=2 mm s=12 mm s=23 mm s=30 mm 40 80 120 160 -3 -1.5 0 1.5 3 u[m/s] y / d [-]
Apollo-shaped capsule,Rekk = 336 (FPG case)
s=2 mm s=12 mm s=23 mm s=41 mm 0 100 200 300 -3 -1.5 0 1.5 3 u[m/s] y / d [-] 50◦-MSL capsule,Re kk = 348 (APG case)
Figure 6: Mach number distribution (top row) and wake flow profiles of streamwise velocity (bottom row) ford/k= 7.69 atz = 2/3 k. s/d z / k -2 -1 0 1 2 3 4 0 2 4
Apollo-shaped capsule,Rekk = 336 (FPG case)
s/d z / k -2 -1 0 1 2 3 4 0 2 4 50◦-MSL capsule,Re kk = 348 (APG case)
Figure 7: Normalized wall-normal shear∂u/∂zdistribution in the symmetry plane around the roughness element with d/k=7.69. The reverse flow regions are visualized by black isolines of zero streamwise velocity.
roughness (Rekk = 348). The intermediate to far wake flow region is characterized by the central low-speed streak
with an upwelling of the flow, forming the typical mushroom-like structure, accompanied by an increase in boundary-layer thickness (compared to the unperturbed state). The central low-speed streak is surrounded by a pair of high-speed streaks with reduced boundary-layer thickness (solely one high-speed streak is visible since only one half of the plane is shown in Fig. 8). These streaks are characterized by high gradient regions, both in wall-normal and spanwise direction (see Fig. 8 top and bottom row).
3.2 Roughness height variation
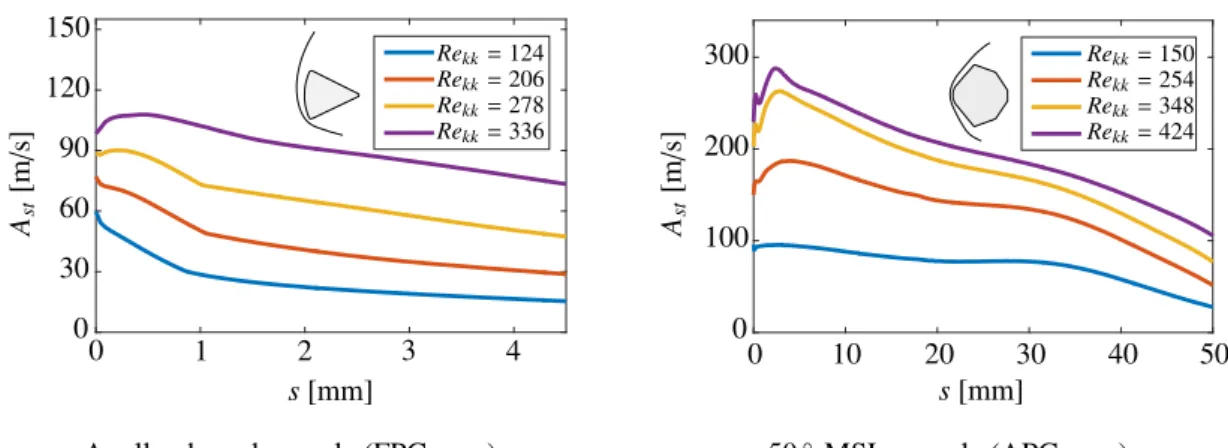
A meaningful characteristic variable to quantify the impact of a discrete roughness element on the mean flow is the streak amplitude,3, 10, 37defined as:
Ast= 1 2 " max y,z (u−ub)−miny,z (u−ub) # , (5)
whereu is the streamwise velocity andub denotes the undisturbed laminar basic flow. The evolution of the streak
amplitude along the capsules symmetry meridians is shown in Fig. 9 for four different roughness Reynolds numbers. For both considered capsule geometries, the streak amplitude increases with roughness height and generally decreases with distance downstream of the roughness trailing edge in the far wake region (s>5 mm). For the roughness nearfield (s <5 mm), a distinct increase in streak amplitude is present for the APG condition (and FPG withRekk ≥ 278), in
the region where the main contribution on the streak amplitude shifts from the central low-speed streak towards the high-speed streak of the vortex system (see also Fig. 6). A substantial decrease ofAstfor the sphere-cone shape occurs
y/d z / d 0 0.5 1 0 0.3 0.6 s=2 mm y/d z / d 0 0.5 1 0 0.3 0.6 s=12 mm y/d z / d 0 0.5 1 0 0.3 0.6 s=23 mm + -0 ∂u/∂z y/d z / d 0 0.5 1 0 0.3 0.6 y/d z / d 0 0.5 1 0 0.3 0.6 y/d z / d 0 0.5 1 0 0.3 0.6 + -0 ∂u/∂y
Figure 8: Spatial distribution of streamwise velocity wall-normal shear∂u/∂z(top row) and lateral shear∂u/∂y(bottom row) at three different planes behind the roughness element withRekk =348 on the 50◦-MSL capsule atd/k=7.69.
The black isolines indicate the basic stateu-velocity distribution and the dashed line represents the projection of the roughness element. Shears below 10 % of the absolute maximum are blanked out and due to the spanwise symmetry only the right half of the plane is shown.
the dampening effect of a favorable pressure gradient on roughness wake flows.
s[mm] Ast [m / s] 0 1 2 3 4 0 30 60 90 120 150 Rekk=124 Rekk=206 Rekk=278 Rekk=336
Apollo-shaped capsule (FPG case)
s[mm] Ast [m / s] Rekk=150 Rekk=254 Rekk=348 Rekk=424 0 10 20 30 40 50 0 100 200 300
50◦-MSL capsule (APG case)
Figure 9: Evolution of streak amplitude along the capsule symmetry plane for various roughness Reynolds numbers. The positions=0 indicates the roughness trailing edge.
Two-dimensional spatial instability analyses for the stationary mean flow for all flow cases from Table 2 reveal both amplified symmetric modes (also known as varicose mode) and amplified anti-symmetric modes (sinuous mode) with respect to the streamwise velocity fluctuation. In the following, results will only be presented for the most amplified symmetric mode (S1), in terms of maximum N-factor reached, and also for the most amplified anti-symmetric mode (A1). The integrated amplification rate, known as N-factor, is defined as
N=
Z s
s0
−αids, (6)
wheres0denotes the streamwise position where a disturbance starts to grow at a certain frequency.
The normalized mode shapes of the streamwise velocity fluctuation for the investigated dominant wake modes are visualized in Fig. 10 in a plane ats=2 mm and at the peak disturbance frequency leading to the highest N-factor, respectively. Note that the absolute value of the complex-valued disturbance amplitude functions is plotted. Although
y/d z / k f =164 kHz 0 -0.5 0 0.5 2 4 |uˆ| 0.05 0.5 0.95 y/d z / k f =488 kHz 0 -0.5 0 0.5 2 4 |uˆ| 0.05 0.5 0.95 y/d z / k f =125 kHz 0 -0.5 0 0.5 2 4 |uˆ| 0.05 0.5 0.95
Apollo-shaped capsule,Rekk=336 (FPG case)
y/d z / k f =253 kHz 0 -0.5 0 0.5 2 4 |uˆ| 0.05 0.5 0.95 50◦-MSL capsule,Re kk =348 (APG case)
Figure 10: Normalized amplitude functions of the most amplified varicose (top row) and sinuous mode (bottom row) for the peak disturbance frequency ats=2 mm andd/k=7.69. The black isolines indicate the basic stateu-velocity distribution and the dashed line represents the projection of the roughness element. Values|uˆ|<0.05 are blanked out.
the magnitude of the streamwise velocity amplitude function of the anti-symmetric modes appears to be symmetric, the corresponding fluctuations are opposite in phase. The velocity perturbation of the symmetric mode is concentrated near the top of the mushroom-like structure in a region with increased wall-normal shear (∂u/∂z, see the upper row of Fig. 8). On the other hand, the anti-symmetric mode peaks on either side of the mushroom structure where the spanwise shear (∂u/∂y) is large (see the lower row of Fig. 8). The amplitude functions of the dominant wake modes display strong similarities, though the roughness-induced mean flow distortion is more pronounced in the case of an APG, associated with a shift of the shear layers in wall-normal direction (see also Fig. 7).
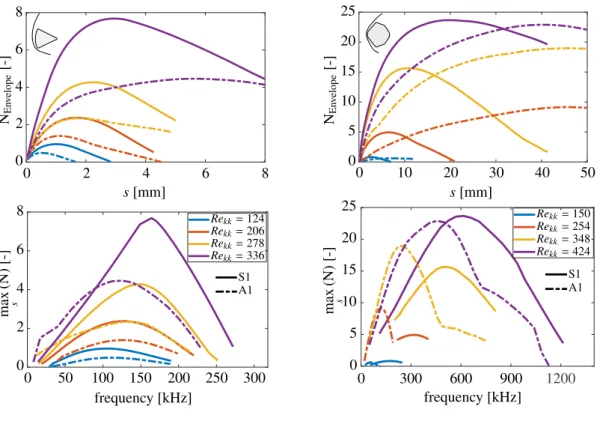
Because of the downstream recirculation zone behind the roughness and the formation of streamwise vortices, the wall-normal velocity component is included in the LST-2D for all sphere-cone cases. Figure 11 shows the N-factor envelope curves plotted versus the surface arc length for mode S1 (solid lines) and A1 (dashed lines) dependent on roughness Reynolds number. Note that the wall-normal velocity component had to be excluded for the production of mode S1 results on the Apollo capsule to prevent the avoided crossing phenomenon.37 Nevertheless, deviations in
local growth rate due to wall-normal velocity influences are in the order of 10 % and do not alter the trends presented in Fig. 11. For all roughness heights and both gradients considered, the dominant wake modes are already amplified at the first evaluation plane (similar to observations made by Choudhari et al.10, 11) and the maximum N-factor increases
with roughness height. In the case of a favorable pressure gradient, the symmetric mode S1 leads to the highest N-factor for all considered roughness Reynolds numbers, whereas there is no clear trend in the APG results. The maximum N-factor of mode A1 for the intermediate roughness Reynolds numbers (Rekk = 254 andRekk = 348) is
higher compared to the equivalent results for mode S1, while for the smallest and highest protrusion height the trend is inverted. The impact of a streamwise pressure gradient on the instability characteristics changes with the roughness Reynolds number. For the lowest value studied (Apollo-shaped capsule:Rekk =124, 50◦-MSL capsule:Rekk =150),
the maximum N-factors on the spherical forebody as well as on the sphere-cone shape are about one for the dominant varicose mode. However, with increasing protrusion height modes S1 and A1 are more amplified at APG conditions. The peak N-factor for either mode type is significantly larger forRekk>150, so an earlier laminar-turbulent transition
downstream of the cylinder on the 50◦-MSL capsule is expected for the investigated freestream conditions. On the other hand, higher roughness Reynolds numbers are needed to trip the boundary layer from a laminar to turbulent state on the Apollo-shaped capsule. For both forebody shapes considered, the dominant varicose mode S1 grows the fastest and may dominate the roughness-induced transition process, at least forRekk >254 and when the initial amplitudes of
both mode families are comparable. The spatial extent of the amplified wake flow region is significantly longer in an environment with a positive pressure gradient. The sinuous mode in the FPG case is amplified the furthest downstream, except forRekk=336 where the amplitude of mode A1 grows up to about twice the amplified distance of the symmetric
mode. In contrast, the dominant sinuous mode at APG conditions is always amplified the furthest downstream. The bottom row of Fig. 11 shows the maximum N-factor computed downstream of the roughness at its corre-sponding frequency. For both investigated pressure gradients, the peak disturbance frequencies are higher for mode S1 in comparison to mode A1. This observation is in qualitative agreement with the findings of Choudhari et al.10With in-creasing roughness Reynolds number, a broadening of the amplified frequency band occurs and the maximum N-factor appears at higher frequencies (except for mode A1 atRekk = 336 on the Apollo-shaped model). Figure 12 displays
0 0 2 4 6 8 2 4 6 8 s[mm] NEn v elope [-] 0 0 10 20 30 40 50 5 10 15 20 25 NEn v elope [-] s[mm] 0 50 100 150 200 250 300 2 4 6 8 Rekk=124 Rekk=206 Rekk=278 Rekk=336 S1 A1 0 frequency [kHz] max s (N ) [-]
Apollo-shaped capsule (FPG case)
0 300 600 900 1200 0 5 10 15 20 25 Rekk=150 Rekk=254 Rekk=348 Rekk=424 frequency [kHz] max s (N ) [-] S1 A1
50◦-MSL capsule (APG case)
Figure 11: N-factor envelope curves versus surface arc length for the most amplified wake modes (top row) and maxi-mum N-factor as a function of disturbance frequency (bottom row) for all investigated roughness Reynolds numbers.
roughness Reynolds numbers. A linear-like dependency ofFfromRekkexists for the dominant varicose mode in both
FPG and APG conditions. On the other hand, no clear trend is observable for the most amplified sinuous mode (not even if a reference length associated with the spanwise extent, such asd, is chosen). Hybrid modes on the sphere-cone geometry were not observed within this study, most likely due to a mismatch of the relevant frequency range (most unstable first-mode instability predicted at f ≈30 kHz25, 38).
0 100 200 300 400 0.5 1 1.5 2 Fmax s (N ) × 10 − 4[-] Rekk[-] Apollo 50◦-MSL S1 A1
Figure 12: Peak non-dimensional disturbance frequency as a function of roughness Reynolds number.
To obtain a better insight into the mechanisms of how the shear layers of the basic flow transfer energy into the wake modes, a helpful method is to calculate the kinetic energy transfer in planes downstream of the roughness.6, 26
The rate of change of kinetic energy is given by:
∂EK ∂t = 3 X i=1 3 X j=1 Pi,j−Φ, Pi,j= Z z Z y −τi,j∂ui ∂xj dydz, τi,j=ρuˆiuˆj, (7)
whereEKis the kinetic energy of the disturbance,Pi,jthe kinetic energy production term,Φthe viscous dissipation, and
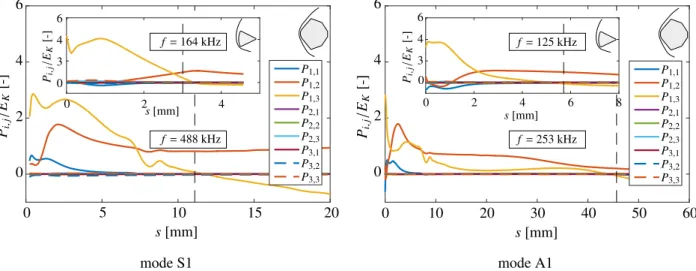
acts as stabilizing (negative sign) or destabilizing (positive sign) on the disturbance. Figure 13 shows the streamwise evolution of the kinetic energy production terms of mode S1 and A1 for the sphere-cone capsule at the peak disturbance frequency leading to the highest N-factor, respectively. The basic flow shear layers related to the streamwise velocity component (P1,1, P1,2,P1,3) have the biggest contribution to the energy transfer, which is in accordance with the results
obtained for the Apollo-shaped model37 (see inserts in Fig. 13). Depending on the streamwise pressure gradient, the
relevance of the different production terms on the overall energy transfer varies within the unstable wake flow region (the end of the amplified region is indicated by the vertical dashed line in Fig. 13).
In the case of the favorable pressure gradient, mode S1 essentially extracts its energy from the work of the Reynolds stressesτ1,3 =ρuˆwˆ against the wall-normal shear of the basic flow streamwise velocity component∂u/∂z.
This destabilizing effect of the wall-normal gradient diminishes as the central low-speed region starts to fade away, accompanied by the decrease in shear layer intensity (see Figs. 6 and 7). Once the counter-rotating vortex system establishes downstream of the element,P1,2has a positive contribution to the energy extraction process for both
dom-inant wake modes. The production termP1,1, related with the streamwise shear of the basic flow streamwise velocity
component, stabilizes the dominant wake modes, especially in the vicinity of the reverse flow region. In the case of the strong APG on the 50◦-MSL capsule, the trend is reversed andP
1,1destabilizes the dominant
wake modes (it is only stabilizing when the flow begins to accelerate again towards the capsule shoulder). The kinetic energy production for mode S1 is no longer solely dominated by theP1,3term. Within the amplified wake flow region,
a collaboration of mainly theP1,3term with theP1,2term is revealed, whereP1,3has the biggest integral contribution to
the overall energy production for the varicose mode andP1,2for the sinuous mode, respectively. The oscillation in the
regions=7−9 mm is caused by an interaction of expansion waves with the Dirichlet boundary condition at the upper boundary of the evaluation plane that is used in the instability analysis. Although the cylindrical roughness element is well submerged in the subsonic part of the boundary layer (see Fig. 4), the flow deflection above the roughness extends into the supersonic flow regime.
0 0 2 4 6 5 10 15 20 0 2 4 0 3 4 6 f=164 kHz f=488 kHz P1,1 P1,2 P1,3 P2,1 P2,2 P2,3 P3,1 P3,2 P3,3 Pi, j / EK [-] s[mm] Pi, j / EK [-] s[mm] mode S1 Pi, j / EK [-] s[mm] P1,1 P1,2 P1,3 P2,1 P2,2 P2,3 P3,1 P3,2 P3,3 Pi , j / EK [-] 0 2 4 6 0 10 20 30 40 50 60 s[mm] 0 3 4 6 2 4 6 8 f=125 kHz f=253 kHz 0 mode A1
Figure 13: Streamwise evolution of the kinetic energy production terms Pi,j for mode S1 (left) and A1 (right) at
Rekk = 348 for the 50◦-MSL capsule. The black dashed line marks the downstream end of the amplified wake flow
region for the indicated frequency. The inserts depict the equivalent results for the Apollo-shaped capsule atRekk =336.
3.3 Roughness diameter variation
In this subsection results from a systematic variation of the roughness slenderness ratio,d/k, at a fixed roughness height will be presented. Hence, the roughness Reynolds numberRekk remains unchanged, although differentRekk
values are used for the FPG and APG conditions. In our previous study for the Apollo-shaped capsule, the roughness width was varied atRekk =336. Depending on the roughness shape and slenderness ratio, avoided crossing occurred
in the vicinity of the roughness trailing edge, which could be an indication of the existence of an absolute instability. Furthermore, the results from the previous subsection revealed a significant increase in the cumulative amplification ratios at APG conditions. Therefore, a value ofRekk =254 is chosen for the present study to study only convective
instabilities and to work out the effect of different roughness widths on wake mode instabilities subjected to a positive streamwise pressure gradient.
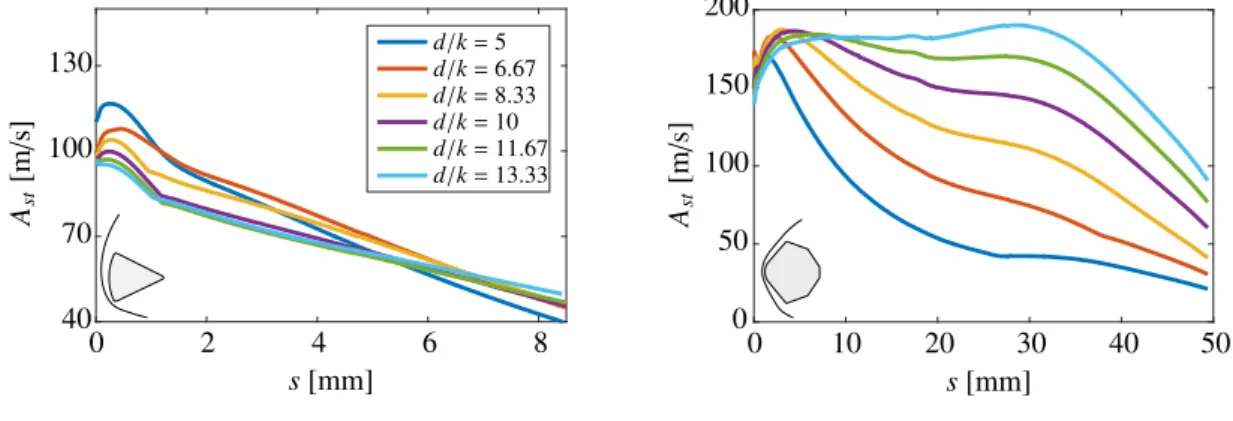
pressure gradients considered, the roughness induced perturbation decreases with increasing protuberance width for the roughness nearfield. However, the streak amplitude linearly reduces fors > 1 mm with increasing downstream distance at FPG conditions, whereas in the APG case a second maximum evolves with increasingd/kfollowed by a subsequent decrease in the region of flow acceleration. As a measure of roughness-induced perturbation, the evolution of the streak amplitude along the sphere-cone leeward line of symmetry indicates that with increasing roughness width, the amplified wake flow instabilities will likely need a longer distance to decay.
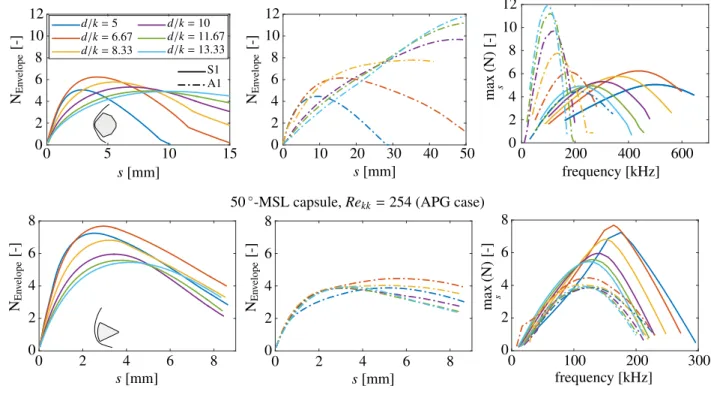
The instability results presented in Fig. 15 substantiate this hypothesis. The spatial extent of the amplified wake flow region increases withd/kfor both the most amplified varicose mode and the dominant sinuous mode at APG conditions, whereby the unstable region of mode A1 is about five times as long in comparison to the one of mode S1. In addition, the maximum N-factor reached for mode A1 also increases with the slenderness ratio (for the APG case), revealing a strong correlation with the streak amplitude for the far-wake region (both APG and FPG). The dominant varicose mode is known to be linked with the shear layers along the central low-speed region26, 37 (see also Fig.10)
and as soon as the destabilizing effect of the wall-normal gradient diminishes (see evolution ofP1,3term in Fig. 13),
mode S1 becomes damped. The intensity of the detached shear layer decreases with roughness width (see e.g. Fig. 22 in Ref. 37), resulting in lower N-factors for mode S1 at both FPG and APG conditions. On the other hand, the vortex cores of the horseshoe vortex are further apart, leading to a slower reduction of the velocity deficit in the central low-speed streak region (accompanied by a slower reduction of the wall-normal shear) and therefore supposedly to the longer spatial extent of the amplified wake flow region of mode S1 (both APG and FPG).
The amplified disturbance frequency band shrinks with increasing slenderness ratio for both dominant wake modes on the sphere-cone model, as well as for mode S1 on the Apollo-shaped capsule (see the outer right plots in Fig. 15), but remains nearly unchanged for mode A1 (FPG condition). Furthermore, the most amplified disturbance frequency also reduces with roughness width and the relevant range of frequencies is essentially smaller for the sinuous mode. Although the roughness Reynolds number is different, the most unstable frequencies for the dominant anti-symmetric mode are nearly the same at both investigated pressure gradients.
s[mm] Ast [m / s] 0 2 4 6 8 40 70 100 130 dd//kk==56.67 d/k=8.33 d/k=10 d/k=11.67 d/k=13.33
Apollo-shaped capsule,Rekk =336 (FPG case)
s[mm] Ast [m / s] 0 10 20 30 40 50 0 50 100 150 200 50◦-MSL capsule,Re kk=254 (APG case)
Figure 14: Evolution of streak amplitude along the capsule symmetry plane at various roughness slenderness ratios.
4. Summary and concluding remarks
Laminar steady basic flow computations were performed for a discrete cylindrical roughness element submerged in the boundary layer along the leeward symmetry plane of both an Apollo-like capsule and a MSL-like sphere-cone geome-try at cold hypersonic wind tunnel conditions and at an angle of attack, respectively. Starting from the stagnation point, the flow on the Apollo capsule accelerates towards the shoulder, exhibiting a favorable pressure gradient, whereas on the 50◦-MSL capsule, the flow is at first strongly accelerated over the spherical part followed by a distinct flow decel-eration on the conical part. The dimensions of the roughness element were varied in both height and diameter to study the roughness wake flow development and the inherent instabilities subjected to different streamwise pressure gradi-ents. The flow topology around the protuberance revealed a strong resemblance at both pressure gradients considered. Though, the roughness induced shear layers are longer preserved in an adverse pressure gradient (APG) environment. The streak amplitude, which is a measure of the perturbation caused by the surface inhomogeneity, increases with roughness height and reduces with the cylinder diameter for the roughness nearfield. For all investigated roughness di-mensions, the streak amplitude decays towards the shoulder in case of a favorable streamwise pressure gradient (FPG). However, depending on the roughness Reynolds number (Rekk) and the slenderness ratio (d/k), an additional maximum
NEn v elope [-] 0 2 4 6 8 10 12 0 5 10 15 s[mm] d/k=5 d/k=6.67 d/k=8.33 d/k=10 d/k=11.67 d/k=13.33 S1 A1 0 NEn v elope [-] 2 4 6 8 10 12 0 10 20 30 40 50 s[mm] frequency [kHz] 0 200 400 600 0 2 4 6 8 10 12 max s (N ) [-] 50◦-MSL capsule,Re kk =254 (APG case) NEn v elope [-] 0 s[mm] 2 4 6 8 0 2 4 6 8 NEn v elope [-] 0 s[mm] 2 4 6 8 0 2 4 6 8 frequency [kHz] 0 2 4 6 8 0 100 200 300 max s (N ) [-]
Apollo-shaped capsule,Rekk=336 (FPG case)
Figure 15: N-factor envelope curves versus surface arc lengths for the most amplified varicose mode (left column), sinuous mode (middle column), and maximum obtained N-factor as a function of disturbance frequency (right column) for all investigated slenderness ratios.
evolves far downstream of the element at APG conditions. Once the flow starts to accelerate again towards the shoulder on the 50◦-MSL capsule, the streak amplitude substantially decreases due to the upcoming negative pressure gradient. The instability properties of the streaky wake flow behind the cylinder were analyzed with the help of spatial two-dimensional instability theory (LST-2D), where the focus was on the most amplified symmetric (varicose) and anti-symmetric (sinuous) modes. It turned out that on the sphere-cone capsule (APG) the unstable wake flow region extends much further downstream and the wake mode instabilities are considerably more amplified in terms of modal N-factor data. For all considered roughness dimensions, the most amplified sinuous mode (A1) is the one that is always amplified the furthest downstream in the APG region, whereas in the FPG case this only holds for the highest roughness Reynolds number investigated (Rekk =336). However, the amplitude of the most amplified symmetric mode
(S1) grows the fastest (both in FPG and APG) and will most likely dominate the roughness-induced transition process above a critical threshold value, which has to be a function of height, planform shape, slenderness ratio, pressure gradient, and wall temperature. On the other hand, mode A1 grows slower in the beginning (both at FPG and APG conditions), but can reach higher N-factors downstream (only valid for the APG case).
An analysis of the disturbance kinetic energy production terms revealed, that the basic flow shear layers related to the streamwise velocity component have the biggest contribution to the energy transfer. In particular, the wall-normal shear layer, formed at the roughness leading edge, solely destabilizes mode S1 on the Apollo-shaped capsule, whereas mode S1 and A1 both originate from instability of the whole three-dimensional shear layer at the investigated APG conditions. Nonetheless, the varicose mode is mainly linked with the wall-normal shear, whereas the lateral shear has the biggest integral contribution to the energy transfer for the sinuous mode. The favorable pressure gradient reduces the growth of the dominant wake modes, whereas an adverse pressure gradient is destabilizing the wake.
5. Acknowledgments
References
[1] S. R. C. Ali, R. Radespiel, and A. Theiss. Transition experiment with a blunt Apollo shape like capsule in hypersonic Ludwieg tube. 63. Deutscher Luft- und Raumfahrtkongress 2014, Paper 2014-340270, 2014.
[2] A. Amar, T. Horvath, B. Hollis, K. Berger, S. Berry, and N. Calvert. Protuberance boundary layer transition for project orion crew entry vehicle. Paper 2008-1227, AIAA, 2008.
[3] P. Andersson, L. Brandt, A. Bottaro, and D. S. Henningson. On the breakdown of boundary layer streaks.J. Fluid
Mech., 428:29–60, 2001.
[4] K. T. Berger. Aerothermodynamic testing of the Crew Exploration Vehicle at Mach 6 and Mach 10. J Spacecr
Rockets, 46(4):758–765, 2009.
[5] M. Bernardini, S. Pirozzoli, P. Orlandi, and S. K. Lele. Parameterization of boundary-layer transition induced by isolated roughness elements. AIAA Journal, 52(10):2261–2269, 2014.
[6] L. Brandt. Numerical studies of the instability and breakdown of a boundary-layer low-speed streak. Eur. J.
Mech. B. Fluids, 26(1):64–82, 2007.
[7] T. Bridges and P. Morris. Differential eigenvalue problems in which the parameter appears nonlinearly.J. Comput.
Phys., 55(3):437–460, 1984.
[8] C.-L. Chang, M. Choudhari, B. Hollis, and F. Li. Transition analysis for the Mars Science Laboratory entry vehicle. Paper 2009-4076, AIAA, 2009.
[9] C.-L. Chang, M. Choudhari, B. S. Venkatachari, and F. Li. Effects of cavities and protuberances on transition over hypersonic vehicles. Paper 2011-3245, AIAA, 2011.
[10] M. Choudhari, F. Li, C.-L. Chang, J. Edwards, M. Kegerise, and R. King. Laminar-turbulent transition behind discrete roughness elements in a high-speed boundary layer. Paper 2010-1575, AIAA, 2010.
[11] M. Choudhari, A. Norris, F. Li, C.-L. Chang, and J. Edwards. Wake instabilities behind discrete roughness elements in high speed boundary layers. Paper 2013-81, AIAA, 2013.
[12] M. M. Choudhari, F. Li, M. D. Bynum, M. A. Kegerise, and R. A. King. Computations of disturbance am-plification behind isolated roughness elements and comparison with measurements. Paper 2015-2625, AIAA, 2015.
[13] J. P. J. P. V. den Eynde and N. D. Sandham. Numerical simulations of transition due to isolated roughness elements at Mach 6. AIAA Journal, 54(1):53–65, 2016.
[14] G. Groskopf and M. J. Kloker. Instability and transition mechanisms induced by skewed roughness elements in a high-speed laminar boundary layer.J. Fluid Mech., 805:262–302, 2016.
[15] G. Grossir, S. Paris, and O. Chazot. Evaluation of the effects of distributed roughness induced transition on the EXPERT vehicle. InInternational Planetary Probe Workshop 2010 (IPPW-7).
[16] M. Hermanns and J. A. Hernández. Stable high-order finite-difference methods based on non-uniform grid point distributions.Int. J. Numer. Methods Fluids, 56(3):233–255, 2007.
[17] B. Hollis, D. Liechty, M. Wright, M. Holden, T. Wadhams, M. MacLean, and A. Dyakonov. Transition onset and turbulent heating measurements for the Mars Science Laboratory entry vehicle. Paper 2005-1437, AIAA, 2005.
[18] B. R. Hollis. Distributed roughness effects on blunt-body transition and turbulent heating. Paper 2014-0238, AIAA, 2014.
[19] P. S. Iyer and K. Mahesh. High-speed boundary-layer transition induced by a discrete roughness element.J. Fluid
Mech., 729:524–562, 2013.
[20] M. A. Kegerise, R. A. King, M. Choudhari, F. Li, and A. T. Norris. An experimental study of roughness-induced instabilities in a supersonic boundary layer. Paper 2014-2501, AIAA, 2014.
[22] A. N. Leidy, E. Reshotko, F. Siddiqui, and R. D. W. Bowersox. Characterizing the transient growth mechanism on a hypersonic blunt body at a high angle of attack. Paper 2016-3951, AIAA, 2016.
[23] S. Leyh. Numerische Stabilitätsuntersuchung des Nachlaufs einer diskreten Rauigkeit auf einer Wiederein-trittskapsel. Master’s thesis, Technische Universität Berlin, 2017.
[24] F. Li, M. Choudhari, C.-L. Chang, and J. White. Effects of injection on the instability of boundary layers over hypersonic configurations. Phys. Fluids, 25(10):104–107–1–15, 2013.
[25] M. Lichtmes. Numerische Untersuchung zur Grenzschichtstabilität an der Atmosphäreneintrittskapsel des Mars Science Laboratory im hypersonischen Strömungsfeld. Master’s thesis, Hochschule Trier - Umwelt-Campus Birkenfeld, 2015.
[26] J.-C. Loiseau, J.-C. Robinet, S. Cherubini, and E. Leriche. Investigation of the roughness-induced transition: global stability analyses and direct numerical simulations.J. Fluid Mech., 760:175–211, 2014.
[27] E. Marineau, S. Laurence, and H. Hornung. Apollo-shaped capsule boundary layer transition at high-enthalpy in T5. Paper 2010-446, AIAA, 2010.
[28] O. Marxen, G. Iaccarino, and E. Shaqfeh. Numerical simulations of hypersonic boundary-layer instability with localized roughness. Paper 2011-567, AIAA, 2011.
[29] B. Plogmann, W. Würz, and E. Krämer. On the disturbance evolution downstream of a cylindrical roughness element.J. Fluid Mech., 758:238–286, 2014.
[30] J. Raddatz and J. K. Fassbender. Block structured navier-stokes solver FLOWer. InMEGAFLOW - Numerical
Flow Simulation for Aircraft Design, pages 27–44. Springer Berlin Heidelberg, 2005.
[31] D. C. Reda. Review and synthesis of roughness-dominated transition correlations for reentry applications. J
Spacecr Rockets, 39(2):161–167, 2002.
[32] D. C. Reda, M. C. Wilder, and D. K. Prabhu. Transition experiments on blunt bodies with isolated roughness elements in hypersonic flight.J Spacecr Rockets, 47(5):828–835, 2010.
[33] S. P. Schneider. Summary of hypersonic boundary-layer transition experiments on blunt bodies with roughness.
J Spacecr Rockets, 45(6):1090–1105, 2008.
[34] H. Tanno, T. Komuro, K. Sato, K. Itoh, R. P. Lillard, J. Olejniczak, and J. H. Grinstead. Aeroheating measurement of Apollo shaped capsule with boundary layer trip in the free-piston shock tunnel HIEST. Paper 2014-0434, AIAA, 2014.
[35] A. Theiss, S. R. Ali, S. Hein, D. Heitmann, and R. Radespiel. Numerical and experimental investigation of laminar-turbulent boundary layer transition on a blunt generic re-entry capsule. Paper 2014-2353, AIAA, 2014.
[36] A. Theiss and S. Hein. Investigation on the wake flow instability behind isolated roughness elements on the forebody of a blunt generic re-entry capsule. In6th European Conference for Aeronautics and Space Sciences, 2015.
[37] A. Theiss, S. Hein, S. R. C. Ali, and R. Radespiel. Wake flow instability studies behind discrete roughness elements on a generic re-entry capsule. Paper 2016-4382, AIAA, 2016.
[38] A. Theiss, M. Lichtmes, and S. Hein. Local stability analysis of laminar-turbulent boundary layer transition on blunt generic re-entry capsules. InNotes on Numerical Fluid Mechanics and Multidisciplinary Design, pages 279–288. Springer International Publishing, 2016.
[39] N. D. Tullio, P. Paredes, N. D. Sandham, and V. Theofilis. Laminar–turbulent transition induced by a discrete roughness element in a supersonic boundary layer.J. Fluid Mech., 735:613–646, 2013.
[40] B. M. Wheaton and S. P. Schneider. Hypersonic boundary-layer instabilities due to near-critical roughness. J