University of Bradford eThesis
This thesis is hosted in Bradford Scholars – The University of Bradford Open Access
repository. Visit the repository for full metadata or to contact the repository team
© University of Bradford. This work is licenced for reuse under a Creative Commons
NOVEL MEDICAL IMAGING TECHNOLOGIES
FOR PROCESSING EPITHELIUM AND
ENDOTHELIUM LAYERS IN CORNEAL
CONFOCAL IMAGES
Developing Automated Segmentation and Quantification Algorithms
for Processing Sub-basal Epithelium Nerves and Endothelial Cells for
Early Diagnosis of Diabetic Neuropathy in Corneal Confocal
Microscope Images
Shumoos Taha Hammadi HAMMADI
Submitted for the Degree of Doctor of Philosophy from the
University of Bradford
School of Electrical Engineering and Computer
Science
University of Bradford
i
ABSTRACT
Shumoos Taha Hammadi HAMMADI
Novel Medical Imaging Technologies for Processing Epithelium and Endothelium Layers in Corneal Confocal Images
Developing Automated Segmentation and Quantification Algorithms for Processing Sub-basal Epithelium Nerves and Endothelial Cells for Early Diagnosis of Diabetic Neuropathy in Corneal Confocal Microscope Images
Keywords: Medical Imaging, Diabetic Peripheral Neuropathy, Corneal Confocal Microscopy, Corneal Sub-Basal Epithelium, Automatic Nerve Segmentation, Anisotropic Diffusion Filtering, Corneal Endothelial Cells, Automatic Cell Segmentation, Fast Fourier Transform, Watershed Transformation
Diabetic Peripheral Neuropathy (DPN) is one of the most common types of diabetes that can affect the cornea. An accurate analysis of the corneal epithelium nerve structures and the corneal endothelial cell can assist early diagnosis of this disease and other corneal diseases, which can lead to visual impairment and then to blindness. In this thesis, fully-automated segmentation and quantification algorithms for processing and analysing sub-basal epithelium nerves and endothelial cells are proposed for early diagnosis of diabetic neuropathy in Corneal Confocal Microscopy (CCM) images. Firstly, a fully automatic nerve segmentation system for corneal confocal microscope images is proposed. The performance of the proposed system is evaluated against manually traced images with an execution time of the prototype is 13 seconds. Secondly, an automatic corneal nerve registration system is proposed. The main aim of this system is to produce a new informative corneal image that contains structural and functional information. Thirdly, an automated real-time system, termed the Corneal Endothelium Analysis System (CEAS) is developed and applied for the segmentation of endothelial cells in images of human cornea obtained by In Vivo CCM. The performance of the proposed CEAS system was tested against manually traced images with an execution time of only 6 seconds per image.
Finally, the results obtained from all the proposed approaches have been evaluated and validated by an expert advisory board from two institutes, they are the Division of Medicine, Weill Cornell Medicine-Qatar, Doha, Qatar and the Manchester Royal Eye Hospital, Centre for Endocrinology and Diabetes, UK.
ii
Firstly, all praises to Allah, the most gracious and the most merciful, for the strengths, good health and blessing he gave me in completing this thesis.
I have probably met more interesting people that I have in my entire life before that. It is impossible to thank everyone in particular, as another dissertation of the same size would be required. Thank you all - you know who you are!
I would like to express my sincere gratitude to my advisors Prof. Rami Qahwaji and Dr. Stan Ipson for the continuous support of my PhD study and related research, for his patience, motivation, and immense knowledge. Their guidance helped me in all the time of research and writing of this thesis. I could not have imagined having better advisors and mentor for my PhD study.
I would like to show my gratitude to all members involved in this project, professors and medical doctors, who provided me an inspiring working environment and significant support over the course of this project. Prof. A. M. Morgado (University of Coimbra, Portugal) for kindly providing the CCM images with the manually traced ground-truth images for the first dataset of epithelium layer and Prof. Rayaz A. Malik ( Division of Medicine, Weill Cornell Medical College in Qatar, Doha, Qatar) and Centre for Endocrinology and Diabetes, Institute of Human Development, University of Manchester and the Manchester Royal Infirmary, Central Manchester Hospital Foundation Trust, Manchester, U.K.), for kindly providing the CCM images for the second dataset of epithelium layer and the dataset of endothelium layer. In addition to his clinical supervision and evaluation to all the results obtained during this PhD. Thesis.
I would like to thank my friends and colleagues for accepting nothing less than excellence from me. I like to thank them for their encouragement, support and discussions. I must express my very profound gratitude to my parents for their prayers, endless love and encouragement and to my brothers and sister for supporting me spiritually throughout writing this thesis and my life in general.
Last but not the least; I would like to thank my beloved husband (Alaa S. Al-Waisy) for providing me with unfailing support and continuous encouragement throughout my years of study and through the process of researching and writing this thesis. My sweetheart sons (Fahad and Taim) I feel like I have to thank you already. Not just for the sleepless nights, when trying to finish my PhD and looking after you has caused havoc, but for the great time we are going to have together and your smiles, which gave me a special power. This accomplishment would not have been possible without all of them.
Shumoos T. Al-Fahdawi © 2018
iii
Dedication
This work is humbly dedicated to all my valuable
treasures in my life:
To my parents, brothers and sisters,
To my beloved husband, Alaa S. Al-Waisy
And
To my little sons, Fahad and Taim
Shumoos T. Al-Fahdawi
iv
Journal Papers
:
Shumoos Al-Fahdawi, Rami Qahwaji, Alaa S. Al-Waisy, Stanley
Ipson, Rayaz A. Malik, Arun Brahma, and Xin Chen, “A fully
automatic nerve segmentation and morphometric parameter
quantification system for early diagnosis of diabetic neuropathy in
corneal images,”
Comput. Methods Programs Biomed.,
vol. 135,
pp. 151–166, 2016.
Shumoos Al-Fahdawi, Rami Qahwaji, Alaa S. Al-Waisy, Stanley
Ipson, Maryam Ferdousi, Rayaz A. Malik, and Arun Brahma, “A
Fully Automated Cell Segmentation and Morphometric Parameter
System for Quantifying Corneal Endothelial Cell Morphology,”
Comput. Methods Programs Biomed
., vol. 160, pp. 11–23, 2018.
Alaa S. Waisy, Rami Qahwaji, Stanley Ipson, Shumoos
Al-Fahdawi,
"A multimodal deep learning framework using local
feature representations for face recognition", Machine Vision and
Applications-Springer., vol. 29, no. 1, pp. 35–54, 2017.
Alaa S. Waisy, Rami Qahwaji, Stanley Ipson, Shumoos
Al-Fahdawi,
"A Multi-biometric Iris Recognition System Based on a
Deep Learning Approach" , Pattern Analysis and
Applications-Springer., pp. 1–20, 2017.
Adnan Khan, Naveed Akhtar, Saadat Kamran,Georgios
Ponirakis, Hamad Al-Muhanadi, Ioannis N. Petropoulos, Paula
Bourke, Shumoos Al-Fahdawi, Rami Qahwaji, Ashfaq Shuaib
and Rayaz A. Malik, Corneal Confocal Microscopy detects
alterations in Corneal Endothelial Cell Morphology in Patients
Admitted with Acute Ischemic Stroke,
In progress
, 2018.
Conference Papers:
Shumoos Al-Fahdawi, Rami Qahwaji, Alaa S. Al-Waisy, and
Stanley Ipson, “An automatic corneal subbasal nerve registration
system using FFT and phase correlation techniques for an
accurate DPN diagnosis,”
2015 IEEE International Conference on
Computer and Information Technology; Ubiquitous Computing
and Communications; Dependable, Autonomic and Secure
v
Computing; Pervasive Intelligence and Computing
, pp. 1035–
1041, 2015.
Alaa S. Waisy, Rami Qahwaji, Stanley Ipson, Shumoos
Al-Fahdawi,
"A Fast and Accurate Iris Localization Technique for
Healthcare
Security
System",
2015
IEEE
International
Conference
on
Computer
and
Information
Technology;
Ubiquitous Computing and Communications; Dependable,
Autonomic and Secure Computing; Pervasive Intelligence and
Computing,
pp. 1028-1034, 2015.
Alaa S. Waisy, Rami Qahwaji, Stanley Ipson, Shumoos
Al-Fahdawi, "A Robust Face Recognition System Based on Curvelet
and Fractal Dimension Transforms",
2015 IEEE International
Conference
on
Computer
and
Information
Technology;
Ubiquitous Computing and Communications; Dependable,
Autonomic and Secure Computing; Pervasive Intelligence and
Computing,
pp. 548-555, 2015.
Alaa S. Waisy, Rami Qahwaji, Stanley Ipson, Shumoos
Al-Fahdawi,
"Multimodal
Biometric
System
for
Personal
Identification Based on Deep Learning Approaches",
2017
Seventh International Conference on Emerging Security
Technologies (EST),
pp.163-168, 2017.
Demos & Presentations:
Shumoos Al-Fahdawi, Rami Qahwaji, Alaa S. Al-Waisy, Stanley
Ipson, Rayaz A. Malik, Arun Brahma,
"A Fully Automated Cell
Segmentation and Morphometric Parameter System for
Quantifying Corneal Endothelial Cell Morphology",
Digital Health
Enterprise Zone Academic Launch Event, DHEZ Academic,
Phoenix, University of Bradford
, Sep. 29, 2017.
Shumoos Al-Fahdawi, Rami Qahwaji, Alaa S. Al-Waisy, Stanley
Ipson, Rayaz A. Malik, Arun Brahma, Xin Chen,
"Automated
Diagnosis of Diabetic Neuropathy from Corneal Images",
The
Digital Health and Wellbeing Festival at the Digital Exchange,
University of Bradford
, Wed. 29-Thu. 30 June, 2016.
Alaa S. Waisy, Rami Qahwaji, Stanley Ipson, Shumoos
Al-Fahdawi,
"A Multi-biometric Iris Recognition System Based on a
Deep Learning Approach",
University of Bradford
, 12 Oct. 2017.
vi
Shumoos Al-Fahdawi, Rami Qahwaji, Alaa S. Al-Waisy, Stanley
Ipson, Rayaz A. Malik, Arun Brahma,
"Automated Diagnosis of
Diabetic Neuropathy from Corneal Images
" ,
Digital Health
Enterprise Zone Academic Launch Event, DHEZ Academic,
Phoenix, University of Bradford
, Sep. 29, 2017.
Shumoos Al-Fahdawi, Rami Qahwaji, Alaa S. Al-Waisy, Stanley
Ipson, Rayaz A. Malik, Arun Brahma, Xin Chen
"A Fully
Automatic Nerve Segmentation and Morphometric Parameter
Quantification System for Early Diagnosis of Diabetic Neuropathy
in Corneal Images", Accepted for presentation at the 1st Annual
Innovative Postgraduate Research Conference (1
stAIERC),
University of Bradford, July 17, 2017.
Alaa S. Waisy, Rami Qahwaji, Stanley Ipson, Shumoos
Al-Fahdawi.
"A Multimodal Deep Learning Framework Using Local
Feature Representations for Face Recognition", Accepted for
presentation at the 1st Annual Innovative Postgraduate Research
Conference (1
stAIERC), University of Bradford, July 17, 2017.
Rami Qahwaji, Shumoos Al-Fahdawi, Alaa Al-Waisy, Rayaz A.
Malik, Maryam Ferdousi, and Arun Brahma, "Novel Imaging
Technologies for the Quantification of Nerve Structures from
Corneal Confocal Images ", The transformative potential of data
and image analysis for eye care, The Royal Society, London, 6-9
Carlton House Terrace, April, 23-24, 2018.
vii
Table of Contents
Abstract
. ... iAcknowledgements
. ... iiDedication
. ... iiiList of Publications
. ... ivTable of Contents
. ... viiList of Figures
. ... ixList of Tables
. ... xiiiList of Abbreviations
. ... xiv1. Chapter One: Introduction
. ... 11.1 Basic Optic Anatomy and Physiology. ... 1
1.2 The Normal Cornea Structure. ... 4
1.3 Diabetes Effects on Ocular Health. ... 6
1.4 Corneal Imaging Techniques. ... 10
1.4.1 In Vivo Confocal Microscopy (IVCM). ... 10
1.4.2 Ocular Coherence Tomography (OCT). ... 12
1.5 Problem Definition. ... 13
1.6 Aims and Objectives. ... 15
1.7 Contributions. ... 18
1.8 Outline. ... 20
2. Chapter Two: Literature Review
. ... 232.1 Introduction. ... 23
2.2 Corneal Sub-Basal Epithelium Nerve Analysis. ... 23
2.3 Corneal Nerve Registration Techniques. ... 27
2.4 Corneal Endothelium Cells Analysis... 28
2.5 Current Challenges and Knowledge Gaps. ... 32
2.6 Summary. ... 33
3. Chapter Three: Cornea Sub-Basal Epithelium Analysis
. ... 353.1 Introduction. ... 35
3.2 The Proposed Methodology. ... 38
3.2.1 Data Used. ... 39
3.2.2 Pre-processing Stage. ... 40
3.2.2.1 Diffusion Filtering ... 41
3.2.2.2 Hybrid Diffusion With Continuous Switch (HDCS) ... 43
3.2.2.3 Diffusion Schemes ... 44
3.2.3 Morphological Operations Stage ... 46
3.2.4 Edge Detection Stage ... 50
3.2.5 Morphometric Parameters Quantification Stage ... 53
viii
3.2.5.4 Nerve Thickness ... 55
3.3 Experimental Results ... 56
3.4 Summary ... 68
4. Chapter Four: Corneal Epithelium Registration System
... 694.1 Introduction ... 69
4.2 The Proposed Methodology ... 72
4.3 Corneal Nerve Registration System ... 74
4.3.1 Image Registration ... 75
4.3.2 Image Segmentation ... 77
4.3.3 Corneal Image Map ... 79
4.4 Experimental Results ... 81
4.5 Summary ... 84
5. Chapter Five: Cornea Endothelium Analysis
... 855.1 Introduction ... 85
5.2 The Proposed Methodology ... 88
5.2.1 Data Used ... 89
5.2.2 Pre-processing step ... 90
5.2.3 Cell Contour Detection Step ... 92
5.2.4 Morphometric Parameters Quantification Stage ... 94
5.3 Experimental Results ... 98
5.4 Summary ... 113
6. Chapter Six: Conclusions and Future Work
... 1156.1 Conclusions ... 115
6.2 Future Work ... 122
References
... 125Appendices
. ... 134Appendix A: Canny Edge Detection
. ... 134Appendix B: Cornea Sub-Basal Epithelium System-GUI
. ... 136Appendix C: Cornea Endothelium Analysis System (CEAS)-GUI
... 139ix
List of Figures
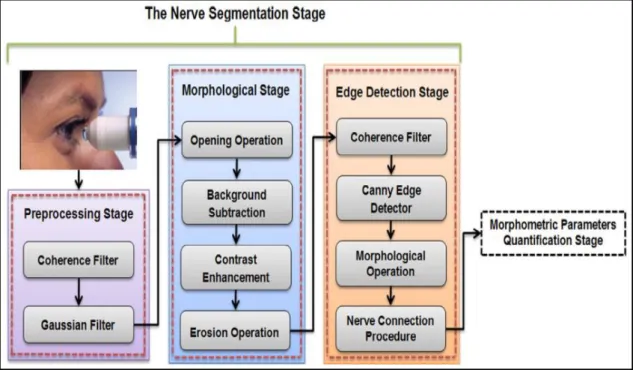
Fig. 1.1: Anatomical structure of human eye (Acharya et al. 2008)... 2 Fig. 1.2: The anatomy of the human eye and the cornea (a) Section of the frontal part of the human eye, (b) Six layers from the anterior to the posterior cornea, (c) In Vivo corneal confocal microscopy image of the corneal epithelium and endothelium layers. Adopted from (Navaratnam et al. 2015)... 5 Fig. 1.3: In Vivo confocal microscopy (IVCM) images (Heidelberg Retina Tomograph – Rostock Cornea Module (HRT-RCM), (400×400) µm) (a) Superficial epithelial cells, (b) Basal epithelial cells, (c) Sub-basal nerves with Bowman layer, (d) Anterior Stroma with hyper reflective keratocyte nuclei, (e) Stromal nerve, (f) Endothelium (Reinhard & Larkin 2013)... ... 11 Fig. 1.4: Spectral Domain anterior segment Ocular Coherence Tomography (SD-OCT) images: (a) Normal cornea and (b) Avellino corneal dystrophy (Reinhard & Larkin 2013). ... 13 Fig. 1.5: Representative examples of CCM images with different types of noise and artifacts: (a) Corneal tissue deformation, (b) Illumination artifacts and blood vessel, (c) Blurring effect due to saccadic eye movement, (d) Unwanted structures, (e) Stromal cells, (f) Depth differences and unwanted bright structures, (g) and (h) Illumination artifacts (Otel 2012). ... 15 Fig. 1.6: Chapters' organization and the dependence among dissertation chapters. ... 22 Fig. 3.1: Overview of the automatic proposed corneal nerve segmentation and quantification system. ... 38 Fig. 3.2: Images from the dataset used. The first two images from the top side are from healthy control subjects, while the last two images are from diabetic patients... ... 40 Fig. 3.3: Notations for (a) The standard discretization scheme and (b) The
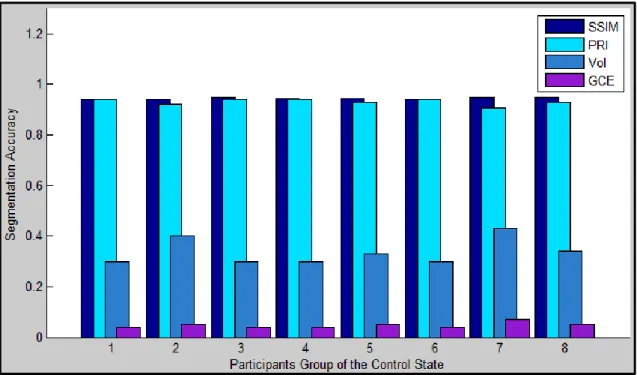
non-negative discretization scheme.. ... 44 Fig. 3.4: Corneal nerve segmentation system outputs: (a) Original corneal image, (b) Coherence filter output, (c) Gaussian filter output, (d) Morphological operations stage output, (e) Segmented image from the edge detection stage, (f) Automatically traced corneal sub-basal nerves, (g) Manually traced corneal sub-basal nerves.. ... 49 Fig. 3.5: The main implemented approaches in the edge detection stage. ... 52
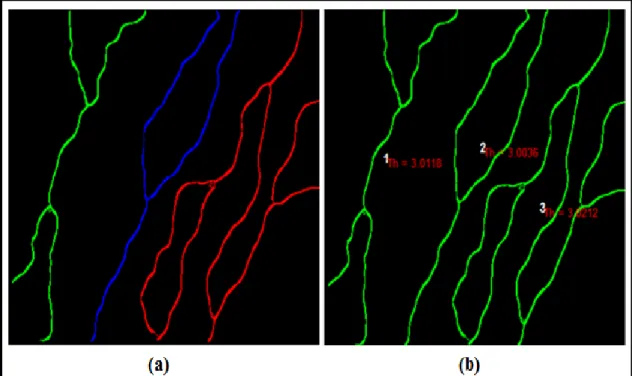
x
element (white circles) drawn at the endpoints, and (c) Output image with connected nerves. ... 52 Fig. 3.7: The thickness algorithm output: (a) Labelling of corneal nerves 1, 2 and 3 in green, blue and red, respectively, (b) Image map for the corneal nerves with their average thickness values indicated.. ... 56 Fig. 3.8: (a) A segmented image, (b) The binary form of ground-truth image, (c) The SSIM index map.. ... 58 Fig. 3.9: Descriptive statistics of the segmentation system performance of the Control group of the first database, where a higher value of SSIM and PRI is better and a lower value of VoI and GCE is better. ... 61 Fig. 3.10: Descriptive statistics of the segmentation system performance of the patient group of the first database, where a higher value of SSIM and PRI is better and a lower value of VoI and GCE is better.. ... 61 Fig. 3.11: The output of the single scale dual-model detector: The images in the top row are the original images, while the bottom row is their response (Dabbah et al. 2011). ... 63 Fig. 3.12: A readable text file format showing clinical features extracted from the first database. ... 64 Fig. 3.13: Representative box-plots with (median, inter-quartile range, outliers, and extreme cases of each parameter) illustrating the extracted clinical features from the first database: (a) Average Nerve Tortuosity, (b) Average Nerve thickness, and (c) Average Nerve Length, (d) Average Nerve Density.. ... 66 Fig. 3.14: Representative box-plots with (median, inter-quartile range, outliers, and extreme cases of each parameter) illustrating the extracted clinical features from the second database: (a) Average Nerve Tortuosity, (b) Average Nerve Thickness (c) Average Nerve Length, and (d) Average Nerve Density. ... 67 Fig. 4.1: The main steps of the proposed corneal sub-basal nerve registration system to generate a colour coded corneal nerve image map.. ... 75 Fig. 4.2: Overview of the automatic Fourier and phase correlation based image registration algorithm.. ... 77 Fig. 4.3: Applying the image registration algorithm on three sequenced CCM images where the last column represents the output.. ... 78 Fig. 4.4: Corneal nerve segmentation system outputs: (Top) row is the original corneal images and (Bottom) row is binary segmented images……… ... 79
xi
Fig. 4.5: The colour coded corneal nerve image map of the nerve tortuosity: top row represents the control group, while bottom row represents the patients group.. ... 80 Fig. 4.6: Representative box-plots with (median, inter-quartile range, outliers, and extreme cases of each parameter) illustrating the extracted clinical features from the controls and patients group: (a) ANT (b) ANTh, (c) ANL and, (d) AND ... 83 Fig. 5.1: An illustration of the process for the automated corneal cell segmentation and quantification system (CEAS).. ... 89 Fig. 5.2: Examples of original corneal endothelial cell images with different types of noise and artifacts: (a) Darker areas in the peripheral regions, (b) Non-uniform illumination with blurring effect due to saccadic eye movement, and (c) Darker areas with unwanted bright objects. ... 90 Fig. 5.3: Corneal cell segmentation system outputs: (a) Original corneal image, (b) Applying FFT-Band-pass filtering, (c) Binarized image, (d) Applying watershed approach, (e) Applying Voronoi tessellation, (f) Labeling of endothelial cells (g) Final endothelial cells segmentation result, and (h) Automatically traced endothelial cells boundaries.. ... 93 Fig. 5.4: A readable text file format showing morphological features associated with the health state of corneal endothelium. ... 96 Fig. 5.5: (a) Original corneal endothelial image and (b) Endothelial cell segmentation results with red color indicating the cells that have been ignored. ... 97 Fig. 5.6: (a) Final endothelial cells segmentation result and (b) Using the color of a cell to indicate its number of neighbors using the color code given on the right. The most common color is orange corresponding to six neighbors.. ... 97 Fig. 5.7: GIMP program outputs: (a) Original image, (b) A representative example of manually traced cells contours, (c) Generated binary image used as a ground-truth manual segmentation inside the ROI.. ... 101 Fig. 5.8: Descriptive statistics of the CEAS segmentation system performance on Database_1, where a higher value of PRI and SSIM is better and a lower value of GMSD, VoI MSE, NAE and GCE `are better.. ... 102 Fig. 5.9: A comparison example of an image taken from the Database_1: (a) Original image, (b) A manually traced cell contours, (c) The output of the proposed CEAS system, and (d) The output of the BestFit system... ... 102
xii
solid lines are the linear regression lines: (a) Cell density, (b) Cell area, (c) Cell perimeter, (d) Polymegathism, and (e) Pleomorphism... ... 107 Fig. 5.11: Bland-Altman plots showing difference versus average for each pair of manual and automatic estimations of: (a) Cell density, (b) Cell area, (c) Cell perimeter, (d) Polymegathism, and (e) Pleomorphism from Database_1. Solid lines (mean differences), dashed lines (95% limits of agreement).... ... 108 Fig. 5.12: Comparison between manual and automated segmentation outputs:
(a) Original image, (b) Manually traced cells, (c) Automatically segmented cells.... ... 109 Fig. 5.13: An illustration of the semi-automatic corneal endothelium system used in the HRT Rostock Cornea Module (Heidelberg Engineering GmbH; Heidelberg; Germany) for cell density estimation.... ... 110 Fig. 5.14: (a) Original image, (b) Manually over picked cells as shown in the red circle, (c) Automatically segmented cells... ... 111 Fig. 5.15: Correlation plot of automated and manual cell densities with a significant correlation on Database_2... ... 112 Fig. 5.16: Bland-Altman plot showing mean difference and limits of agreement between manual and automated cell densities on Database_2... .... 113 Fig. 6.1: An initial evaluation of the proposed nerve segmentation algorithm
using retinal ICG images: (a) Original retinal image and (b)
xiii
List of Tables
Table 3.1: Summary of the descriptive clinical features of manually and automatically traced nerves extracted from the first database. ... 65 Table 4.1: The descriptive summary of the clinical features before and after
applying the proposed corneal sub-basal nerve registration system. ... .84 Table 5.1: Performance comparison made between the manual and automated
estimations of five morphometric parameters in 40 corneal images of Database_1. The differences between the manual and automatic estimates are listed and also as a percentage. ... 105
Table 5.2: Performance comparison between the manual and automated cell density estimates using Database_2.. ... 112
xiv
Symbol
Definition
ACM Active Contour Model
ANL Average Nerve Length
ANT Average Nerve Tortuosity
AS-OCT Anterior Segment Optical Coherence Tomography
BCS Boundary Contour System
CCM Corneal Confocal Microscopy
CEAS Corneal Endothelium Analysis System
CED Coherence-Enhancing Diffusion
CV Coefficient of Variation
DFT Discrete Fourier Transform
DPN Diabetic Peripheral Neuropathy
ECD Endothelial Cell Density
EED Edge-Enhancing Diffusion
FFT Fast Fourier Transform
GCE Global Consistency Error
GMSD Gradient Magnitude Similarity Deviation
GP Genetic Programming
GUI Graphical User Interface
HC Hexagonality Coefficient
HDCS Hybrid Diffusion filter with a Continuous Switch
HRT Heidelberg Retina Tomograph
IFFT Inverse Fast Fourier Transform IVCM In Vivo Confocal Microscopy
xv
LQM Local Quality Map
MCA Mean Cell Area
MCD Mean Cell Density
MCP Mean Cell Perimeter
MSE Mean Square Error
NAE Normalized Absolute Error
NN Neural Networks
OCT Ocular Coherence Tomography
Pleomorphism Percentage of Hexagonality Coefficient
POC Phase-Only Correlation
Polymegathism Coefficient of Variation in cell size
PRI Probabilistic Rand Index
RF Random Forest
ROI Region of Interest
SIFT Scale Invariant Feature Transform
S-PSO Snake model and the Particle Swarm Optimization SSCM Slit-Scanning Confocal Microscope
SSIM Structural SIMilarity Index
SURF Speeded-Up Robust Features
SVM Support Vector Machine
SVM Support Vector Machine
TPS Thin-Plate Spline
TSCM Tandem Scanning Confocal Microscope
1
Chapter 1
Introduction
The eyes are certainly the most sensitive organs that we possess and possibly the most surprising thing. The eyes allow us to view the world and distinguish objects through the optical window and besides that, the eyes are responsible for four-fifths of the whole of the information that the brain receives, which is probably the reason of why we depend on our eyesight more than any other sense.
The eye is small with size about 24-25 mm in sagittal diameter and is a complicated organ. In addition, the system in which the eye functions is extremely complex.
1.1 Basic Optic Anatomy and Physiology
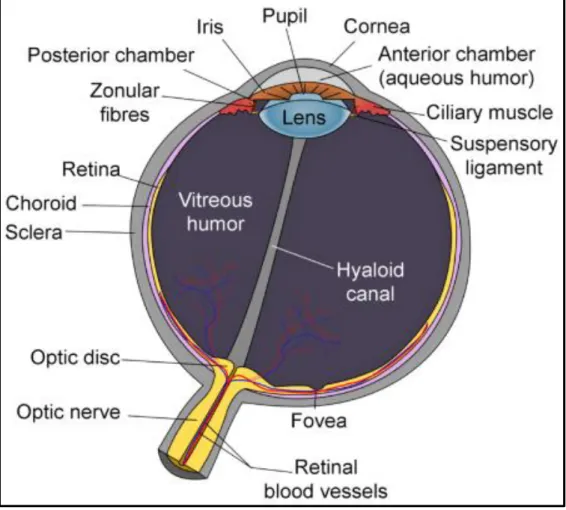
Human eye comprises fundamentally of six regions: the cornea, sclera, aqueous humor, iris, lens and vitreous humor. Other optic domains include the retina and choroid. The retina is the part that is light sensitive and where light energy is converted to neural signals. The choroid is an extremely vascularized structure in the eye that accounts for 85% of the total optic blood flow. The eye has a form quite close to a spherical shape. A human eye usually has a radius of 12 mm and length of the pupillary axis, which is measured by the distance between the cornea and the posterior part of the eye of between 23 and 25 mm. The anatomical structure of the human eye is shown in Figure 1.1. The following components are major components of the human eyes (Acharya, Ng and Suri, 2008):
___________________________________________________Chapter 1: Introduction
2
a) CorneaThe cornea is the transparent outer facing layer of the eye which is exposed to the environment. It has a water content of 78% and an elliptical shape on average 12mm in the horizontal axis and 11 mm in the vertical axis (Mapstone, 1970). The corneal thickness is not uniform and is about 530 microns in the central region. The main functions of the cornea are to refract and transmit light. The cornea is avascular, which means that it lacks blood vessels inside it. The cornea needs an oxygen supply which is obtained from the atmosphere by absorption through the tear film.
Figure 1.1: Anatomical structure of human eye (Acharya, Ng and Suri, 2008).
3
b) The Aqueous HumorThe anterior chamber between the cornea and pupil contains the fluid aqueous humor. The aqueous fluid is made up mainly of water which supplies nutrients to the lens and avascular cornea. The aqueous flow has hydrodynamic properties which generate an intraocular pressure (IOP) which reaches 15 mmHg for normal human eyes (Acharya, Ng and Suri, 2008).
c) The Iris
The iris consists of pigmented fibrovascular tissues known as the stroma. The main function of the iris is to control the pupil size and adjust the amount of light entering the eye. It is also responsible for determining eye colour. The pupil diameter size depends on the lighting conditions. Relative to the iris, the eye structure is divided into anterior and posterior regions (Acharya, Ng and Suri, 2008). The region at the front of the iris is the anterior region, while the region at the back of the iris is the posterior region.
d) The Lens
The lens structure is biconvex with a central thickness of between 3.5 and 5 mm which is dependent on age. The main lens function is to focus the light that comes into the eye onto the retina. The lens is avascular and consists of 65% water and 35% protein (Hill, R. M., 1965). The content of water inside the lens increases with age.
e) The Vitreous Humor
The vitreous humor comprises the largest volume of the human eye and fills up the space between the retina and the lens with a pure aqueous
___________________________________________________Chapter 1: Introduction
4
solution that consists of 98.5% to 99.7% water (Acharya, Ng and Suri, 2008). The eye takes its spherical structure from the vitreous humor. The vitreous works as a storage region for metabolites of the lens and retina.
f) The Sclera
The sclera is the white outer layer of the eye normally referred to as the white of the eye and wraps around five-sixths of the posterior eyeball. The sclera thickness is non-uniform. A few blood vessels passing through it provide the blood for the sclera. The choroid and retinal layers are beneath the sclera (Mapstone, 1968).
1.2 The Normal Cornea Structure
Human cornea is a transparent layer which covers the front surface of the eye. The Cornea transmits and helps focus light onto the retina. The lens and the cornea are the refracting components of the eye. As shown in Figure 1.2, the cornea is formed of five layers, covering crucial internal structures of the human eye, including the iris, pupil, lens, and anterior chamber. The epithelium of (50 μm) thick is the outermost layer, then Bowman’s membrane (12 μm), the stroma (480–500 μm), Descemet’s membrane (8–10 μm), and finally the endothelium (5 μm), innermost (Nishida, 2005). Few years ago, another layer was detected in the cornea, called Dua’s layer, as described in (Dua et al., 2013). Each layer of the cornea has an important function. The epithelium is the outer layer and its primary function is to prevent the crossing of foreign materials, such as bacteria, dust and water into the eye and to other layers of the cornea. The epithelium surface is so smooth that it easily absorbs oxygen and nourishment from tears and distributes them to the rest of the cornea (Acharya, Ng and Suri, 2008).
5
The epithelium contains many tiny nerve endings, which make the cornea highly sensitive to pain when scratched or rubbed. A transparent sheet of tissue below the epithelium is known as Bowman’s layer. This layer is strong and composed of protein fibres called collagen. In injured state, Bowman’s layer may create a scar. If these scars are big enough and centrally located, vision loss may occur. Under the Bowman layer is the stroma layer, which makes up about 90% of the thickness of the cornea. It is mostly 78% water and 16% collagen and does not contain blood vessels. Beneath the stroma layer is Descemet’s membrane, this layer is a thin but strong sheet of tissue, which works as a protective barrier against injuries and infection (Acharya, Ng and Suri, 2008).
Figure 1.2: The anatomy of the human eye and the cornea (a) Section of the frontal part of the human eye, (b) Six layers from the anterior to the posterior cornea, (c) In Vivo corneal confocal microscopy image of the corneal epithelium
___________________________________________________Chapter 1: Introduction
6
Descemet’s membrane includes collagen fibres which are considered different from those of the stroma layer and are supported by the endothelial cells layer that lies below it. In the injured state, Descemet’s membrane layer regenerates (Acharya, Ng and Suri, 2008). The endothelium layer is extremely thin and the deepest layer of the cornea. The cells of endothelial are necessary to keep the cornea transparency by preserving the balance of the liquid in the cornea. The role of the endothelium is to pump excess liquid that leaks from inside the eye into the stroma layer, then out of the cornea into the aqueous humor. Without this mechanism, the stroma will swell with water and become hazy. At birth, the cells of a normal corneal endothelium are uniformly sized with regular hexagonal shapes and a honeycomb appearance (McCarey, Edelhauser and Lynn, 2008). This regular appearance is influenced by pathologies and ageing causing cells to die, with no new cells replacing them, thereby resulting in permanent damage to the endothelium. Once endothelial cells are destroyed, they are lost forever, the surrounding cells extend to fill holes, hence increasing the average size of the endothelial cells and producing variations from the regular hexagonal shape throughout life. If too many cells are destroyed, blindness ensues, with corneal transplantation being the only available therapy (Vincent, 1992).
1.3 Diabetes Effects on Ocular Health
The diabetes is the main cause of permanent blindness in adults. Type 1 diabetes accounts for approximately 10% of the autoimmune etiology that broadly affects children and young people, while Type 2 diabetes accounts for approximately 90% of cases, which are mainly linked with insulin resistance and obesity. The Diabetic Peripheral Neuropathy (DPN) is one of the most common
7
types of diabetes that can affect the ocular tissues, which results in around 12,000 to 24,000 new occurrences of blindness every year (Skarbez et al. 2010). For example, in 2015, the American Diabetes Association1 reported that, out of 30.3 million (9.4%) of the total US population, about 23.1 million people were diagnosed with diabetes and an estimated 7.2 million people were undiagnosed. Approximately, 79,535 death certificates were associated with this disease, which put it as the 7th leading cause of death in the United States in 2015. In the UK, most health experts reported that diabetes remains one of the biggest health problems facing the UK population, due to the large increase in the number of people diagnosed with diabetes, which has increased from 1.4 million to 2.9 million, since 1996. By 2025, about 5 million people will have this disease, whether diagnosed or undiagnosed. Most of them are expected to be diagnosed with Type 2 diabetes, due to the ageing population problem and rapidly increasing numbers of obese and overweight people (DiabetesUK, 2012). Hence, it is significant that ophthalmologists pay close attention to pathological changes in their diabetic patients, so all abnormal cases can be diagnosed and treated early (Skarbez et al., 2010). The wide ranges of diabetic complications that affect ocular tissues are reviewed briefly, as follows:
a) Conjunctiva: Diabetics are at the highest risk of developing bacterial infections of the conjunctiva, especially acute infectious conjunctivitis. The infective conjunctiva is an infection that affects the front skin of one or both eyes. A number of significant symptoms can be noted in affected patients, such as the whites of one or both eyes appearing inflamed, and red or
___________________________________________________Chapter 1: Introduction
8
pink. According to many studies, up to 86% of diabetic patients have abnormal changes in the conjunctiva (Schønheyder, 2006).
b) Dry Eye: One of the most common conditions in diabetic patients is the dry eye syndrome, which can result in reduced corneal sensitivity. This leads to the negative effect of not making enough reflex tears, so the eye becoming inflamed (red and swollen) (Najafi et al., 2013).
c) Lids/Lashes: This disease is reported as yellowish collections of cholesterol, which is more common in diabetic patients. These collections of cholesterol do not cause any pain and can be easily treated under the skin on or around the lids (Negi and Vernon, 2003).
d) Cornea: Neurotrophic Keratopathy is the degenerative disease of the corneal epithelium layer, which is responsible for several corneal complications, such as repeated corneal erosions, persistent epithelial defects and disabled corneal innervation. These corneal complications have been connected to decreased sensitivity of the cornea, tear secretion abnormalities and poor cohesion between epithelium cells and the basement membrane (Choo et al., 2010).
e) LASIK: This refers to the most common laser eye surgery for the correction of myopia, hyperopia, and astigmatism. As a result of it increasing corneal defects, some concerns have been raised about whether Laser-Assisted in situ keratomileusis (LASIK) can be safely performed on diabetic patients. Several studies have reported an increased incidence of epithelial complications in diabetic patients caused by LASIK (Jabbur et al., 2004).
9
f) Contact Lenses: Several studies have shown that diabetic patients are at a higher risk of developing contact lens complications than non-diabetic patients, especially, patients who wear contact lenses for a long period. Moreover, glucose levels in diabetic patient’s tears are higher than in non-diabetics, which can increase the opportunity for eye infections (O’Donnell and Efron, 2012).
g) Iris: Neovascularization is the most serious consequence of diabetes that can be observed around the pupil region and the complete iris surface in advanced cases. Several clinical reports have pointed out that Neovascularization can be found in up to 7 % of diabetic eyes and 60% of eyes with proliferative retinopathy. In addition, the iris epithelium in diabetic patients is at higher risk of becoming depigmented. This release of pigment from the iris has a negative effect on the corneal endothelium of diabetic patients (Chen, Chew and Chan, 2015).
h) Mucormycosis: Mucormycosis is an uncommon disease, but is very aggressive and is often considered an opportunistic disease that can progress rapidly. This fungal infection affects immunocompromised individuals and Type 1 diabetic patient. It commonly starts in the paranasal sinuses or palate and then spreads to the orbital contents. Some of the hallmarks of this infection are an ocular pain, loss of vision, and ophthalmoplegia. The treatment of this infection comprises an aggressive use of Amphotericin B and surgical debridement (Lee, Holland and Glasgow, 1996).
___________________________________________________Chapter 1: Introduction
10
1.4 Corneal Imaging Techniques
In many clinical cases, an accurate evaluation of corneal structures is required in order to help the ophthalmologists in monitoring and treating different corneal diseases early and efficiently. However, poor resolution of ophthalmic instruments (e.g. the slit-lamp) has always been a challenging problem for ophthalmic clinicians and researchers to get a precise evaluation of corneal structures and monitor the effects of treatments of the different layers of the cornea. To overcome the limitations of poor resolution, new corneal imaging techniques have been developed, such as In Vivo Confocal Microscopy and Optical Coherence Tomography.
1.4.1 In Vivo Confocal Microscopy (IVCM)
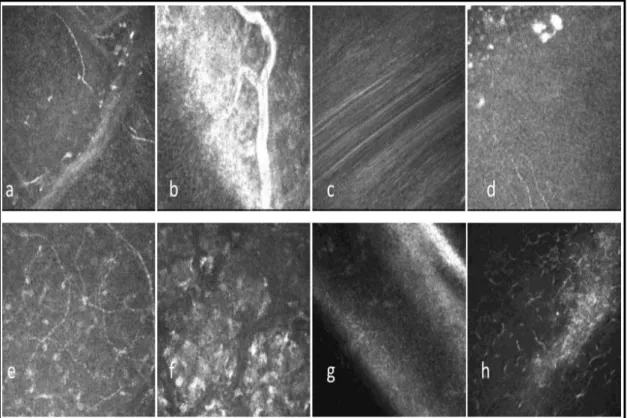
IVCM is one of the most sophisticated and non-invasive imaging technique that is used to provide high-resolution images of the cornea, the conjunctiva and the limbus (Reinhard and Larkin, 2013). In 1955, the first confocal microscope was invented by Minsky while he was studying brain parenchyma cells. More recently, combining IVCM with high-performance digital imaging provides high-resolution images of the different layers of the cornea that can be stored and manipulated to produce 2D-images, 3D-images or numerical data such as corneal thickness. Figure 1.3 shows an example of these images captured from different layers of the cornea using IVCM. These images or subsequently extracted data are used to study and monitor both physiological and pathological cornea conditions. In fact, numerous publications have demonstrated the usefulness of IVCM as an important aid tool in the diagnosis and treatment of corneal dystrophies, infectious keratitis and the
11
assessment of corneal changes after refractive surgery or corneal surgery (Tervo and Moilanen, 2003), (Jalbert et al., 2003b). Over the last few years, the most commonly used types of confocal microscopes have been:
a) The Tandem Scanning Confocal microscope (TSCM).
b) The ConfoScan 4 Slit-Scanning Confocal Microscope (ConfoScan 4-SSCM).
c) The Heidelberg Retina Tomograph Rostock Corneal Module laser scanning confocal microscope (HRT or HRT3).
Figure 1.3: In Vivo confocal microscopy (IVCM) images (Heidelberg Retina Tomograph – Rostock Cornea Module (HRT-RCM), (400×400) µm) (a) Superficial epithelial cells, (b) Basal epithelial cells, (c) Sub-basal nerves with
Bowman layer, (d) Anterior Stroma with hyperreflective keratocyte nuclei, (e) Stromal nerve, (f) Endothelium (Reinhard and Larkin, 2013).
___________________________________________________Chapter 1: Introduction
12
1.4.2 Ocular Coherence Tomography (OCT)The OCT is a new, non-invasive imaging technique that uses light waves to capture cross-section images of the retina and the light-sensitive tissue at the back of the eye in a matter of seconds (Carlo et al. 2015). Analysis of the anterior part of the eye structure is also an essential aspect of ophthalmology examinations where many clinical cases require an accurate evaluation not only of the spatial relations but also the dimensions of the structures that comprise this part of the eye (Reinhard and Larkin, 2013). In clinical practice, corneal imaging is usually achieved using the slit lamp, which cannot be considered an objective quantitative evaluation technique. To overcome these limitations, new imaging techniques have been developed, which include anterior segment OCT.
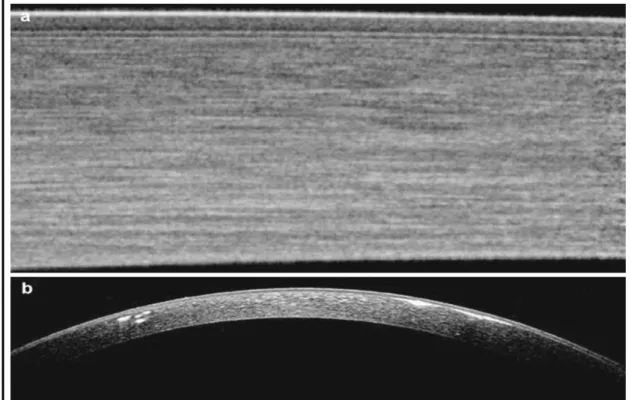
The OCT was first used in analysing the posterior part of the eye, and then a number of modifications and improvements were made in order to capture high-resolution images of the anterior part of the eye, and the resulting technique is now called Anterior Segment Optical Coherence Tomography (AS-OCT). Numerous AS-OCT applications have been proposed, especially in the field of corneal graft and refractive surgery due to the ability of the new AS-OCT devices to measure the entire corneal thickness and the thickness of each corneal layer from the epithelium layer to the endothelium layer. Figure 1.4 shows two anterior segment images acquired using the OCT imaging technique (Zysk et al., 2007).
13
Figure 1.4: Spectral domain of the Anterior Segment Ocular Coherence Tomography (SD-OCT) images: (a) Normal cornea and (b) Avellino corneal
dystrophy (Reinhard and Larkin, 2013).
1.5 Problem Definition
In order to build an efficient and robust system for segmenting sub-basal epithelium nerves and endothelium cells in human corneal confocal images, a number of issues need to be taken into account, as discussed below.
The Corneal Confocal Microscopy (CCM) images usually suffer from different types of artefacts (e.g., blurring, noise, specular reflections, low contrast, non-uniform illumination, etc.) associated with the acquisition process. This is due to a several factors including:
a) The saccadic eye movement during the scanning process which causes a motion, blurring and/or displacement effects of the nerve fibers.
___________________________________________________Chapter 1: Introduction
14
b) The spherical-like shape of the cornea layers which can lead to a non-uniform distribution of the lighting in different areas of the corneal layers, and different attenuation of light along the various paths of illumination. This non-uniform distribution of the lighting causes the CCM images to have darker areas in their peripheral regions in most cases, making the characteristics of the cornea’s nerves and cells unclear.
c) Subject movement due to breathing and the cardiac pulse occurring during the acquisition process may cause some images to be out of sequence in terms of depth.
d) The appearance of small unwanted structures (e.g., basal epithelial cells, nerve deformities, keratocytes, etc.), which are neither corneal sub-basal nerves nor corneal endothelial cells. These artefacts make the detection of the corneal sub-basal nerves and the correct boundaries of the corneal endothelial cells a challenging task. Some representative examples of CCM images with different types of noise and artefacts are shown in Figure 1.5.
A major challenge for carrying out this research is the unavailability of large public benchmark datasets of confocal microscopy images of the cornea. Hence, collaborations with leading experts were formed to provide necessary data for this research. Two datasets have been provided in collaboration with an expert advisory board from the Division of Medicine, Weill Cornell Medicine-Qatar, Doha, Qatar and the Manchester Royal Eye Hospital, Centre for Endocrinology and Diabetes, UK. In addition, one dataset has been provided by a volunteer at the University of Coimbra, Portugal.
15
Figure 1.5: Representative examples of CCM images with different types of noise and artifacts: (a) Corneal tissue deformation, (b) Illumination artifacts and
blood vessel, (c) Blurring effect due to saccadic eye movement,(d) Unwanted structures, (e) Stromal cells, (f) Depth differences and unwanted bright
structures, (g) and (h) Illumination artifacts (Otel, 2012).
1.6 Aims and Objectives
The main aim of this research is to developing new diagnostic tools for extracting clinical features from the cornea’s epithelium and endothelium layers. Abnormalities of both corneal sub-basal nerves and corneal endothelial cells may be associated with a number of corneal and systemic diseases. For instance, damage to the endothelial cells can significantly affect the corneal transparency by altering the hydration of the corneal stroma, which is associated with irreversible endothelial cell pathology requiring corneal transplantation. To date, quantitative analysis of corneal sub-basal nerve and endothelial cell abnormalities has been manually performed by
___________________________________________________Chapter 1: Introduction
16
ophthalmologists using time-consuming and highly subjective semi-automatic tools, which require an operator interaction. Specific objectives are designing and implementing two fast and fully-automated diagnostic systems for these two corneal layers, and extracting meaningful clinical features, which are aimed at helping ophthalmologists in monitoring and treating different corneal diseases early and efficiently. Further objectives are addressing the problem of the discontinuous corneal nerves and developing an automatic corneal sub-basal nerve registration system to address the displacement problem and produce a more informative corneal image that contains structural and functional information. The main objectives of this research work are:
1. Propose efficient and robust image enhancement algorithms to improve the quality of the CCM images. For corneal sub-basal nerves, the emphasis will be on keeping the image structures, while removing noise and unwanted objects. In contrast, using corneal endothelial cells the emphasis will be on correcting the non-uniform illumination and reducing the amount of noise.
2. Development of a fully-automated system that can be used for tracing the sub-basal nerves in corneal images and extracting meaningful clinical features, including thickness, tortuosity, length and density of the nerve to aid in the early diagnosis of DPN and when planning LASIK or Photorefractive keratectomy (PRK).
3. The objective in 2 involves several issues that need to be tackled efficiently, including (i) developing an efficient and fully-automated nerve connection algorithm to connect the discontinuous corneal sub-basal nerves, which result from low visibility of parts of nerves or noise
17
introduced into the corneal images. Employing this procedure can play a significant role in calculating helpful and meaningful clinical features. (ii) Development of an efficient and accurate nerve thickness algorithm, without any manual intervention.
4. Development of a fully-automated and real-time system for the segmentation and computation of endothelial cells in images of the human cornea obtained by In Vivo CCM. In this task, a number of useful clinical parameters will be extracted and calculated, including Mean Cell Density (ECD), Polymegathism, Pleomorphism, Mean Cell Area (MCA) and Mean Cell Perimeter (MCP). These clinical parameters could play a significant role in the early diagnosis of corneal pathology and in determining the health status of corneas for transplantation.
5. Investigations into the design of an efficient and practical corneal nerve image registration system to produce a more informative corneal nerve image than the original images using a set of sequenced CCM images. This task also involves producing a colour coded corneal image map that can be used to give ophthalmologists an efficient and clear representation of the extracted clinical features for each nerve and layer in the corneal image.
6. Evaluating the performance of the proposed systems and the possibility of utilizing them in real-world clinical setting to enable rapid diagnosis and for patient follow-up. In this task, the effectiveness and robustness of the proposed systems will be evaluated against manually traced benchmark images formulated by ophthalmologists for both corneal sub-basal nerves and corneal endothelial cells.
___________________________________________________Chapter 1: Introduction
18
1.7 Contributions
The main results and contributions made in this PhD research can be summarized as follows:
1. Development of an objective, real-time and fully-automated system for tracing the sub-basal nerves in corneal images and extracting meaningful clinical features for the early diagnosis of diabetic neuropathy. In this system, an efficient image enhancement algorithm based on applying the Coherence filter followed by Gaussian filtering to enhance the visibility of the nerves and remove noise. Furthermore, a number of useful and meaningful clinical features are extracted (e.g., nerve tortuosity, nerve thickness, nerve length, etc.) which may be used for early diagnosis of diabetic polyneuropathy and when planning LASIK or PRK.
2. A new nerve connection algorithm is proposed for connecting discontinuous nerves without any manual intervention, which can play a significant role in calculating helpful and meaningful clinical features, such as nerve tortuosity and nerve length that mainly depend on the whole structure of the nerve. In addition, an efficient and accurate nerve thickness algorithm based on distance transform, without any manual intervention, is also proposed.
3. The performance of the proposed corneal sub-basal nerves system has been evaluated against manually traced ground-truth images from two databases. The first database consists of 498 corneal sub-basal nerve images (238 are normal and 260 are abnormal) captured using Heidelberg Retinal Tomograph equipped with a Cornea Rostock Module (HRT-CRM: Heidelberg Engineering, Heidelberg, Germany). While the second
19
database consists of 919 images taken from healthy subjects and diabetic patients with and without neuropathy using a Heidelberg Retina Tomograph equipped with Rostock Cornea Module (HRT-III). The results obtained demonstrate that the proposed system can be readily used as a useful clinical tool to support the expertise of ophthalmologists and save the clinician time in a busy clinical setting.
4. An automatic corneal sub-basal nerve registration system is proposed to produce a colour coded corneal image map by overlaying a sequence of CCM images that may differ in their displacement, scaling, and rotation to each other. This system produces a new more informative corneal image containing structural and functional information that can be used to give ophthalmologists an efficient and clear representation of the extracted clinical features for each nerve and layer in the corneal image. In addition, the corneal image map can improve the nerve visibility and help with acquiring more precise clinical feature faster instead of manually searching through a sequence of CCM images to extract these features from each image individually.
5. The performance of the proposed corneal sub-basal nerve registration system has been assessed on a database of 30 subjects (18 controls and 12 diabetic patients) with a sequence of CCM images that varies between 3 and 4 images per subject. We have managed to demonstrate the efficiency of the generated corneal image map in providing a better structural and functional information with less execution time compared to the original images by calculating four useful clinical features (e.g., nerve tortuosity, nerve thickness, nerve length and nerve density).
___________________________________________________Chapter 1: Introduction
20
6. A totally automatic, robust and real-time system is proposed, termed the Corneal Endothelium Analysis System (CEAS) for the segmentation and computation of the different morphological parameters of endothelial cells in human cornea obtained by In Vivo corneal confocal microscopy. In this system, an efficient region-based segmentation approach based on the Voronoi Tessellation approach is employed to draw the boundaries of the corneal endothelial cells and ensure that a wider range of corneal endothelial parameters can be derived and analyzed (e.g., endothelial cell density, endothelial cell area, endothelial cell perimeter, polymegathism and pleomorphism).
7. The performance of the proposed CEAS system has been evaluated against manually traced ground-truth images from two databases (each one consisting of 40 images). The images in these databases are acquired using a laser CCM (Heidelberg Retinal Tomograph III Rostock Cornea Module HRT III RCM; Heidelberg Engineering GmbH; Heidelberg; Germany), had very low quality compared to those in the literature. The overall measurement results have demonstrated the efficiency of the proposed CEAS system and the possibility of utilizing it in a real-world clinical setting to enable rapid diagnosis and for patient follow-up, with an execution time of only 6 seconds per image.
1.8 Thesis Organization
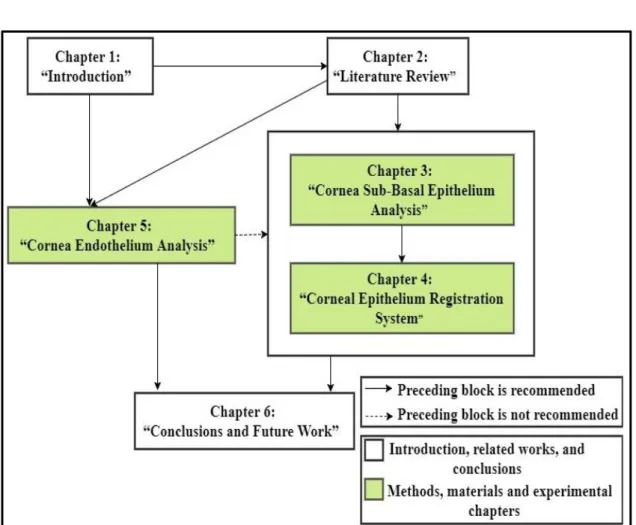
This PhD Thesis is organized into six chapters including this chapter. An overview of these chapters is presented below. The chapters' organization and the dependence among these chapters are illustrated in Figure 1.6:
21
Chapter 2 presents literature review of previous investigations into cornea epithelium nerve analysis techniques; cornea nerve registration techniques; and cornea endothelium cells analysis techniques. It also details the motivations for this PhD research based on previous related work.
Chapter 3 introduces a robust, fast and fully-automated nerve segmentation and nerve morphometric parameters quantification system for confocal microscope images of the epithelium. This system is considered as a tool for early diagnosis of diabetic neuropathy. In this work, a number of features are extracted, including thickness, tortuosity, length and density of the nerve, which may be used for the early diagnosis of diabetic polyneuropathy
Chapter 4 introduces an automatic corneal sub-basal nerve registration system using FFT and phase correlation techniques for an accurate DPN diagnosis. This system is aimed at producing a new informative corneal image that contains structural and functional information of the corneal nerves.
Chapter 5 presents a fully-automated, robust and efficient real-time system for the segmentation and computation of morphological parameters associated with endothelial cells in human cornea obtained by In Vivo confocal microscopy. In this system, meaningful clinical parameters to improve diagnostic value are extracted which shows the possibility of utilizing it in real-time for early diagnosis of patients and for follow-up.
___________________________________________________Chapter 1: Introduction
22
Chapter 6 presents the overall conclusions, achievements and some limitations of the research. Possible future directions of this research are also outlined In this work.
Figure 1.6: Chapters' organization and the dependence among dissertation chapters.
23
Chapter 2
Literature Review
2.1 Introduction
Over the last few years, researchers have demonstrated an increased interest in the field of automatic segmentation of corneal confocal images. However, the research related to corneal confocal images is limited and most of the systems proposed are incapable of detecting the corneal epithelium nerves or endothelial cells without the aid of manual (interactive) inputs such as the provision of seed points. Most of the methods presented are based on images from a specular microscope, which is excellent for imaging the central corneal. A specular microscope provides high contrast between different endothelial tissues and creates good, high contrast images with trivial light dispersal. In addition, small datasets of corneal images have been used in the assessment of most of these presented methods. In this work the literature review is organized as follows: corneal sub-basal epithelium analysis is reviewed in Section 2.2. Corneal nerve registration techniques are presented in Section 2.3. The review of corneal endothelium cell analysis is provided in Section 2.4. The knowledge gaps are presented in Section 2.5. Section 2.6 is a short summary.
2.2 Corneal Sub-Basal Epithelium Nerve Analysis
The work proposed in (Ferreira, Morgado and Silva, 2010) is a phase symmetry-based system for the segmentation of corneal nerves of images acquired by corneal confocal microscopy. Firstly, the contrast of the nerves is
_______________________________________________Chapter 2: Literature Review
24
increased and the noise is reduced, using contrast equalization, a phase symmetry-based approach and histogram processing. This is followed by a region growing, a nerve reconstruction technique to join the disconnected nerves. Small, isolated segments are discarded. Finally, two morphometric parameters are measured nerve tortuosity and the nerve length. The method was tested on a small dataset consisting of 15 images and achieved 87.1% ± 8.1% correctly segmented nerves. The authors in (Otel et al., 2013) used the same algorithm as in (Ferreira, Morgado and Silva, 2010) but with a different dataset to extract a set of morphometric parameters consisting of tortuosity, density, length, width and branching measure. These were used to identify diabetic peripheral neuropathy and measure its severity. However, the authors found that the proposed nerve segmentation method did not give excellent results in extracting the clinical features. Therefore, manual segmentation with the aid of SPSS program was used to compute each morphometric parameter.
(Ruggeri, Scarpa and Grisan, 2006) proposed a corneal nerve tracing and recognition system. The system starts by normalizing the contrast and luminosity of a corneal image and then applies an averaging filter to reduce its noise. A tracking procedure is then applied starting from a set of automatically defined seed points. In the final stage, fuzzy c-mean clustering is applied to classify the pixels as “nerve” or “non-nerve” pixels. The system performance was tested on 12 images and the execution time was 4-5 minutes per image. No further details on how they measured execution time were given. The results showed that the performance of the system could be affected by the presence of cells in images. Epithelium cells could be incorrectly identified as segments of nerves. (Poletti and Ruggeri, 2013) presented an algorithm for corneal nerve
25
recognition based on an automatically identified set of seed points lying all over the image. The nerves are traced by connecting the seed points using their minimum cost paths. This system was tested using a dataset consisting of 30 epithelium corneal images. The algorithm achieved an average sensitivity of about 0.85, a false detection rate of 0.05 and an execution time of 25 seconds per image. No further details about how the execution time was measured are available.
(Ferreira, Morgado and Silva, 2012) developed an automatic segmentation and morphometric analysis system for sub-basal corneal nerves images obtained by using corneal confocal microscopy. The system starts by enhancing the image contrast and reducing the noise using contrast equalization and a histogram procedure, respectively. To identify the nerve structures, a phase symmetry-based algorithm using a wavelet transform filter is used. Then, a nerve reconstruction process is implemented using manually selected sets of seed points, followed by a sequence of morphological operations to discard small segments. The system failed to recognize 5.3% of the nerves correctly. (Scarpa, Grisan and Ruggeri, 2008a) presented an algorithm for detecting corneal nerves in CCM images. Firstly, the algorithm starts by enhancing the luminosity and contrast of the corneal images by employing an equalization technique. This is followed by an automatic procedure to identify a set of seed points all over the input image to be used as starting points to detect each nerve in the image. The algorithm was tested on a dataset consisting of 90 images of control and patient subjects. It correctly recognized 80.4% and 83.8% of nerve length, compared with the manually traced nerves length, in control and patient subjects, respectively. (Scarpa et
_______________________________________________Chapter 2: Literature Review
26
al., 2011) presented an automatic algorithm to calculate and classify the tortuosity of corneal nerves using a dataset containing 30 corneal sub-basal nerve images. The proposed algorithm is based on the tracing and recognition system for corneal nerves in (Scarpa, Grisan and Ruggeri, 2008a). Nerve tortuosity was calculated using an algorithm based on the number of twists in the curvature sign and on the amplitude. The results obtained were compared against the manual evaluation performed by an expert. Only 2 classification errors in 30 images were made by the proposed algorithm. An automatic analysis and classification system for detecting nerves in confocal microscopy corneal images based on a multi-scale dual model detection algorithm was presented in (Dabbah et al., 2011). Feature vectors were generated from this dual-model detection to be used in the classification stage, which is based on the Random Forest (RF) and Neural Networks (NN) to classify the pixels as nerve or non-nerve pixels. The performance of the proposed system was evaluated using a database consisting of 521 CCM images, which is a subset of a database used in the work presented in this PhD Thesis. The highest sensitivity and specificity using the proposed system were achieved at an EER of 15.44%. The work reported in (Guimar et al., 2014) presents an automatic system to trace sub-basal plexus nerves in images which are acquired by CCM. First, a top-hat Morphological operation is used to enhance the image’s contrast. Next, a Log-Gabor filter is applied to enhance the corneal nerve structure. This is followed by hysteresis thresholding to obtain candidate nerve segments that are input to a Support Vector Machine (SVM) to distinguish between nerve and non-nerve segments. The system performance was tested on 246 images and achieved an average sensitivity of 0.88±0.06.