Part A:
Market of organic
Coffee, Cocoa
1.1.2 World production of organic coffee
Coffee is one of the most important or-ganic products exported by developing countries. It is produced mainly in Latin America. Countries already producing or-ganic coffee are:
• Latin America: Bolivia, Brazil, Colombia, Costa Rica, Cuba, Dominican Republic, El Salvador, Guatemala, Haiti, Honduras, Mexico, Nicaragua, Peru, Trinidad and Tobago, Venezuela.
• Africa: Ethiopia, Kenya, Madagascar, Malawi, Tanzania, Togo, Uganda • Asia: India, Indonesia, Papua New
Guinea, Philippines, Sri Lanka
Organic coffee production first took off in those countries where producers lacked the resources to purchase agricultural in-puts (fertilizers, pesticides). This applies most of all to places where small farmers are organized in cooperatives (Mexico, Colombia, etc.). For some long time large-scale intensive producers in Brazil, for ex-ample, showed no interest in organic pro-duction. Today this has changed: the high premiums for organic coffee are nudging increasing numbers of large-scale produc-ers towards convproduc-ersion.
Today, organic coffee is an important ex-port for Mexico, Bolivia, Guatemala, Peru, Nicaragua, Tanzania, Brazil, Ethiopia, India and Madagascar. Production is mostly under an ecological agroforestry manage-ment system that creates a valuable alter-native to deforestation. Several African countries, for example Uganda and Ethiopia, recently started organic coffee programmes.
Table 2 shows the global production ca-pacity of organic coffee for export. For 2000, experts estimate this to be about 12,000 tonnes, and for 2001, about 30,000 tonnes. Roughly 50% of the world supply of organic coffee is produced by small farmers’ organizations which are members of FLO-International (Fair Trade Labelling Organization). The other half of the world production is supplied by small farmers’ organizations which are not FLO-registered although some are members of Fair Trade programmes, and by private small, medium and large-scale farmers not belonging to Fair Trade programmes.
1.
Market for
organic coffee
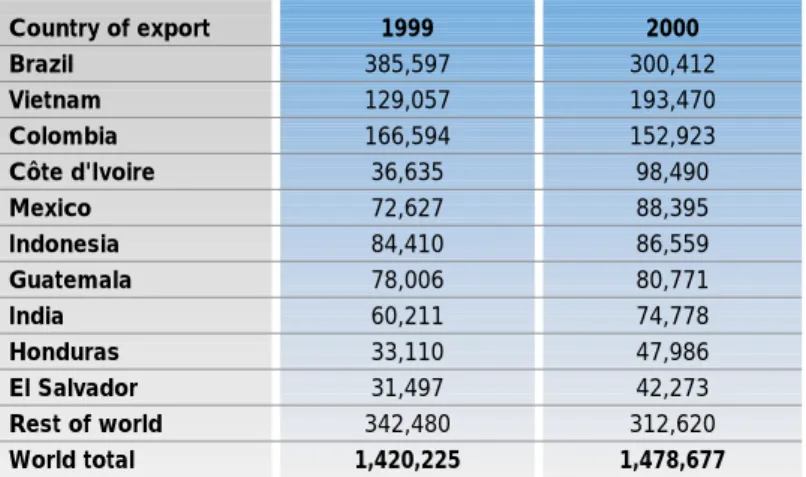
1.1 Production of Organic Coffee 1.1.1 World production of coffee Coffee is grown in over 50 developing countries. Currently the coffee market is suffering from oversupply, with prices at a corresponding historic low. New produc-ers, especially Vietnam, have embarked on major coffee production ventures, which have positively flooded the market. World production in 2001/2 is 114.5 mil-lion bags (6.87 milmil-lion tonnes), whereas consumption stands at only 108 million bags (6.48 million tonnes). Added to this unsold stockpiles remain, which also de-press the market.
In recent years coffee has developed from a luxury drink to a mass-market product. Countries with comparative cost disadvan-tages, especially the traditional small-scale structures of coffee production in Latin America (e.g. Colombia, Mexico) are worse affected by this development than large-scale producers in Vietnam or Brazil. 66% of world production is Arabica and 34% is Robusta.
Table 1: 10 largest exporters of green coffee beans in tonnes (ICO-members) Country of export Brazil Vietnam Colombia Côte d'Ivoire Mexico Indonesia Guatemala India Honduras El Salvador Rest of world World total 1999 385,597 129,057 166,594 36,635 72,627 84,410 78,006 60,211 33,110 31,497 342,480 1,420,225 2000 300,412 193,470 152,923 98,490 88,395 86,559 80,771 74,778 47,986 42,273 312,620 1,478,677 Sources: ICO
Unfortunately there are no global produc-tion statistics other than for
FLO-registered production and a certain amount of data from organic certification companies. Therefore the figures in Table 2 are incomplete: they do not include fig-ures for non-FLO-registered Fair Trade or for non-Fair-Trade organic coffee.
Moreover it should be pointed out that the production capacity of organic coffee does not correlate to the quantity of organic coffee actually exported, because the pro-ducers cannot necessarily sell the entire organic coffee harvest as organic, and instead market part of it conventionally.
Naturland Association is one of the most important promoters of organic coffee pro-duction in Latin America and its export to Europe. Naturland supports and certifies cooperatives and commercial farmers. More than 80% of certified Naturland cof-fee is produced by small-scale farmers
Mexico is the largest producer of organic coffee
Mexico is one of the largest organic coffee producers in the world, with a total output of 86,250 60-kilo sacks for the two-year period 2000/2001. And in terms of acreage, coffee is Mexico’s main organic product, which represents 66% of the total area under organic management. Organic coffee in Mexico is mostly harvested by small indigenous farmers and sold in the world's biggest supermarkets and coffee shops. Organic certification for Mexican coffee began in 1962 and organic Mexican coffee is consumed today in the United States, Germany, Switzerland, Japan, Italy, Denmark, Spain, France and Britain. According to the Mexican Coffee Council, the organic coffee growers are mostly indigenous farmers in Chiapas, Oaxaca, Veracruz and Guerrero states. Though the organic coffee trade repre-sents just one percent of global sales of coffee beans, for the Mexican growers it returns healthy profits. Some 20,000 small farmers and their families benefit from the higher price commanded by their organic product.
Table 3: FLO-registered Fair Trade Organic Coffee, in tonnes 2001
Country of export Bolivia Brazil Cameroon Colombia Congo (Zaire) Costa Rica Cuba Dominican Republic Ecuador El Salvador Ethiopia Guatemala Haiti Honduras India Indonesia Madagascar Malawi Mexico Nicaragua Papua New Guinea Peru Philippines Sri Lanka Sumatra Tanzania Thailand Togo Trinidad and Tobago Uganda Venezuela Total FLO-registered Fair Trade Organic
780 0 40 445 0 0 0 25 175 515 0 2,115 0 295 0 300 0 0 7,380 250 225 2,430 0 0 0 0 5 0 0 0 20 15,000 Source: FLO-International
Table 2: World production capacity of organic coffee in tonnes, 2001 (estimations)
Total
Total Organic 30,000
Other Fair Trade and non Fair Trade
15,000
FLO-registered Fair Trade Organic
15,000
organized in cooperatives. The require-ments with regard to inspection and certi-fication of organic production of small-scale farmer cooperatives have risen dras-tically during the last few years. In order to meet these requirements Naturland coop-erated with IMO Switzerland to publish a manual on how to set up an internal con-trol system. The amount of organic green coffee certified by Naturland in 2000 is 18,500 tonnes (1997: 900 tonnes). Naturland would like its projects to con-tribute to enhancing the competitiveness of small farmers’ associations in order to ensure the continuity of their production.
1.1.3 Organic and Fair Trade Most organic coffee producers are organ-ized in producer groups (cooperatives and other forms of organization), and most organic coffee producers are connected to a Fair Trade programme. There is more Fair Trade coffee than organic coffee on the European market. In the USA, organic coffee is more important than Fair Trade coffee. The international Fair Trade register compiled by FLO-International contained 177 producer groups in November 2001. Sixty-eight producer groups or 38% pro-duce organic coffee, and ten propro-ducer groups are in conversion.
The amount of coffee a group can supply is not necessarily the amount available for the Fair Trade and/or organic market in Europe for a variety of reasons such as deficiencies in quality, taste and certifica-tion or disagreements with clients. For coffee with a Fair Trade label, one of the most important reasons is lack of demand on the market. The Fair Trade market is still very small, and all producer groups produce much more than that they can sell under Fair Trade conditions.
1.2 Market for Fair Trade and organic coffee
North America and Europe are the largest markets for organic coffee. In both conti-nents, organic coffee – unlike the conven-tional coffee industry – has experienced notable growth in recent years.
Table 4: Naturland Association: Hectarage of organic coffee and num-ber of Naturland coffee growers (2001)
Country Bolivia Brazil Ecuador El Salvador Guatemala Mexico Nicaragua Peru Total Area organic coffee 2,785 685 805 240 1,400 30,560 610 19,205 56,290 Number of Natur-land producers 1,435 1 90 1 990 11,545 175 6,165 20,402 Source: Naturland
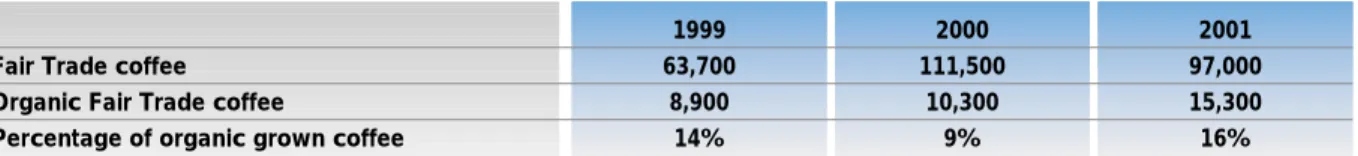
Table 5: Availability of organic and Fair Trade green coffee in exportable* quality (tonnes)
Fair Trade coffee Organic Fair Trade coffee
Percentage of organic grown coffee
1999 63,700 8,900 14% 2000 111,500 10,300 9% 2001 97,000 15,300 16% Source: Naturland
* The definition of ‘exportable’ has been diluted in recent years: for low-priced coffee, standards have been lowered. For AA-quality coffee, on the other hand, the same high standards have been retained.
1.2.1 Export and retail value Global certifiedorganic coffeeexports amounted to 15-18 million pounds for the year 1999/2000. The global retail value of organic coffee is approximately USD 223 million. Organic coffee retail value has demonstrated steady 20% annual growth rates in the last few years.
Globally,Fair Trade coffeeexports were approximately 29 million pounds for the year 1999/2000. The global retail value of Fair Trade coffee is approximately USD 393 million. Organic certification is steadily gaining in popularity among Fair Trade coffees, rising from 1% of total sales in 1996 to 36% in 2000.
US Market volumes
The US handles about one-quarter of global coffee imports = GBP 2.45 billion or USD 18.5 billion (Sustainable Coffee Survey of the North American Speciality Coffee Industry, July 2001). Compared to 1999, gross sales of organic coffees for 2000 increased by nearly 50% in the USA. North American coffee importers sold ap-proximately 4.9 million pounds of organic green coffee with a total value of USD 184,000. The majority of these coffees are sold through grocery outlets (health food stores) rather than through speciality cof-fee stores. A rough estimate of the total North American retail market for certified organic coffee is USD 122 million.
A certain amount of Fair Trade coffee is still sold without a label (in World Shops, etc). The overview in Table 7 includes only labelled sales.
Table 6: Organic and Fair trade coffee sold in Europe (tonnes)
1999 2000
Fair Trade
11,800 12,300
Fair Trade organic
2360 2460 Sources: Agro-Eco, FiBL
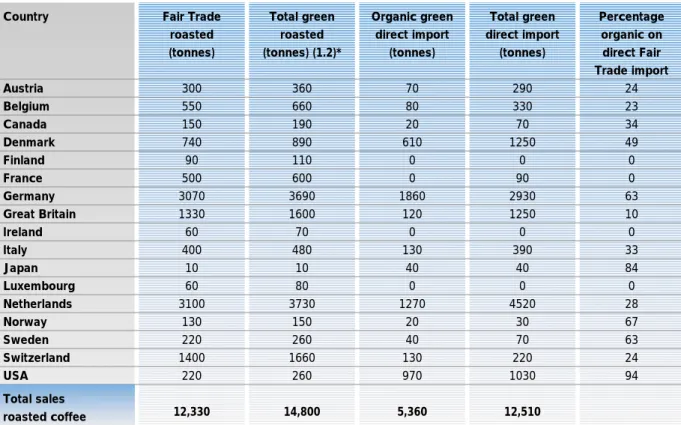
Table 7: Estimated total Fair Trade labelled organic sales per country in 2000
Country Austria Belgium Canada Denmark Finland France Germany Great Britain Ireland Italy Japan Luxembourg Netherlands Norway Sweden Switzerland USA Fair Trade roasted (tonnes) 300 550 150 740 90 500 3070 1330 60 400 10 60 3100 130 220 1400 220 12,330 Total green roasted (tonnes) (1.2)* 360 660 190 890 110 600 3690 1600 70 480 10 80 3730 150 260 1660 260 14,800 Organic green direct import (tonnes) 70 80 20 610 0 0 1860 120 0 130 40 0 1270 20 40 130 970 5,360 Total green direct import (tonnes) 290 330 70 1250 0 90 2930 1250 0 390 40 0 4520 30 70 220 1030 12,510 Percentage organic on direct Fair Trade import 24 23 34 49 0 0 63 10 0 33 84 0 28 67 63 24 94
* Conversion ratio green coffee to roasted coffee is 1.2 : 1 Sources: FLO-International
Total sales roasted coffee
1.2.2 Market shares
Globally, about 0.5% of all coffee pro-duced is sold as organic. In Europe, where organic food has a market share of 2-3%, organic coffee accounts for 0.5% of total coffee sales. Market share is highest in Switzerland (more than 1%), due to the generally high interest of consumers in organic food and due to the fact that the two main supermarket chains both sell organic coffee.
In Europe, about 25% of Fair Trade cof-fees are sold as organic. The proportion of organic coffee is steadily growing,
because the price differential over conven-tional coffee is so great that the organic premium barely registers. In the EU, Fair Trade markets are considerably larger than those in the US, and organic coffee is a strong seller. In the US shade coffee is a strong seller, whereas in Europe and Japan it is still relatively novel. Shade cof-fee is not organic; it means simply ‘grown in shaded forest settings’. Shade coffee is mainly sold under the Eco-OK label.
1.2.3 Distribution channels The main distributors of organic coffee in Europe are natural food stores and World Shops. There are still only a few countries where organic coffee is sold in supermar-kets: This is true for example of Germany, the Netherlands and Switzerland, where
the two big supermarket outlets Coop and Migros are selling their own organic coffee. The reason for the weak interest of Euro-pean supermarkets is the high price differ-ential between organic and conventional coffee. This is even more problematic for organic Fair Trade coffee, because price differentials are higher still (see Chapter 1.3).
More than 80% of organic coffee is sold directly to households (end-consumers), and less than 20% to restaurants and canteens. Growth potential is larger for sales to households than to restaurants, where a very small percentage of the cof-fee sold is organic, as yet. The reason for the weak interest of restaurants in organic coffee might be the extremely low price of conventional coffee; organic coffee appears to be expensive compared to conventional. Where canteens are con-cerned, their reservations about selling organic coffee are also fairly strong be-cause offering organic coffee would com-pel them to offer other organic items, which would be at odds with the tight constraints on canteen menu budgets.
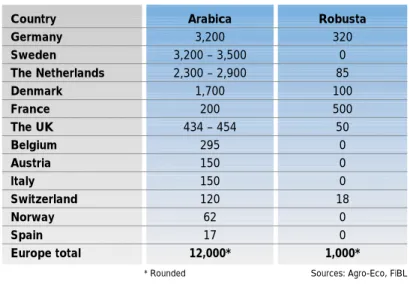
1.2.4 Organic coffee imports In table 8 an overview is given of organic coffee imports per country. The countries are arranged in order of import volumes. Imports are stated in tonnes.
Table 8: Green organic coffee imports per country in Europe in tonnes (year 2000)
Country Germany Sweden The Netherlands Denmark France The UK Belgium Austria Italy Switzerland Norway Spain Europe total Arabica 3,200 3,200 – 3,500 2,300 – 2,900 1,700 200 434 – 454 295 150 150 120 62 17 12,000* Robusta 320 0 85 100 500 50 0 0 0 18 0 0 1,000*
Among the top importing countries, Sweden and Denmark stand out. Scandinavians drink a lot of coffee, but these markets are small and therefore more difficult to penetrate. The
Netherlands is in the upper part of the list, due to its important function as the port of access to Europe. About 80% of imports in The Netherlands are transported to other countries in Europe. Another remarkable thing is that France is by far the most significant importer of Robusta coffee. The market for Robusta coffee in many European countries is increasing due to growing consumer demand for espresso coffee. The rising imports of Robusta into Europe can be attributed to the fact that there is higher overall demand for cheap coffee; Robusta is in-creasingly blended into cheap coffees.
FLO-International only has information about Fair Trade labelled organic green coffee, which is less than the total organic green coffee supplied to Europe. A source of non-Fair-Trade organic coffee is, for example, Venezuela.
1.3 Prices of organic coffee The market reality and various studies show that consumers are indeed interested in organic coffee and are pre-pared to pay a premium. Coffee-drinkers pay an average of 15 to 25 percent more for organic and 20 to 50 percent more for Fair Trade organic coffee than they would for conventionally grown coffee.
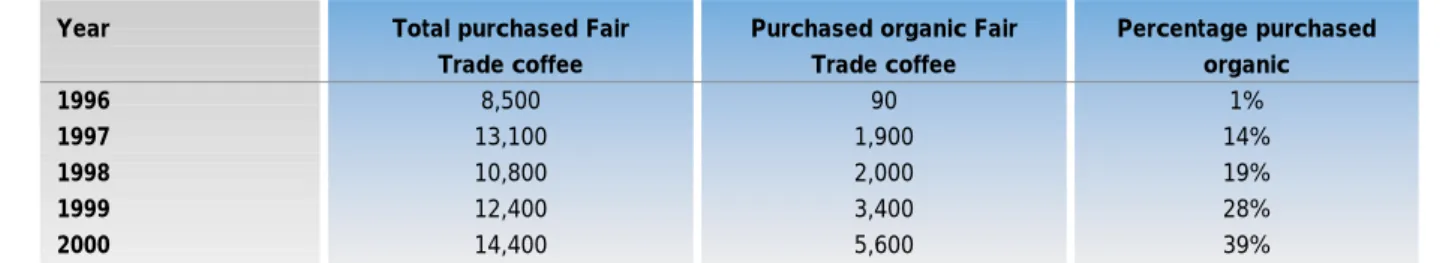
Table 9: European Organic and Fair Trade Coffee import in tonnes 1996-2000
Year 1996 1997 1998 1999 2000
Total purchased Fair Trade coffee 8,500 13,100 10,800 12,400 14,400
Purchased organic Fair Trade coffee 90 1,900 2,000 3,400 5,600 Percentage purchased organic 1% 14% 19% 28% 39% Source: FLO-International
Table 10: Sources of Fair Trade organic green coffee for Europe 1998 – 2000 in tonnes
Country Bolivia Cameroon Colombia Costa Rica Dominican Republic Guatemala Honduras Indonesia Mexico Nicaragua Peru Tanzania Total 2000 203 36 38 13 7 583 12 424 2,551 615 1,074 36 5,592 1999 181 72 0 17 0 174 55 0 2,646 173 289 17 3,624 1998 17 0 14 0 0 110 0 0 1,662 63 138 0 2,004 Source: FLO-International
FOB prices depend only partly on con-sumer willingness (FOB = Free On Board: price paid for coffee excluding transport costs from the port in the producing coun-try to the final destination). Price setting on the organic market is not regulated as it is on the Fair Trade market. Prices are set as a result of negotiations between the seller and the buyer. They roughly follow world market prices.
1.3.1 Conventional coffee prices: extremely low
As at the end of 2001, prices for conven-tional coffee have reached their lowest level for 40 years. International prices for green coffee have more than halved from January 1999 to January 2002. Govern-ments in coffee producing countries are witnessing dramatically reduced foreign exchange earnings. One of the factors behind the crisis has been oversupply in the global coffee market: supply has out-stripped demand in the last three seasons. Yet, it is often forgotten that one cause of oversupply was the push to promote ex-port earnings under market reforms.
Vietnam, for example, produced less than 4 million 60-kg bags of coffee in 1995/96. In 2000/01, it produced over 11 million. Furthermore, the crisis is not simply a matter of oversupply but also of deregula-tion of internaderegula-tional and domestic markets and of shifting power balances within the global coffee chain.
For conventional green Arabica coffee beans, the world market price at the be-ginning of 2002 is about 45–50 US cents per pound FOB. For the Robusta coffee the world market price is about 30–35 US cents per pound FOB (depending on
commodity market values plus country bonus).
Most sources in both producing and im-porting countries do not foresee significant price improvements in the short and medium term. Colombia, Mexico and Central America started a regional plan to cut production of low-quality coffees and to remove low-quality coffee from the mar-ket. But this has not yet impacted on prices. With current prices already close to or even below the cost of production in many countries, sustainable coffees and the premiums they fetch in the market-place are one of the few bright spots in an otherwise dismal socio-economic situation for coffee producers. The law of the mar-ket will force many producers to give up coffee production – or to look for alterna-tives such as organic and Fair Trade cof-fee or other crops than cofcof-fee. The spe-ciality coffee market certainly offers new openings for some producers. However, any long-term solution to the historic slide in coffee prices needs to target the ‘main-stream market’ as well.
1.3.2 Fair Trade and organic prices: high premiums The organic price-mechanism is generally a premium of around 20–40% on the commodity market value. The premium is even higher if the market price falls below the cost of production.
The Fair Trade-mechanism of FLO works as follows (FLO-International established conditions for the purchase of fair trade coffee): It guarantees small farmers a fair price for their coffee (but there is no guar-antee that the cooperative will be able to sell the coffee under FLO conditions, even if the cooperative is entered in the regis-ter). It provides access to affordable credit facilities and helps them to stay out of debt to local lenders. It creates direct trade links between farmers and their co-operatives and importers. It promotes a new relationship that links consumers and buyers with farmers. Buyers and sellers will endeavour to establish a long-term and stable relationship in which the rights and interests of both are mutually
respected. All other customary conditions applicable to any international transaction will apply, such as the conditions of the European Contract of Coffee.
In Table 11 an overview is given of prices set for Fair Trade / organic coffee. The minimum Fair Trade price is the minimum floor price, below which the coffee cannot be bought (FLO sees this as the minimum price necessary to cover costs of produc-tion). For Fair Trade plus organic coffee a standard extra premium is paid.
For Arabicas the New York ‘C’ contract is the basis of calculation (US cents per pound, plus or minus the prevailing differ-ential for the relevant quality, basis FOB). For Robustas, the London ‘LCE’ contract is the basis of calculation (US dollars per metric tonne, plus or minus the prevailing differential for the relevant quality, basis FOB). Over these prices, there shall be a fixed premium of 5 US cents per pound (pounds=lbs; 100 lbs = 45.36 kg). For certified organic coffee, an additional pre-mium of 15 US cents per pound of green coffee will be due. To protect the produc-ers, minimum prices have been defined which vary according to the type and ori-gin of the coffee.
In general premiums paid for organic cof-fee increase as the world market price decreases. Most coffee experts expect price premiums to remain at this level for at least a few years.
The minimum prices for Fair Trade organic coffee are as follows: Washed Arabica organic: 141 US cents per pound FOB port of origin. Non washed Robusta or-ganic: 121 US cents per pound FOB port of origin.
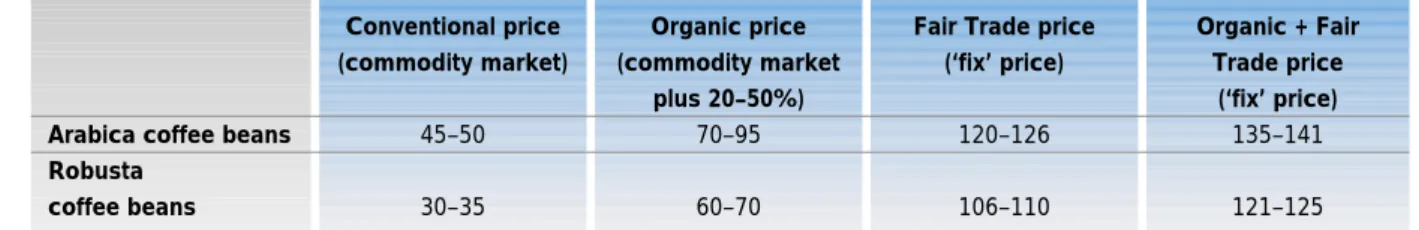
Table 11: Fair Trade and organic FOB price for coffee beans in US cents per pound (lb), as in January 2002
Arabica coffee beans Robusta coffee beans Conventional price (commodity market) 45–50 30–35 Organic price (commodity market plus 20–50%) 70–95 60–70
Fair Trade price (‘fix’ price) 120–126 106–110 Organic + Fair Trade price (‘fix’ price) 135–141 121–125 Source: FLO-International, FiBL
Fair Trade + certified organic Regular Fair Trade
Table 12: FLO-International premium prices in US cents per pound (lb) FOB in 2001
Type of coffee Washed Arabica Non-washed Arabica Washed Robusta Non-washed Robusta Central America, Mexico, Africa, Asia
126 120 110 106 South America, Caribbean, Area 124 120 110 106 Central America, Mexico, Africa, Asia
141 135 125 121 South America, Caribbean Area 139 135 125 121 Source: FLO-International
1.4 Market potential
Future development of the organic coffee market is closely related to the conven-tional coffee market and price develop-ment. Global overproduction will continue to depress conventional coffee prices un-less production capacity decreases con-siderably. As a consequence, the price differential between organic and conven-tional will stay much higher than for other organic products. However in most Latin American countries (except Brazil), price premiums for organic coffee which is not sold as Fair Trade coffee do not currently (beginning of 2002) cover the production
costs of organic coffee. It is mainly com-mercial organic coffee growers dependent on off-farm labour which face great prob-lems if the harvested crops fail to pay off the expenses. Small-scale farmers who depend mainly on family labour may have more flexibility to endure this coffee crisis.
Another trend in the coffee market is the division into a cheap segment for mass-market products and an AA-quality seg-ment for top quality. A consequence of this trend may be that countries with com-parative cost disadvantages (mountain regions, small-scale farming structures) will mainly produce quality coffee whereas larger producers will gear up for cheap mass-market production.
High price-differentials will be the main limiting factor for development of the or-ganic coffee market in the coming years, as far as organic Fair Trade and conven-tional Fair Trade coffee are concerned; the extremely high price differential is turning consumer opinion back towards conven-tional or ‘just’ organic coffee (turnover of non-organic Fair Trade decreased by
about 10% in 2001!). The second big limit-ing factor is the inefficient distribution of organic coffee in Europe: as ever, the bulk of this is still sold in natural food stores. This results in smaller cargoes and more costly structures.
However, market-shares of organic coffee are expected to grow slowly in parallel with the growing organic food market. Generally, growth is expected, but not at such a rapid pace as in the general or-ganic food market. Oror-ganic and Fair Trade coffees fill a market niche that is rewarded with a premium price and can provide su-perior environmental, economic and social benefits to producers. Producers, traders and industry are already benefiting, in terms of increasing sales and higher prices, from the product differentiation, improved quality and price premiums of sustainable coffees. The organic coffee segment is growing steady. There are good reasons to be optimistic about the future of organic coffee:
• Consumers have responded favourably when considering the growth trends for organic coffee.
• Consumer demand may not currently be the primary driving force behind the sustainable coffee market. Producer groups and development projects of NGOs and industry play a key role in developing organic coffee markets. • A number of coffee traders not
cur-rently selling organic coffee expect to begin selling it. Not surprisingly, some of the largest European and North American retailers are exploring these markets as well. This represents a con-siderable opportunity for new business. • Possibilities also exist for consumption
in the domestic markets of some pro-ducer countries. Mexico, Jamaica, and Brazil, among others, are already suc-cessfully demonstrating this with higher quality domestic sales.
• Organic coffee will show overall growth and become well established within the expanding speciality coffee supply and sales market. But whether Fair Trade coffee will continue to play the same role must be a matter of doubt as long as the price setting is handled so rigidly. This problem will be further in-tensified by the fact that countries such as Vietnam will also move into organic coffee. The oversupply will work to the detriment of Fair Trade coffee, as long as the world market price fails to rise and the pricing policy is not handled more flexibly. Even now,
Fair Trade coffees have long been sold below their regulation price. All legal possibilities for devaluation have been exploited. This alone is sufficient evi-dence that changes are inevitable.
From the perspective of producers, organic and Fair Trade coffees provide many advantages and help to improve smallholders’ risk management strategies:
• Diversification of production (multi-cropping) on a sustainable coffee farm offers several advantages to a farmer. • Coffee certification can be an excellent
hedge against market price downturns since most forms of certification can generate premiums although there are no guarantees.
• Reducing or eliminating the use of pur-chased inputs limits the farmer’s ex-penses and therefore his subsequent market exposure.
However, for many producers, conversion time, preparation, and certification are costly and sometimes difficult. It is clear that professionally organized producer groups and producers with a clear strat-egy for quality production and a flair for coffee specialities have the best potential for the future. One of the biggest
challenges for organic coffee producers is to reduce the price differential between conventional and organic to a competitive level. An important contribution of the pro-ducers in order to achieve this goal is to reduce production costs – and to accept long-term contracts with reasonable price differentials.
Is there overproduction of organic coffee?
A considerable number of producers have been unable to find a market for their
cer-tified organic coffee in the last few years. Since then, rumours of overproduction of organic coffee have run around the globe. The facts are:
• A strong demand exists for high quality organic and organic Fair Trade coffee. • There is a danger of overproduction of
Fair Trade coffee.
• There is a trend for innovations and new speciality products in the organic coffee market: Cappuccino, expresso
(increases the demand of Robusta), new blends, single variety coffees, sin-gle provenance coffees, etc.
• Low level organic certification (e.g. EU-certification without additional label) and coffee certified only as organic (not Fair Trade) might considerably limit the number of interested clients.
• Organic certification companies earn their living from their customers, which are farmers. Specifically in the coffee sector there have been cases of or-ganic certifiers quoting an unrealisti-cally high market potential in order to obtain orders. More responsibility on the part of organic certifiers is called for in this respect.
• The risk of overproduction is greatest when conversion is based on superfi-cial kinds of market research. Often producers, NGOs and project coordi-nators fail to realize that although po-tential demand may appear to multiply as a range of buyers are interviewed, its true level is nowhere near as high.
• Generally: compared to the share of organic products in the total food mar-ket (2%), the share of organic coffee in the total coffee market (0,5%) is low. There is no indication that organic cof-fee is less attractive to consumers than organic products on average.
Therefore, there are no grounds for generalized statements about overpro-duction of organic coffee.
Another fact is that there really are pro-ducers who sell organic coffee in the con-ventional market or for reduced organic premiums. What are their motivations?
• The premium for organic and Fair Trade coffee is currently very high, due to the extremely low prices being paid for conventional coffee. For some pro-ducers it might seem to be good busi-ness even if they sell their coffee for a lower-than-usual organic premium. This, of course, puts the premium for all organic coffee producers under pressure.
• A number of non-governmental organi-zations (NGOs) and donors are sup-porting producers in developing coun-tries to set up organic coffee projects (e.g. in Nicaragua, Guatemala and Ethiopia). Such projects opened the doors for certified organic coffee
duction to a large number of small pro-ducer groups. However, some of these projects focused mainly on the produc-tion side and did not fully consider the marketing of organic coffee.
Growth prospects for the organic food market are excellent for the next five years. In parallel, the organic coffee mar-ket will grow. Consequently, there will be a demand for future new organic coffee
projects. However, there is a danger of overproduction in the future: The growth potential for organic coffee is a temptation for several producer countries to vastly increase their organic coffee production. If production increases too rapidly, then of course prices could fall considerably. Two considerations are necessary:
1. Public or private programmes and ini-tiatives to support organic coffee pro-duction should always consider sus-tainable development of the market and prepare the producers to market their organic coffee successfully. 2. If, in the rush for new business, quality
and consistency are not maintained then consumers will reject organic coffee.
1.5 Obstacles and wishes expressed by market operators
One important question for organic coffee producers is: ”How do I meet the require-ments of the international market and im-porters?” Recent interviews by FiBL with coffee importers show a number of criteria for purchasing organic coffee (Table 13). Coffee quality and consistency of supply are the two most important attributes in the organic coffee trade. Producers who seek to be competitive must consider how well they can fulfil these two expectations in the future.
Table 13: 10 Major criteria for purchasing decisions mentioned by European importers (by priority)
Major criteria for purchasing decisions 1. Coffee quality and taste
2. Reliability of partners
3. Consistency of supply
4. Stable and fair prices for farmers, processors, traders and retailers
5. Experience of export business 6. Demand: customers are asking for it 7. Desire to have simpler sourcing criteria
and clearer marketing messages; Label confusion
8. Distribution and availability for consumers
9. Quality of the organic certification 10. Authorities
Improvement measures for production and trade
Quality of coffee production, fermentation, prevention of high acid content, optimum taste, optimum varieties, new blends, good assortment and consistent coffee etc.
Marketing and communication, management of producer groups and producers, establish personal contacts with buyers; win-win-cooperation between producers and buyers guarantee sustainable success of a project.
Steady and predictable suppliers (quality and quantity)
The current low conventional prices lead to the question: How long will it be possible to pay constantly increasing price differentials for organic as opposed to conventional? A solution would be long-term contracts be-tween producers and buyers with semi-fixed prices (moving within a defined band, parallel to commodity market).
Know-how, efficient export structures Create unique or different product line
Many producers, coffee traders and manufacturers are in favour of a simpler way of communicating sustainability in the marketplace, in effect a super-seal which combines organic and Fair Trade
The other two most plausible reasons for the lower-than-expected market responses are product availability and consumer education. Many super-markets either do not stock sustainable coffees or offer only one, often as a single origin organic coffee.
Set up local certification systems, improve certification trust and quality Reduce bureaucracy and paper workload in the country of origin and in the import country
1.6 Web information corner Organizations
www.ico.org
International Coffee Organization: The International Coffee Organization is an intergovernmental body whose Members are coffee exporting and importing coun-tries. It administers the International Coffee Agreement and is committed to improving conditions in the world coffee economy through international cooperation, helping price equilibrium by developing demand for coffee in emerging markets and through projects to reduce damage from pests and improve marketing and quality, enhancing coffee growers’ long-term com-petitiveness and contributing to the fight against poverty.
www.fo-licht.com
This website provides information about international reports on coffee and tea and gives details about the conferences going on in this field.
www.Fair Trade.net
Fairtrade Labelling Organizations
International (FLO): In order to co-ordinate the work of the national initiatives and more efficiently run the monitoring programmes, an umbrella organization, FLO was set up in April 1997. A central responsibility for FLO is to collect data and ensure the audit of all Fairtrade labelled products from the producer to the super-market shelf.
www.kaffeeverband.de:
The website of the "Deutscher Kaffee Verband" provides general information about the history, facts and news of cof-fee. A serie of pictures can be found from the plant to the final coffee products and processing
www.naturland.de
The website Naturland- an association for organic agriculture provides detailed information on:
• Standards relating to farming and processing
• Approval procedures for the Naturland label
• The different projects by Naturland • Markets
Coffee traders and importers
Ulrich Walter GmbH Postfach 1269 D-49356 Diepholz Tel.: +49 5441/9856-100 Fax: +49 5441/9856-101 www.lebensbaum.de
Deals in Spices, Teas, Coffee, Herbs
Gepa GmbH
Bruch 4
D-42279 Wuppertal Tel: +49 202 266 830 Fax: +49 202 266 8310
Deals in Coffee, tea, cocoa, nuts and other products
Rapunzel Pure Organics, Inc.
2424 SR-203 Valatie, NY 12186 toll free +1 (800) 207-2814 Tel: +1 (518) 392-8620 Fax:+1 (518) 392-8630 www.rapunzel.com
Deals in Chocolate, Coffee, Juices, Sugar, Seasonings, Soups and Snacks
Fritz Bertschi AG Kaffee-Rösterei Rührbergstrasse 13 CH- 4127 Birsfelden Tel: +41 61 / 313'22'00 Fax: +41 61 / 311'19'49 www.bertschi-cafe.ch
Deals in organic and conventional coffee
Blaser Café AG
Güterstr. 4 CH-3001 Bern Tel: +41 31 380 55 55 Fax: +41 31 380 55 40
Deals in Coffee and Tea
Claro fair trade AG
Fairer Handel Byfangstr. 19 CH-2552 Orpund BE Tel: +41 32 356 07 00
e-mail:Claro.fairtrade@bluewin.ch
Deals in tea, coffee, sugar and sweets and other fair trade products
Cretti & Co. Inh. Fritz von Allmen
Kaffee-Surrogate-Fabrik Hauptstr. 1
CH-9434 Au SG Tel: +41 71 744 05 05 Fax: 071 744 05 07
Deals in coffee and cereals
Eichberg Bio AG
Eichberg 32
CH-5707 Seengen AG Tel: +41 62 777 34 02 Fax: +41 62 777 39 48
Deals in coffee, tea, cocoa, sugar, cereals, fruits, juices, vegetables, dried nuts and fruits, honey, wine
Henauer Kaffee und Tee
Kaffeerösterei Hofstr. 9 CH-8181 Höri ZH Tel: +41 1 861 17 88 Fax: +411 860 37 80 E-Mail:g.henauer@bluewin.ch
Deals in coffee and tea
Bernhard Rothfos Intercafé AG
Rohkaffeehandel Bahnhofstr. 22 CH-6300 Zug ZG Tel: +41 41 728 72 60 Fax:+41 41 728 72 79
Deals with coffee
Traeubler Alois AG Rohkaffee-Import Industriestr. 28 CH-8304 Wallisellen ZH Tel: +41 1 877 60 60 Fax: +411 877 60 66
Table 15 is based on information gathered from producing countries, cocoa
importers, certifiers, consultants, articles in magazines and various sources traced on the Internet.
Several countries are reported to have production in conversion or are preparing themselves otherwise for certification. Among these are Brazil, Cameroon, Côte d’Ivoire, Cuba, Ecuador, Ghana, Guyana, Haiti, Honduras, Indonesia, Panama, Peru, the Philippines, Sao Tomé and Togo. Some might already have commenced production and export.
2.
Market for organic
cocoa
2.1 Production of organic cocoa The annual world production of cocoa has been around 3 million tonnes in recent years. This is a significant change from around 1.5 million tonnes per year in the 1970s and early 1980s. No less than two-thirds comes from West Africa. According to statistics from the International Cocoa Organization (ICCO), eight countries pro-duced more than 90% of the entire world production in the cocoa year 1999/2000:
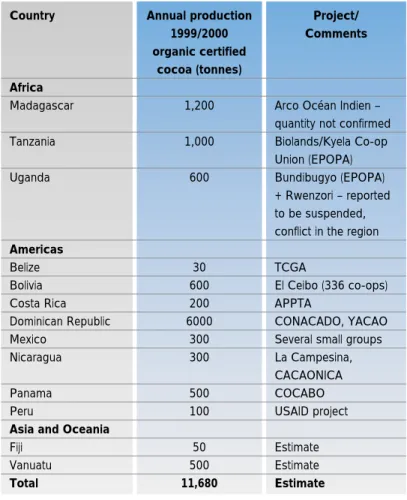
Table 15: Production of certified organic cocoa beans by country 1999/2000 (tonnes)
Country Africa Madagascar Tanzania Uganda Americas Belize Bolivia Costa Rica Dominican Republic Mexico Nicaragua Panama Peru
Asia and Oceania
Fiji Vanuatu Total Annual production 1999/2000 organic certified cocoa (tonnes) 1,200 1,000 600 30 600 200 6000 300 300 500 100 50 500 11,680 Project/ Comments
Arco Océan Indien – quantity not confirmed Biolands/Kyela Co-op Union (EPOPA) Bundibugyo (EPOPA) + Rwenzori – reported to be suspended, conflict in the region TCGA
El Ceibo (336 co-ops) APPTA
CONACADO, YACAO Several small groups La Campesina, CACAONICA COCABO USAID project Estimate Estimate Estimate
Sources: FLO-International, ITC, FiBL Table 14: World production of cocoa beans
by country (tonnes and percentage)
Country Côte d’Ivoire Ghana Indonesia Nigeria Brazil Cameroon Ecuador Malaysia Others Total Annual production (1999/2000) in tonnes 1,325,000 440,000 410,000 165,000 125,000 120,000 95,000 60,000 263,000 3,003,000 Percentage 44 15 14 5 4 4 3 2 9 100
2.2 European import of organic cocoa
2.3 Market development and
potential
2.3.1 Current situation The market for chocolate consumes around 90% of the world production of cocoa beans, the balance being used for beverages, flavours, cosmetics and other purposes.
As for other organic food products, the market for organic chocolate has also in-creased significantly during the 1990s and the beginning of the 21st century.
Production and trade figures for both the European and the North American market differ to an extent that makes it difficult to be specific.
In the early days of the organic movement (1990–1995), certified organic chocolate was produced by small and sometimes new companies focussing on a niche, and the products were sold primarily in health-food stores or specialty shops. Today, su-permarkets also sell these specialized products, but production is still dominated by relatively small and medium-sized chocolate manufacturers with unique brands. Some of them have added other labels to their products as they comply with other sustainability criteria – e.g. Fair Trade. Most of the large and traditional manufacturers of well-known branded products in Europe (e.g. Cadbury and Nestlé, just to mention a few) are not yet in the organic niche or are only just about to make their entry.
In cocoa the processing industry plays an important role. The bulk of imported co-coa goes from processing firms via whole-salers to the organic food trade and World shops. Although supermarkets have sold little organic chocolate so far, there is con-siderable interest. The market for organic cocoa has developed very well to date. Annual market growth in the last three years reached 10–15%. Since Swiss or-ganic chocolate can be exported, and the interest of the large supermarkets in or-ganic chocolate is also set to increase, significant sales growth is also likely in the future (by 5–10% annually).
The North American retail market for certi-fied organic chocolate is not quite as big as the European but growing fast. Some of the certified organic cocoa beans processed in Europe end up with choco-late manufacturers in North America. The large branded groups, e.g. Mars and Hershey’s, are not in this niche – or at least not yet in any significant way.
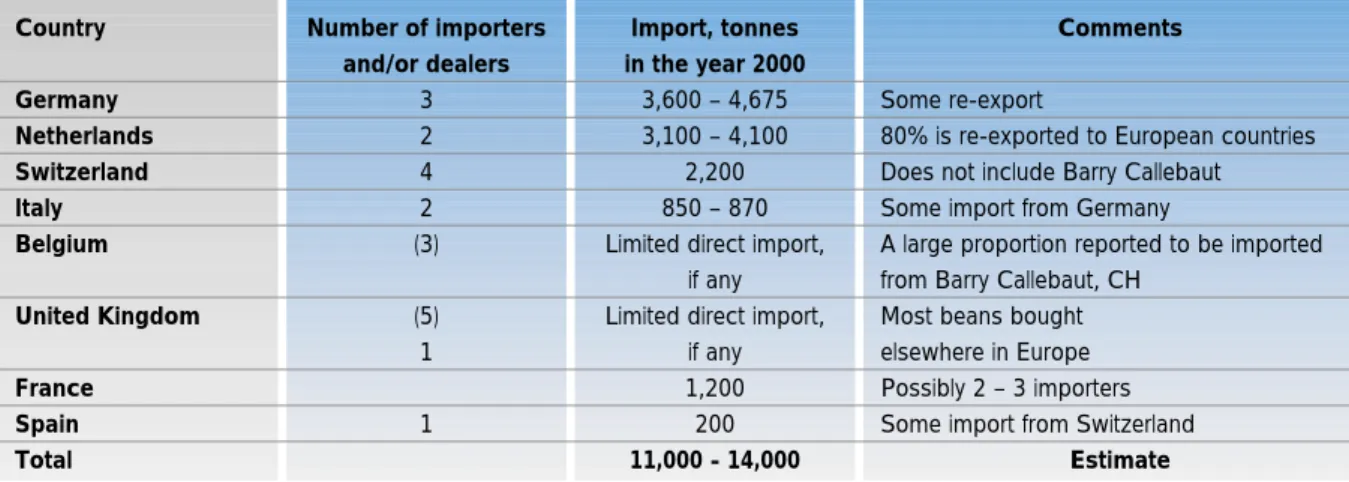
Table 16: European import of certified organic cocoa beans by country in 2000 (number of importers and tonnes)
Country Germany Netherlands Switzerland Italy Belgium United Kingdom France Spain Total Number of importers and/or dealers 3 2 4 2 (3) (5) 1 1 Import, tonnes in the year 2000 3,600 – 4,675 3,100 – 4,100 2,200 850 – 870 Limited direct import,
if any Limited direct import,
if any 1,200 200 11,000 - 14,000 Comments Some re-export
80% is re-exported to European countries Does not include Barry Callebaut Some import from Germany
A large proportion reported to be imported from Barry Callebaut, CH
Most beans bought elsewhere in Europe Possibly 2 – 3 importers Some import from Switzerland
Estimate
2.3.2 Organic, Fair Trade and other labels
Throughout the 1990s much interest was generated and many initiatives were taken in the context of ”sustainability” within the cocoa sector. Organic production is just one of them. Another important element is the Fair Trade movement composed of organizations which guarantee the small farmers a fair price for their produce. Fair Trade organizations have separate pro-grammes for different crops. In Europe, the most frequently seen Fair Trade labels are those of Max Havelaar and Transfair. In 2000, the Fair Trade sale of cocoa prod-ucts in Europe was approximately 1,400 tonnes. The market growth of Fair Trade chocolate in the last three years was also between 10 and 15%. The interest in or-ganic Fair Trade chocolate is increasing.
2.3.3 Prices
The Fair Trade cocoa prices are calculated on the basis of world market prices plus Fair Trade (FT) premiums. The Fair Trade premium is USD 150 per tonne. The mini-mum price for FT standard quality cocoa, including premium, is USD 1,750 per
tonne. If the world market price of the standard qualities rises above USD 1,600 per tonne, the Fair Trade price will be the world market price + USD 150 per tonne.
For Fair Trade cocoa which is also certified organic, there is an additional organic pre-mium of USD 200 per tonne. Fair Trade organic cocoa beans cost a minimum of USD 1,950 per tonne.
A premium of USD 200 per tonne on top of USD 1,600 corresponds to an
additional 12–13%. However, if the prod-uct is not part of a Fair Trade
arrangement, there is no secured premium or bonus for certified organic alone. It fluc-tuates with market conditions. Prices for certified organic cocoa fluctuated in 2001 between 1300 and 1500 USD/t (FOB port of origin).
In the long-term, it is generally hard to get too excited about conventional cocoa prices unless there is a natural disaster or these low prices lead to more crop neg-lect. A possible problem looming for co-coa is the increasing focus on child labour in the cocoa harvest. Fair Trade initiatives state that the world market structure and the abject poverty that results from this are rather to be pointed at as the cause of abuse of child labour, and that a boycott will not solve the problem unless other measures are taken to improve the farm-ers’ economic situation.
2.3.4 Market potential
In view of the persistent expectations of expansion of the market for organic co-coa, a shortage in supply was feared, es-pecially after the hurricane George that hit the Dominican Republic, the world largest producer of organic cocoa. Therefore some of the larger operators in the organic cocoa market saw the market opportunity, and bought considerable quantities in the 1999–2000 season to ensure availability. Still, the market is yet waiting for the boom to happen and the organic cocoa harvest of 2000–2001 is waiting in the
warehouses to be sold, causing a down-ward pressure on the price for organic beans. There are only very few traders that deal in larger volumes and also they see themselves cornered now that supply is largely covering current demand. The re-sult is that – if at all – organic cocoa is bought at conventional market prices or just slightly above the New York level, as producers do not see keeping the cocoa in store as an alternative. Only producers with large capital reserves can afford to do so. These large producers have only re-cently converted to organic production, as it seemed to be a market opportunity.
The large additional volumes suddenly entering the market have the
consequence that especially Latin American small farmers’ organizations, for whom organic production was a viable alternative, loose their market access completely, as it is just easier and cheaper to buy from larger producers. Latin American cocoa is not the mainstream quality that is used for the production of an ‘ordinary’ chocolate, as this is generally made from West-African quality.
The reluctance of the big companies and supermarkets to introduce organic choco-late is still rather an issue of availability than of price, although price is used as an argument. Whereas the availability of African organic cocoa stays way behind demand, the technical skill of smaller chocolate manufacturers proves that very good chocolate can be made from beans that used to be rejected by the conven-tional chocolate industry. The range of the retail price for chocolate – also for organic – is set by the supermarkets before even the raw material is bought or cost calcula-tions can be made. Producers are there-fore forced to deliver organic certified co-coa at prices that are way below realistic cost of production and certification.
2.3.5 Obstacles and wishes expressed by market operators
One important question for cocoa produc-ers is: How do I meet the requirements of the international market and the importer? Recent interviews by FiBL with cocoa im-porters show the following answers to these questions:
• From the European importers' point of view, lack of quality and lack of conti-nuity is the main obstacle. They want the supply to expand. This would also help to even out fluctuations in harvest, such as those resulting from natural disasters as seen recently in the Dominican Republic.
• Producers, traders and European im-porters mention that it is necessary to reduce the workload for certification and label schemes and to harmonize the standards. Just an example: The situation can arise that the same chocolate that is sold in the EU as a completely organic product can only be certified as produce under conver-sion in Switzerland. Therefore Swiss importers often bring in the goods via an EU country. By means of this rather senseless diversion, it is possible to circumvent the problem and import the produce into Switzerland as fully or-ganic.
• Government bodies in the countries of export want to see administrative pro-cedures in the importing countries sim-plified.
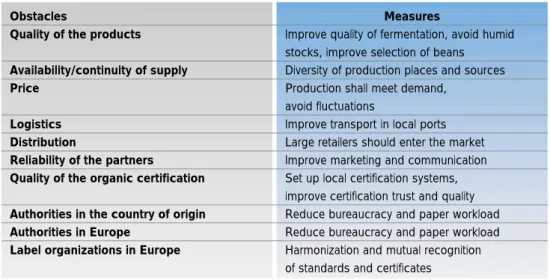
Table 17: Ten major obstacles mentioned by European importers for the import of organic cocoa (by priority):
Obstacles
Quality of the products Availability/continuity of supply Price
Logistics Distribution
Reliability of the partners
Quality of the organic certification Authorities in the country of origin Authorities in Europe
Label organizations in Europe
Measures
Improve quality of fermentation, avoid humid stocks, improve selection of beans Diversity of production places and sources Production shall meet demand,
avoid fluctuations
Improve transport in local ports Large retailers should enter the market Improve marketing and communication Set up local certification systems, improve certification trust and quality Reduce bureaucracy and paper workload Reduce bureaucracy and paper workload Harmonization and mutual recognition of standards and certificates Source: FiBL
2.4 Web information corner www.icco.org
International Cocoa Organization, London (ICCO)
www.maxhavelaar.org
Max Harvelaar Foundation, fair trade
www.fairtrade.net
Fairtrade Labelling Organizations International (FLO)
www.rainforest-alliance.org The Rainforest Alliance, USA
www.greenandblack.com
Green and Black’s, chocolate, United Kingdom
www.ocpchocolate.com
Organic Commodity Products (OCP), USA
www.intracen.org
International Trade Centre UNCTAD/WTO (ITC)
www.sippo.ch
Swiss Import Promotion Programme (SIPPO)
www.tradinorganic.com
Tradin Organic Agriculture B.V. The Netherlands
www.barry-callebaut.com
Barry Callebaut Sourcing AG, Switzerland
www.gerkenscocoa.com
Gerkens Cacao BV, The Netherlands
www.lasiembra.com
La Siembra Co-operative Inc., Canada
www.cargill.com
Cargill Incorporated, USA
www.edfman.com
ED&F Man Cocoa Ltd., United Kingdom
http://europa.eu.int/eur-lex/de/ lif/dat/1991/de_391R2092.html The EUR-Lex website contains all texts pertaining to EU Regulation No. 2092/91 on organic production in all the languages of the EU.
http://www.prolink.de/~hps/
A consolidated (but unofficial) text incorpo-rating all amendments, which is regularly updated.
http://www.ifoam.org/accredit/index.html This is the accreditation programme of the International Federation of Organic Agriculture Movements.
http://www.blw.admin.ch/
The website of the Swiss Federal Office for Agriculture (Bundesamt für
Landwirtschaft) provides detailed informa-tion on:
• The Swiss Organic Farming Ordinance • Forms for attestation of equivalence
and individual authorization to import • Direct payments for organic farms • Cultivation of organic products.
http://www.blw.admin.ch/nuetzlich/links/d/ zertifstellen.htm
A list of European certification bodies can be downloaded from this page maintained by the Swiss Federal Office for Agriculture.
http://www.admin.ch/ Original texts of: • Swiss legislation
• The Swiss Ordinance on agricultural imports.
http://www.zoll.admin.ch
Customs tariffs of the Swiss Federal Customs Administration.
• Production method (orthodox or CTC-production),
• Period of picking (First Flush, Second Flush, Autumnal),
• Type of tea leaf (whole leaf, broken leaf, fanning),
• Special teas (e.g. Souchong, White Tea, Silver Tips, Oolong).
The generic term ‘tea’ refers to a class of beverages featuring the leaves of the Camellia sinensis plant, herbal
components, or a combination of both. All modern tea varieties, green, black as well as oolong are descended fromC. sinen-sis.
3.2.2 Style of processing Two methods of tea processing can be roughly distinguished, the orthodox method and CTC-production. The ortho-dox methodis more comprehensive and time-consuming compared with CTC pro-duction. In general, tea is processed in five steps:
1. Wither,
2. Crush, tear & curl, 3. Ferment,
4. Dry, 5. Sort.
Finally, the sorting results in four different types of tea:
• Whole leaf tea,
• Brokens (from broken and smaller leaves),
• Fannings (tea from small leaf pieces for tea bags and mixtures),
• Dust (or fines, finest filtering for tea bags)
3.
Market for organic tea
3.1 Introduction
The number of organic tea producers and the volume of organic tea traded on the world market has increased substantially over the last few years. This development can be explained by a number of factors. In the first place, tea farmers have become more aware of environmental problems (erosion, pesticide residues in tea plants) and severe health hazards con-nected with an intensive system of tea production. A further reason for the rise in organic tea can be explained by the fact that the demand for organic tea has grown constantly as a result of increased consumer awareness of pesticide residues and heavy metals in conventional teas. Furthermore, there is much evidence that organically grown teas are generally of better quality due to the avoidance of arti-ficial additives.
Until now, little information or reliable sta-tistical data about the organic tea market has been available. For this reason, this chapter is mainly based on expert knowl-edge and estimates of international certi-fiers, traders and producers such asIMO, Kloth & K hnken, Lebensbaum, Oasis, Stassen Natural Foods and Chamongas well as an unpublished report by U. Walter (Lebensbaum, Germany).
This chapter will exclusively focus on the production of traditional tea varieties based on the plant Camellia sinensis. Other varieties based on other plants (African Rooibos tea, South American Yerba Mate tea, Lapacho tea and African Honey Bush) are not considered here, even if some of them are currently fashion-able and are increasingly replacing tradi-tional varieties on supermarket shelves and in consumers’ shopping baskets.
3.2 Production of organic tea 3.2.1 Classification of tea
The organic tea market is divided into nu-merous varieties and qualities. Tea can be distinguished roughly according to the following characteristics:
• Origin (e.g. Darjeeling, Assam, Nilgiri, Ceylon),
• Degree of fermentation (black tea, green tea, half fermented tea),
Camellia sinensis
The termCTCmeans ‘crushing, tearing, curling’ and can be understood as an effi-cient processing method, by which the leaves are torn and curled in one step af-ter the withering. Due to the leaves’ larger surface area, the process of fermentation is accelerated. Fannings, dust and to some extent also brokens are mainly processed by the CTC method. In con-trast to CTC production, the orthodox pro-cessing method leads to higher quality. Tea processed by the CTC method has a stronger taste but not such an excellent flavour. Due to the strong taste this type of tea is mainly used for cheaper tea bags.
The CTC production method is common in some parts of India and Kenya. In Sri Lanka, tea is processed almost entirely by the orthodox method. In the Darjeeling district of India the producers are not al-lowed to produce CTC tea.
A further important type of processing is the production of ‘green tea’. For this type of tea, leaves are steamed or lightly baked directly after picking, in order to inactivate the enzymes for fermentation. By this technique the tea retains its typical green colour and its typical taste. Later follow the processes of rolling, drying and sort-ing. Green teas are mainly produced in Asia.
3.2.3 Yields
Tea yields vary according to climatic and topographic conditions from 150 – 750 kg per hectare in the Darjeeling district to up to 2500 kg per hectare in Assam. High yields are also achieved in Sri Lanka, South India and South China. In organic production systems average yields are 30 – 35% lower than in conventional tea pro-duction. The extreme differences in poten-tial yields necessitate different minimum prices in order to cover production costs and thereby have an impact on the con-version rate to organic farming.
The harvest period in the Darjeeling district takes nearly nine month and starts in March with the famous ‘First Flush’, which gives an extraordinary aromatic quality. However, only the ‘Second Flush’ (May to June) provides the finest qualities. Tea leaves harvested in autumn have a spicy aroma. Leaves of the so-called ‘In-betweens’ and ‘Rain Teas’ are harvested in the wet periods between spring and autumn and are mainly used for tea blends.
The processing of harvested tea leaves needs special skills and a great deal of experience. On-farm processing is very common in most of the existing produc-tion sites.
3.2.4 Countries and regions of origin
The main places of production for organic tea are located in India, China and Sri Lanka (Ceylon). In India and Sri Lanka, organic tea has been grown for more than 15 years. In China the first tea gardens were converted to organic farming in the 1990s. In contrast to coffee production, tea is mainly cultivated in large tea gar-dens and not on small farms.
The following information, provided by the world’s largest certifier of organic tea gar-dens, IMO, indicates the area already con-verted and in conversion which is certified by IMO1. As shown in the table 18 below, 63% of the current area managed organi-cally is still in conversion. This means that in the next few years, the volume of or-ganic tea traded on the market will rise extraordinarily. Consequently, either the demand for organic tea will have to increase as well or the world price will drop drastically.
In the next section, the situation of supply and prices in the most important organic tea regions are discussed briefly.
Table 18: Number of hectares of certified organic
and in conversion tea areas world wide (December 2001)
Region India/Sri Lanka China Other countries Total Organic Tea, Area in ha 4300 1940 1025 7265 In-Conversion Tea, Area in ha 3040 1009 540 4589 Source: IMO 2001
China
China is one of the major centres for the production of green tea worldwide and a major exporter to Europe. Approximately 650,000 tonnes of tea are produced per year. One of the most important Chinese production centres is located to the south of Peking, along the Pacific coast. 40–50 tea gardens of this region are currently in-conversion or fully converted. In total 4,000–5,000 tonnes of organic green tea are produced in China per year (approx. 0.8% of total production). This enormous amount has led recently to an oversupply situation so that the price decreased. It is estimated that currently just 800–1000 tonnes of organically produced tea can legitimately be exported as organic tea; 300 – 500 tonnes of it to Germany. Currently, there is no domestic demand for organic tea in China.
Due to the existing oversupply situation a drop in prices was observed in China. Whereas the premium price for organic tea in 1999 was 300–400% (USD 8/kg) on top of the price for conventional tea, the premium dropped to 20–30% (USD 2/kg). For most tea producers, this market price is far too low to cover the production costs (USD 6/kg minimum).
India
India is the largest tea producer world wide. In total, 820,000 tonnes of tea are produced. It is estimated that
approximately 3,000–3.500 tonnes are produced organically (0.4–0.7%). It can be estimated that currently 1,400–1,800 ha are under organic production. Organic tea production volume per farm varies consid-erably between 20–1000 tonnes per year. A domestic market for organic tea does not yet exist in India. Therefore most of the tea must be exported. Currently a
premium price of 50–100% is paid for or-ganic tea. It is not unlikely that due to the expected increase in organic tea produc-tion and the existing oversupply situaproduc-tion on the world market, the price for organic tea will decline to 30–40% in the coming years.
Organic tea production in India is spread over three main areas, the Darjeeling dis-trict and Assam in the north of India and Nilgiri in the south of India. The organic tea plantations collectively produce under the umbrella of the ‘Indian Bio Organic Tea Association’ (http://www.snonline.com/ib-ota).
Darjeeling district
In the Darjeeling district 10,000 tonnes of black tea are produced per year on an area of 20,000 ha. 14 out of 84 tea gar-dens have converted to organic farming. Most of the tea gardens are managed by international operating companies. It is estimated that 10–15% of the total area of tea has already been converted to organic farming. The organic production volume is estimated at 1,000–2,000 tonnes per year. In total, 500–800 tonnes of it can be ex-ported as organic tea. The price premium is 50–100% higher in relation to conven-tional prices.
Assam
From among the tea gardens of Assam, three have converted to organic produc-tion and two are in conversion. They pro-duce 300 tonnes of organic black tea per year and Germany is one of the main ex-port markets, imex-porting 30–50 tonnes of tea from this region.
Nilgiri
In Nilgiri the highest tea garden world wide is located at an altitude of 2,750 m above sea level In this and another garden in this region 1,500 tonnes of organic tea are produced. Besides these two organic farms, another is still in conversion. The prices paid for organic tea are approxi-mately 80% higher than for conventional teas.
Doars
A small area where ecological tea gardens exist and mainly CTC tea is produced. The quantity of ecological tea produced is aproximately 1000 t.
Label of the Indian organic tea farmers’ association
Important producers
Table 19 indicates the production volume of important organic tea producers in India.
It is estimated that Indian organic tea pro-duction is mainly sold to the United Kingdom (50%) and Germany (37%). Further smaller volumes are exported to the USA (5%) and Japan (5%).
Ceylon (Sri Lanka)
Ceylon, where coffee was formally a tradi-tional crop, many farmers switched to tea after an outbreak of an epidemic fungal disease. Today Sri Lanka produces ap-proximately 300,000 tonnes of tea (90% for export). Stassen Natural Foods were the first tea company to commence with the cultivation of organic tea in Sri Lanka. In 1985 the project started with seven tea gardens. According to Mr. Gaffar from Stassen Natural Foods, today these gar-dens are the oldest organic tea gargar-dens in the world. Since 1987 they have been certified by the German organic farming association, Naturland.
Today 10 tea gardens have converted to organic production. The entire 1,300 ha are managed organically (Dec. 2000). Total organic production is estimated at approx. 800 t (0.25% of total production). An in-crease in the near future to 1,000 t is ex-pected. The price premium for organic tea is approximately 80–150% on top of the conventional price level. Despite a situa-tion of oversupply, the price level for or-ganic tea has remained stable for the last years.
Organic tea from Sri Lanka is mainly ex-ported to Germany, the UK, Australia, France, Italy, Japan and the USA.
Important producers
Table 20 illustrates the known production volume of important organic tea producers in India.
Other organic tea producing countries Other countries with (very marginal) organic tea production are located in Tanzania, Vietnam, Japan, Argentina and Indonesia. However, these countries do not have a significant influence on the world market for organic tea.
3.2.5 Social aspects
The working conditions and income situa-tion of employees in tea gardens vary strongly from country to country. In gen-eral, organic tea production is more labour-intensive (e.g. in most cases organic manure and compost is spread manually onto the fields); thereby organic tea production has a positive impact on the local labour market and improves pur-chasing power in the region.
Table 19: Supply situation for important Indian organic tea gardens Company (region) Chamong (Darjeeling) Pussimbing (Darjeeling) Mullootar (Darjeeling) Bherjan (Assam) Sewpur (Assam) Dalgaon (Dooars) Rembeng (Assam) Oothu (Tirunelveli)) Production figures
Production volume: approx. 85 t Production area: 140 ha Production volume: approx. 95 t Production area: 201 ha Production volume: approx. 70 t Production volume: approx. 40 t Production area: 19 ha
Production volume: approx. 300 t Production area: 195 ha
Production volume: approx. 1040 t Production area: 626 ha
Production volume: approx. 150 t Production area: 136 ha Land in conversion: 22 ha Production volume: approx. 1000 t Source: http://www.snonline.com/ibota
Table 20: Situation of Supply in important Organic Tea Gardens in Sri Lanka
Estate (organization) Iddulgashinna Bio Tea Project (Stassen Natural Foods Ltd.) Venture Group
(Stassen Natural Foods Ltd.) Needwood (Needwood Emmag) Greenfield (Lanka Organics) Koslanda (Maskeliya Plantations Ltd.) Smallholder Co-op
(Gami Seva Sevana) Small Organic Farmers Group (Bio Foods Ltd.)
Production figures
Production volume: approx. 206 t Production area: 353 ha Production volume: approx. 300 t Production area: 290 ha Production volume: approx. 70 t Production area: 94 ha Production volume: approx. 58 t Production area: 70 ha Production volume: approx. 80 t Production area: 160 ha Production volume: approx. 7 t Production area: 83 ha Production volume: approx. 67 t Production area: 214 ha Source: Stassen Natural Foods Ltd., 2001
In India we find an industrial structure of tea production, strongly influenced by for-eign companies. In general, these interna-tional companies are interested in ensuring that certain social minimum social stan-dards are fulfilled for the employees. In regions like the Darjeeling district, more than 80% of all people work in tea gar-dens or in the agri-business surrounding tea production. Many of the international companies work with strong social com-mitment and are willing in part to accept economic losses in order to stabilize the economic situation of the region, which has an unemployment rate of up to 50%. However, due to the current oversupply situation and the falling market price, a number of companies are being forced to reduce their production costs.
In China, the earned income of farm work-ers is very low. While in India a minimum salary rate has to be paid by law, no such obligations are imposed in China. Chinese tea is mainly produced on small family farms. Due to the lower degree of organi-zation, farmers get very low prices from traders. The working conditions on farms are very bad in some parts. There is no national legislation (like that in India) that defines minimum social standards.
In contrast to this situation, in India and Sri Lanka organic tea production is combined with projects that aim to improve the so-cial situation of farm workers. Most of the employees working in tea gardens earn an income above the national average. Most of the workers are organized in unions that fight for the interests of their members.
Many tea gardens manage production in accordance with ‘Fair Trade’ standards. Nevertheless, the Fair Trade system in itself seems unable to guarantee an ade-quate wage level in situations of oversup-ply, where there is a worsening market situation and consumers of organic tea become more and more price-conscious.
3.2.6 Quality and safety aspects In addition to caffeine, tea contains various valuable ingredients like tannic acids, polyphenol, essential oils, fluorine and B-vitamins. Before organic tea is sold, a number of chemical and sensory analyses are undertaken to ensure high quality. The market prices for tea are mainly influenced by sensory tests, where the visual quality of the tea leaves, the aroma, and the taste is evaluated. Besides this, chemical tests
are carried out to analyse possible residues of pesticides and heavy metals. In general there are no crucial quality problems in producing organic tea which could negatively influence consumer ex-pectations.
3.3 Market
Most of the organic tea produced is ex-ported to Germany, the United Kingdom and the US. Organic tea consumption (black and green tea) for the main market destinations is estimated at 600 to 800 tonnes per year in Germany, 1,000 –
1,500 tonnes in the UK and 2000 tonnes in the USA. All other European countries consume a maximum of 100 tonnes of green or black tea per year.
It was mentioned before that currently supply and demand are not in balance. Two main reasons can explain this:
• Due to the advice of the international certifying bodies, a huge number of farms converted to organic tea pro-duction so that the volume of organic tea increased enormously in recent years. At the same time, demand grew, in line with other product groups, at between 10–20%.
• The second main reason concerns the permanently changing consumer trends and tea variety preferences. Whereas in the late 1990s, green tea was the trendsetter for a healthy lifestyle, today teas, like ‘Rooibus’ or ‘Lapacho’ have become more attrac-tive for consumers. After the start of the green tea boom in Europe, count-less small farmers in China converted to organic farming. After a time lag