eCommons
Civil and Environmental Engineering and
Engineering Mechanics Faculty Publications
Department of Civil and Environmental
Engineering and Engineering Mechanics
Fall 2002
Seat Belt Use Compliance in Kansas
Deogratias Eustace
University of Dayton, deustace1@udayton.edu
Teresa M. C. Bartel
Kansas State University
Follow this and additional works at:
https://ecommons.udayton.edu/cee_fac_pub
Part of the
Automotive Engineering Commons
,
Transportation Commons
, and the
Transportation Engineering Commons
This Article is brought to you for free and open access by the Department of Civil and Environmental Engineering and Engineering Mechanics at eCommons. It has been accepted for inclusion in Civil and Environmental Engineering and Engineering Mechanics Faculty Publications by an authorized administrator of eCommons. For more information, please contactfrice1@udayton.edu, mschlangen1@udayton.edu.
eCommons Citation
Eustace, Deogratias and Bartel, Teresa M. C., "Seat Belt Use Compliance in Kansas" (2002).Civil and Environmental Engineering and Engineering Mechanics Faculty Publications. 5.
Journal of the Transportation Research Forum. Published inTransportation Quarterly,
S
afety seat belts are regarded as theeas-iest and the most effective way of reducing the number of highway fatal-ities (National Highway Traffic Safety Administration [NHTSA 2000]; Stoke 1996), and strong vehicle occupant protection laws are the most effective way to increase safety belt use (NHTSA 2000). The increase in seat belt use in the United States and other coun-tries has been largely attributed to mandato-ry seat belt use legislation (Rivara et al. 1999). Many fatalities and injuries in motor vehicle crashes could be avoided if more pas-sengers used their seat belts (Bureau of Transportation Statistics [BTS 1999]). The National Highway Traffic Safety Adminis-tration estimates that seat belts saved 10,750 lives in 1997 and if all occupants of passen-ger vehicles buckled up, an additional 9,601 lives could have been saved (BTS 1999).
The United States has been lagging behind
other developed countries in enacting strong seat belt use laws and strengthening enforce-ment. Enforcement, fines, and types of legis-lation differ very widely among states and hence there is a wide range in compliance among states.
The purpose of the study was to observe Kansas shoulder seat belt use (adult, and older child—4-14 years old), and younger children’s (birth-3 years) safety seat compli-ance.
Types of Safety Seat Belt Use Laws:
Primary vs. Secondary Enforcement
The safety seat belt usage laws have been of two general types: primary or “standard” seat belt enforcement laws and secondary seat belt enforcement laws. The difference between these seat belt enforcement laws is described below:Seat Belt Use Compliance in Kansas
Passenger vehicle occupant restraints are regarded as the easiest and the most effective way of reducing the number of highway fatalities. Strong vehicle occupant protection enforce-ment laws are regarded as the most effective way to increase seat belt use. The increase in restraint use in the United States and other countries has been largely attributed to mandato-ry seat belt use legislation. Many fatalities and injuries in motor vehicle crashes could be avoid-ed if more passengers usavoid-ed their seat belts. Studies have shown that primary laws have been more effective in seat belt use compliance than secondary laws. Also, legislation has been found to be more effective in increasing seat belt use than educational or incentive programs in the absence of legislation. The United States has been lagging behind other developed countries in enacting strong seat belts use laws and enforcement strengthening. In Kansas, the seat belt usage compliance rate was 60% in 2000, which was far below the national aver-age of 71%. The seat belt fine for Kansas is among the lowest in the US and is regarded by the National Highway Traffic Safety Administration (NHTSA) as not adequate. In Kansas, the younger child’s compliance rate is the highest while the older child’s compliance rate is the low-est among vehicle occupants’ groups. Pickup truck occupants consistently had the lowlow-est com-pliance rates as compared to cars, sports utility vehicles (SUVs), and vans.
• Primary enforcement laws: a citation can be issued whenever a police officer observes an unbelted driver or passenger. In other words, enforcement authorizes police officers to ticket motorists solely for not wearing seat belts.
• Secondary enforcement laws: a citation for not using a seat belt can be issued only if the vehicle has been stopped for some other offense. By law, a police officer is not allowed to stop a vehicle and issue a ticket when observing motorists not wear-ing seat belts if they are breakwear-ing no other law.
The issue of primary enforcement as com-pared to secondary enforcement of seat belt laws is restricted to the United States only. The mandatory seat belt use laws in West-ern Europe, Canada, Australia, and New Zealand provide for primary enforcement. Furthermore, seat belt use is also required for rear seats for these countries. In 1993 Cali-fornia became the first state to change a restraint law from secondary to primary enforcement (Rivara et al. 1999). According to NHTSA (2000), as of January 2000, only 16 states, the District of Columbia, and Puerto Rico have primary laws in effect. Thirty-three states have secondary enforce-ment laws and one state has no seat belt use law.
The National Highway Traffic Safety Administration (1999) argues that a primary seat belt law is much more enforceable than a secondary law and by allowing for primary enforcement it enhances the perceived importance of the seat belt law with both the public and the police. Primary enforcement sends a clear message that the state views seat belt use (and the seat belt law) as being essential for the safe operation of a motor vehicle (NHTSA 1999).
The National Highway Traffic Safety Ad-ministration, a federal agency responsible for highway safety issues, has sponsored much research related to highway safety and is the
major resource if one is interested in high-way safety information at federal and state levels. NHTSA (1999) has been campaigning for states to adopt tougher safety seat belt use laws, and points out the following argu-ments in its effort (NHTSA 2000) to encour-age state authorities to enact primary enforcement laws:
• A July 1997 poll of registered voters by Public Opinion Strategies found over-whelming public support for primary seat belt use laws—62% of respondents favored it.
• The Presidential Initiative for Increasing Safety Seat Belt Use Nationwide issued in 1997 recommends states enact legislation adopting primary seat belt laws and clos-ing the gaps in child passenger safety laws.
• In 1998, states with primary seat belt laws averaged 17% higher belt use than those with secondary laws, i.e., 79% versus 62%.
• Primary enforcement sends a message to motorists that seat belt use is an impor-tant safety issue that the state takes seri-ously.
• Following California’s change to primary enforcement on January 1, 1993, seat belt use increased from 70% in 1992 to 89% in 1998.
• In attitude surveys, police officers consis-tently prefer primary laws and report that a secondary enforcement law is a major deterrent to issuing citations.
• Experience shows that seat belt use goes up when seat belt laws are actively enforced. For example, in Elmira, New York, a well-publicized enforcement effort from 1985 to 1986 raised seat belt use from 50% to 83%.
• After statewide enforcement and publicity efforts in October 1993 and July 1994
(with 6,364 checkpoints, resulting in 58,883 adult seat belt and 3,728 child seat citations), North Carolina’s seat belt use compliance rate rose from 65% to 81%. • In Canada, where laws are primary, fines
are adequate, with well-publicized en-forcement, belt use averages 92%. In con-trast, the United States averages 70%. • The amount of the fine affects
effective-ness. A NHTSA study revealed that a state with a $20 fine would tend to have a seat belt use rate that is 8% higher than a state with a $10 fine.
Studies have shown that primary enforce-ment laws have been more effective in seat belt use compliance than secondary enforce-ment laws (NHTSA 1999). Legislation has been found to be more effective in increas-ing seat belt use than educational or incen-tive programs in the absence of legislation
(Tipton et al. 1990). Results from the National Occupant Protection Use Survey (NOPUS) conducted by National Highway Traffic Safety Administration (2001) in October 2000 show that the national aver-age of front seat vehicle occupants seat belt use rate was 71%. However, the results also show that overall seat belt use in states with primary enforcement (standard) seat belt laws was 77% compared with 64% in states with secondary enforcement laws.
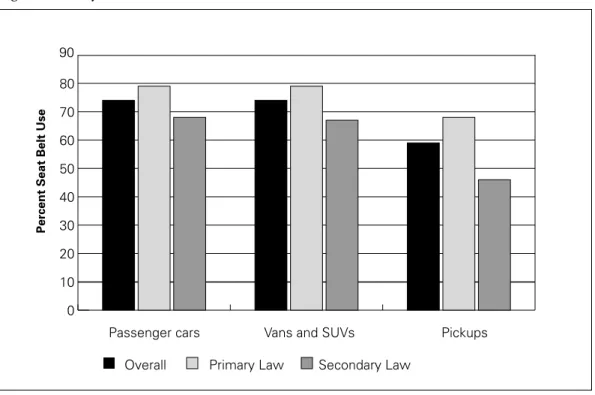
Figure 1 summarizes the NHTSA (2001) study. Safety seat belt use rates for occupants of pickup trucks were significantly lower than use rates for occupants of other passen-ger vehicles. Also, seat belt use in states with primary enforcement was higher than in states with secondary enforcement. The biggest differences were observed for occu-pants of pickup trucks (see Figure 1).
Observations conducted in 1996 (NHTSA 1999) showed that if the driver was
Figure 1: Safety Seat Belt Use Rates in the United States
Source: NHTSA 2001 0 10 20 30 40 50 60 70 80 90 Passenger cars Overall
Vans and SUVs Pickups Primary Law Secondary Law
wearing a seat belt, then 86% of the time toddlers would also be restrained in a safety seat. If the driver was not wearing a seat belt, however, then only 24% of the time will tod-dlers be restrained in the safety seat.
In their intensive review of literature, Rivara et al. (1999) came to the conclusion that there is general evidence, which indi-cates that primary enforcement statutes are more likely to achieve the goals of legisla-tion than are secondary enforcement laws. They further note that the effects of primary enforcement laws appear to be larger and more consistent than secondary enforcement laws for seat belt use, reduction in fatalities, and reduction in serious injuries (NHTSA 1999).
Trends in Safety Seat Belt Use and
International Comparison
The first seat belts were installed by automo-bile manufacturers in the 1950s (NHTSA 1997a). The compulsory installation of seat belts in private passenger cars in most coun-tries started at about the same period (1960s and 1970s). For example, Sweden started in 1969 (Fhaner and Hane 1973); Canada, in the late 1960s (Grant 1991); Germany in 1974 (Heinrich 1991); Finland in 1971, Nor-way in 1971, Denmark in 1969, and Iceland in 1969 (Valtonen and Liikenneturva 1991); Great Britain in 1965 (Broughton 1991); and France in 1964 (Lassarre and Page 1991). Rivara et al. (1999) reported that seat belts have been standard equipment for new vehi-cles in the United States since 1968.
Stoke (1996) notes the fact that just because cars come equipped with safety seat belts does not ensure they will be used. Despite compulsory seat belt installation in new vehicles, most countries still did not pass legislation to mandate seat belt use. This is surprising since voluntary seat belt use was very low throughout the world. The first law mandating the use of seat belts was enacted in the state of Victoria, Australia, in 1970,
and the remainder of Australia and New Zealand followed within two years (Rivara et al. 1999). In Europe, France was the first country to enact a seat belt use law in 1973. In Canada, the first seat belt use laws were enacted in 1976 by the province of Ontario with the provinces of Quebec, British Colum-bia, and Saskatchewan enacting laws at the end of the following year (Grant 1991). In the United States, the state of New York was the first to pass an adult safety seat belt use law in 1984 (Rivara et al. 1999; BTS 1999). However, Tennessee had already passed a law requiring restraints to be used for infants and children in 1978 (Rivara et al. 1999).
Lassarre and Page (1991) point out that the use of seat belts and nationwide speed limits were two major safety measures taken in 1973 that halted the upward trend of traf-fic accidents and road deaths in France. By the end of 1993, 43 states and the District of Columbia had adopted mandatory seat belt laws (Dee 1998).
The increase in seat belt use in the United States and other countries has been largely attributed to mandatory seat belt use legisla-tion (Dee 1998; Rivara et al. 1999). The Commonwealth of Virginia’s experience can be used as an example to show the effective-ness of mandatory seat belt laws in increasing users’ compliance. The seat belt use survey done in 1983 showed that the seat belt use rate in urban areas of the state was 17.3%. But one year after the mandatory seat belt use law was passed in 1987 (though a secondary enforcement law), seat belt use rose abruptly to 66.8% (Stoke 1996). Stoke who has been studying seat belt use in Virginia for many years concludes by stating that “immediately after the effective date of the mandatory safe-ty seat belt law, safesafe-ty belt use by adult occu-pants increased significantly and has general-ly remained high each year since.”
Road types affect compliance. Studies have discovered that differences in seat belt use are greatest between urban streets and rural area highways (Makinen and
Hagen-zieker 1991; Lassare and Page 1991). Simi-lar studies have shown the same conclusion. For example, Broughton (1991) found that seat belt use rates decline with road class, and are lower on built-up roads with speed limits less than 40 mph than on nonbuilt-up roads with speed limits greater than 40 mph. Broughton also noted that men are less like-ly than women to wear seat belts, and use rates increase with age among adults (see also Dee 1998).
Seat Belt Survey Methodologies
Seat belt usage figures are usually based on daytime measurements during working days. The method of measuring seat belt use has been mostly observational and is of two types, either unobtrusive observation, or stopping cars at suitable sites (obtrusive observation). However, a questionnaire for-mat of seat belt use has also been employed (Tipton et al. 1990; Grant et al. 1991; Stoke 1996). The National Highway Traffic Safety Administration has been conducting seat belt use surveys nationally, and its method, known as the National Occupant Protection Use Survey (NOPUS), is generally an obser-vational type of survey.
The Kansas Study
The Kansas Department of Transportation (KDOT) in collaboration with the School of Family Studies and Human Services at Kansas State University conducted a seat belt use study in the summer of 2000, which is summarized below. A similar study was also conducted in 1999.
Study Overview
The study included 548 sites across 20 coun-ties in Kansas at preselected road sites based on the specifications and requirements of the Kansas Department of Transportation. The 20 counties were selected from the state’s 38
counties that constitute 85% of the total population in the state. Within each county, 27 to 29 sites were observed at set times of the day on specified days of the week.
The observation form included items on vehicle type, presence of driver’s shoulder belt, driver’s shoulder belt compliance, pres-ence of an outboard adult passenger (adult passenger on front seat), outboard adult pas-senger’s shoulder belt compliance, younger child’s position (if younger child in safety seat, younger child’s safety seat orientation), older child’s position, older child’s shoulder belt compliance, and presence of a Kansas license plate. The rear seat adult passengers were not included, as the Kansas seat belt law does not cover them (NHTSA 1999). The sample included both rural and urban counties. A county was considered “urban” if it had at least a population of 50,000 in 1990.
Survey Methodology
The method used for this survey was unob-trusive observational. It was important for an observer (surveyor) to set up on the prop-er day, propprop-er time, and propprop-er location according to the schedule and maps. As vehi-cles approach the observation site, the observer was to select a qualifying vehicle and survey it for the characteristics to be observed. Qualified vehicle types for this study were specified as automobiles, passen-ger vans, pickup trucks, and sport utility vehicles.
As a vehicle approached in the nearest outer lane, the observer was supposed to note its type and whether it had a driver’s side shoulder belt. As the vehicle passed, the observer was required to note the following: • whether the driver was using the
shoul-der belt;
• if there was an outboard adult passenger and whether the passenger was using a shoulder belt;
• if there was a younger child, younger child’s position, whether the younger child was in the safety seat, and younger child’s safety seat orientation and place-ment;
• if there was an older child (4-14 years old), older child’s position, and whether the older child was using the shoulder belt, and
• as the vehicle passed, the observer also noted if the vehicle had a Kansas license plate.
At each survey site, the observer was sup-posed to record for a total of 40 minutes before moving on to the next designated site location. It was important for the observer to conduct the observations at the proper place, day of the week, and hour of the day. The surveys were conducted during daylight hours between 8 am and 6 pm from Sunday through Saturday.
Reliability of Data
All potential observers who met all initial requirements were given information packets and were provided with the necessary train-ing. Potential observers were given a written exam that was based on the information pre-sented at the training session and in the sur-vey instructional manual. Also, a visual test was provided whereby potential observers were required to fill out the sample observa-tion forms by watching moving vehicles from a videotape. Only those who could give satisfactory results (scoring 85% correct) were selected to continue with the study.
Inter-rater reliability checks were con-ducted on 20% of the 548 sites. This means that two observers were stationed at one site whereby each one completed the forms inde-pendently without any communication. However, if the second observer was present for reliability observation, the primary observer was supposed to inform the
sec-ondary observer which vehicle to be observed (sampled) from the traffic stream as each observation began.
Results
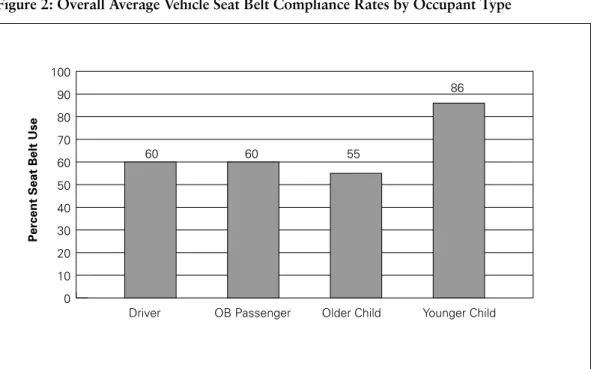
More detailed results of the study are docu-mented in Bartel and Poresky (2000a). More than 33,500 vehicles were surveyed in the 2000 study. Figure 2 shows the overall seat belt compliance rates among vehicle occu-pants studied, i.e., a driver, an outboard adult passenger, an older child (4-14 years old) and a younger child (under 4 years old). The figure reveals that the compliance rate is highest for the young child. The younger child’s compliance was 86% while that of an older child was the lowest at 55%. The driv-er and an outboard adult passengdriv-er both were found to have an equal rate of 60% seat belt compliance.
Figure 3 compares the seat belt compli-ance rates between rural and urban areas. The trend is consistent with higher compli-ance rates in urban areas than for rural areas for all vehicle occupants.
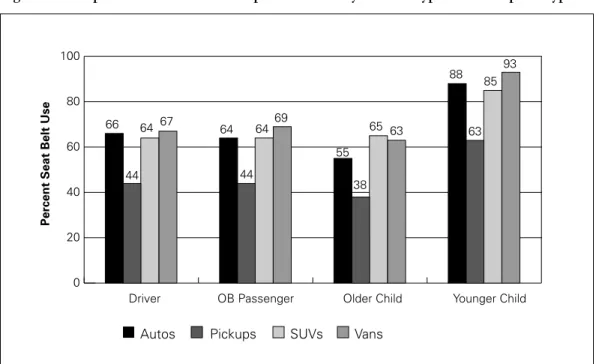
Figure 4 shows the occupants’ seat belt compliance rates by vehicle types. For pickup trucks, the compliance rate is significantly and consistently lower than the compliance rates for the other vehicle types.
Table 1 shows an interesting trend when one examines older children’s seating posi-tion and their seat belt compliance rates. The table shows that 51.6% of the children were observed in rear seats while 48.5% were observed in front seats. There is no seat belt compliance difference between children seat-ed in the front position and those seatseat-ed in the rear position (data analyzed for primary older children only).
0 10 20 30 40 50 60 70 80 90 100 Driver OB Passenger
Percent Seat Belt Use
Older Child Younger Child
60 60 55
86
Figure 2: Overall Average Vehicle Seat Belt Compliance Rates by Occupant Type
0 20 40 60 80 100 Rural Urban Driver OB Passenger
Percent Seat Belt Use
Older Child Younger Child 65 59 63 53 59 82 92 57
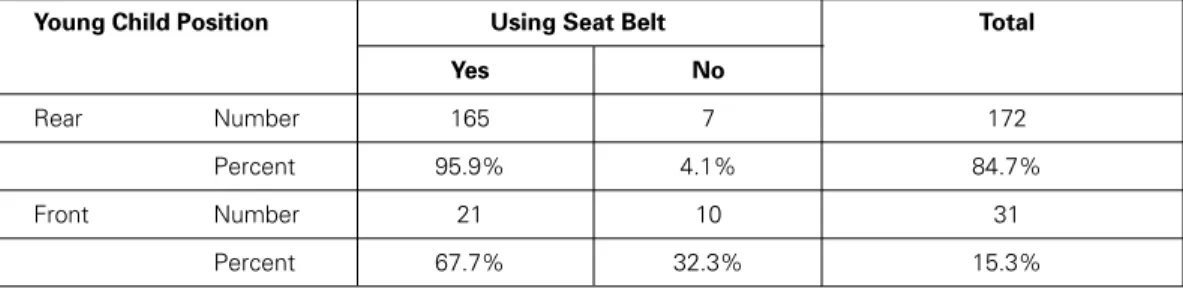
The trend for younger children seat belt compliance has been quite different from those of older ones, according to the trend that has been depicted in previous graphs. Table 2 gives more insight to younger chil-dren’s seat belt compliance (data analyzed for primary younger children only). Many more younger children were observed in the rear position (84.7%) and most of them either wear seat belts or use children’s seat restraints (95.9%). Also, it is easy to notice that the younger children are the least observed group, with only 203 vehicles
car-rying younger children as opposed to more than 16,300 vehicles analyzed in this paper.
Table 3 shows that whenever a driver uses a seat belt there is a higher chance that an outboard adult passenger will also use a seat belt. Data show that when a driver used a seat belt, 86% of the outboard adult pas-sengers also used seat belts. When a driver did not use a seat belt only 15.2% of the outboard adult passengers used the seat belt. In other words, if a driver does not use a seat belt, there is a greater chance that the out-board adult passenger will not use it. In
gen-Table 1: Comparison of Older Children’s Position and Seat Belt Compliance Rates Older Child Position Using Seat Belt Total
Yes No
Rear Number 312 222 543
Percent 57.5% 42.5% 51.6%
Front Number 294 216 510
Percent 57.6% 42.3% 48.5%
Figure 4: Comparison of Seat Belt Compliance Rates by Vehicle Type and Occupant Type
Autos Pickups SUVs Vans
0 20 40 60 80 100
Driver OB Passenger Older Child Younger Child 55 38 65 63 63 85 93 88 66 64 67 44 44 64 69 64
eral, the driver’s behavior will most likely influence all other vehicle occupants’ seat belt use.
Discussion of Results and Conclusions
According to the Kansas Department of Transportation (1998), in 1998 child safety seat usage rates were at 80%, up from just 68% in 1996. For children ages 4-13 they buckled up 58% of the time in 1998 as com-pared to 50% in 1996. Older passengers (age 14 and above) buckled up 58% of the time in 1998 as compared to 54% in 1996. A study conducted in 1999 (Bartel and Poresky 2000b), found that driver, outboard adult passenger, older child, and younger child seat belt compliance rates were 60, 59, 52, and 83%, respectively. The same trend has been shown in this study for 2000 although there is an increase in seat belt and child safety seat usage. Child safety seat usage has increased from 80% in 1998 to 86%. The older child’s seat belt usage has dropped from 58% to 55% and adult’s usage has increased slightly from 58% to 60%. However, the increase inseat belt usage in Kansas has not been large enough to reach acceptable levels. The authors could not determine whether the small changes in the older child and adult compliance rates are statistically significant due to the inability to obtain the 1996 data. There is a higher chance that if the driver uses a seat belt, an adult outboard passen-ger will also buckle up. There is no difference in seat belt compliance rates between the driver and the outboard adult passenger. Pick-up trucks’ occupants have the highest chance of not using seat belts. Younger chil-dren’s seat belt compliance is significantly and consistently higher than all other vehi-cle occupant types. Most of the younger chil-dren sit in the rear seat position.
The older children have the highest chance of traveling without wearing seat belts. For older children, the number of those who sit in the rear position is slightly higher than those who sit in the front position. This is dangerous for children traveling in vehicles with air bags installed, as they can be fatal equipment to children aged 12 and under, once released (Kansas Safety Belt Education
Table 2: Comparison of Younger Children’s Position and Seat Belt Compliance Rates Young Child Position Using Seat Belt Total
Yes No
Rear Number 165 7 172
Percent 95.9% 4.1% 84.7%
Front Number 21 10 31
Percent 67.7% 32.3% 15.3%
Table 3: The Relationship of Driver’s Seat Belt Compliance and Outboard Adult Passenger’s Seat Belt Compliance Rates
Driver Use Seat Belt OB Passenger Use Seat Belt Total Percent (%)
Yes Yes 6209 87.6
Yes No 876 12.4
No Yes 531 13.0
Office 1997). However, there is no significant difference in seat belt use compliance rates between older children who sit in the front or rear position.
The seat belt usage rate in Kansas is still low and in fact is lower than the national average rate of 71%. In comparison with other states, Kansas is among the states with the lowest seat belt usage (NHTSA 1997a). This can be mainly attributed to secondary enforcement laws. For some years now, the Kansas Department of Transportation has been sponsoring an education campaign through the media popularly known as the “Kansas Click” campaign. As other earlier studies have noted, a primary enforcement law in conjunction with an educational cam-paign is required for high seat belt usage. Tough fines for offending motorists are also effective. The Kansas law allows a $10 fine to be issued to offending motorists for not using seat belts (NHTSA 2001); this fine is one of the lowest among the states and it is not effective (NHTSA 2000; NHTSA 2001). Driver seat belt compliance has been higher in urban areas than rural areas. Most of the trends shown by the results of this study agree with the trends shown by similar stud-ies conducted by NHTSA.
It can be concluded that the lack of an effective primary seat belt enforcement law, coupled with a low seat belt fine, are the major reasons that seat belt use compliance in Kansas has remained relatively low.
Recommendations
It is now time for Kansas and all other states to adopt primary seat belt enforcement laws. As the literature shows and the results of this study confirm, tough seat belt laws should be the starting point for increasing seat belt use compliance. The survey results from this study have shown that the seat belt use rate has not increased substantially in recent years, which requires a need for a tougher enforcement policy to increase compliance.
Since the amount of the fine affects the rate of seat belt usage, it is suggested that the $10 currently charged in Kansas is far too low. Fines in the United States currently range from $5 in Idaho to $75 in Oregon. The most common fine charged in 27 States is $20 or $25 (NHTSA 2000). The fine charged by the state of Kansas for not using a seat belt is on the lower end of the fine spectrum and is below the average fine charged by most states. The major target group for higher fines should be older children (ages 4-14) who have the lowest seat belt compliance, which is also confirmed by other research efforts (NHTSA 1999). For example, a higher fine can be charged if a motorist is traveling with an unbuckled child in the car.
Publicity, tough enforcement, and fines should go hand-in-hand, i.e., they should complement each other. Revenue from seat belt law fines can be used to help support publicity and other promotional and incen-tive efforts.
References
Bartel, T.M.C. and R.H. Poresky. “Factors Associated with Adult, Child, and Infant Safety Belt Com-pliance.” Proceedings of the Conference of the National Association for the Education of Young Chil-dren. Atlanta, Georgia, November 8-11, 2000 a.
Bartel, T.M.C. and R.H. Poresky. “Factors Associated with Adult, Child, and Infant Safety Belt Com-pliance.” Proceedings of the Conference of the Southwestern Society for Research in Human Devel-opment. Eureka Springs, Arkansas, April 13-15, 2000 b.
Broughton, J. “Restraint Use by Car Occupants, Great Britain, 1982-1991.” Proceedings of the Con-ference Strategic Highway Research Program and Traffic Safety on Two Continents,VTI Raport 372 A, Part 4. Gothenburg, Sweden, September 18-20 (1991): 122-129.
Bureau of Transportation Statistics (BTS). Transportation Statistics Annual Report1999. The Bureau of Transportation Statistics, US Department of Transportation, Washington, DC, 1999.
Dee, T.S. “Reconsidering the Effects of Safety Seat Belt Laws and Their Enforcement Status.” Accident Analysis and Prevention30(1), (1998): 1-10.
Fhaner, G. and M. Hane. “Seat Belts: Factors Influencing Their Use—A Literature Survey.” Accident Analysis and Prevention5(1), (1973): 27-43.
Grant, B.A. “Canadian Safety Seat Belt Wearing Rates, Promotion Programs, and Future Direction.”
Proceedings of the Conference Strategic Highway Research Program and Traffic Safety on Two Continents, VTI Raport 372 A, Part 4. Gothenburg, Sweden, September 18-20 (1991): 70-87. Grant, B. A., J.B. Pedder, and N. Schewchenko. “Development of a Methodology for Measuring
Im-proper Safety Seat Belt Use.” Proceedings of the Conference Strategic Highway Research Program and Traffic Safety on Two Continents,VTI Raport 372 A, Part 4. Gothenburg, Sweden, September 18-20 (1991): 122-137.
Heinrich, H.C. “Strategies to Increase the Use of Restraint System.” Proceedings of the Conference Strategic Highway Research Program and Traffic Safety on Two Continents,VTI Raport 372 A, Part 4. Gothenburg, Sweden, September 18-20 (1991): 114-119.
Kansas Department of Transportation (KDOT). Safety Belts: What is Holding You Back?Kansas Department of Transportation IV(1), Winter 1998.
Kansas Safety Belt Education Office. Kids and Air Bags Don’t Mix. Kansas Department of Transporta-tion, December 1997.
Lassare, S. and Y. Page. “French Experience in Safety Seat Belt Use.” Proceedings of the Conference Strategic Highway Research Program and Traffic Safety on Two Continents,VTI Raport 372 A, Part 4. Gothenburg, Sweden, September 18-20 (1991): 97-112.
Makinen, T. and M. Hagenzieker. “Strategies to Increase the Use of Restraint System.” Proceedings of the Conference Strategic Highway Research Program and Traffic Safety on Two Continents, VTI Raport 372 A, Part 4. Gothenburg, Sweden, September 18-20 (1991): 62-67.
National Highway Traffic Safety Administration (NHTSA). Presidential Initiative for Increasing Seat Belt Use Nationwide. US Department of Transportation, April 1997a.
National Highway Traffic Safety Administration (NHTSA). National Occupant Protection Use Survey— 1996 Controlled Intersection Survey. Research Note, US Department of Transportation, August 1997b.
National Highway Traffic Safety Administration (NHTSA). Standard Enforcement Saves Lives: The Case for Strong Seat Belt Laws.US Department of Transportation, January 1999.
National Highway Traffic Safety Administration (NHTSA). State Legislative Fact Sheet. National Highway Traffic Safety,US Department of Transportation, January 2000.
National Highway Traffic Safety Administration (NHTSA). State Highway Safety Laws: Key Provision of Safety Belt Use.National Highway Traffic Safety Administration. Document downloaded from the website with the URL: http://www.nhtsa.dot.govon February 25, 2001.
Rivara, F.P., D.C. Thompson, and P. Cummings. “Effectiveness of Primary and Secondary Enforced Safety Seat Belt Laws.” American Journal of Preventive Medicine. January (1999): 30-39.
Stoke, C.B. “Safety Restraint Use in Virginia: Use Rate Trends from 1983 Through 1995.” Virginia Trans-portation Research Council. Report No. VTRC 96-R21, February 1996.
Tipton, R. M., C.C. Camp, and K. Hsu. “The Effects of Mandatory Safety Seat Belt Legislation on Self-report-ed Safety Seat Belt Use Among Male and Female College Students.” Accident Analysis and Prevention
22(6), (1990): 543-548.
Valtonen, J. and Liikenneturva. “Safety Belt Usage in Finland and in Other Nordic Countries.” Proceedings of the Conference Strategic Highway Research Program and Traffic Safety on Two Continents, VTI Raport 372 A, Part 4. Gothenburg, Sweden, September 18-20 (1991): 89-96.
Acknowledgment
We would like to express our sincere appreciation to Dr. Robert H. Poresky for his contribu-tion and support towards this manuscript. This article would not have been possible without the grant that Dr. Poresky was awarded by the Kansas Department of Transportation, Bureau of Traffic Safety. Not only did he acquire the grant, but he also created the measurement that was used and guided the analyses for the final report made to the state and federal government. It is with great sadness that Dr. Poresky did not live to see the completion of this manuscript.
Deogratias Eustaceis a transportation engineer with URS Corporation, Tallahassee, FL office. He holds a Ph.D. in Transportation Engineering from Kansas State University, a BSc (Eng.) honors degree and a MSc (Eng.) degree from the University of Dar-Es-Salaam, Tanzania. His professional interests are urban transportation planning, travel demand modeling, trans-portation safety, and sustainable transtrans-portation.
Teresa M.C. Bartel is a doctoral candidate in the School of Family Studies and Human Services at Kansas State University. She has earned BSc. degrees in Family Child Development and Psy-chology from Virginia Tech and a MSc. in Early Childhood Education from Kansas State University. Her professional interests lie in attachment with respect to international adop-tion.