KEYWORDS: Coffee, extraction, antioxidant, polyphenol.
Abstract
Eight kinds of Arabica coffee beans were extracted using solid-liquid (SLE), espresso (ESE), and coffee maker (CME) extractions. The antioxidant activity by DPPH assay and total polyphenol content (TPC) were significantly lower in ESE compared to the other two extracts (p < 0.05). In FRAP assay, CME was significantly higher in the antioxidant activity then those of SLE and ESE (p < 0.05). The antioxidant activity TPC of CME was significantly higher than those of SLE and ESE (p < 0.05). Of the eight kinds of coffee beans, there was no distinctive trend in the highest and the lowest amounts of antioxidant activity and TPC within each extraction method. CME was the most efficient method in extracting functional materials in coffee which might be due to the higher amount of water used for extraction.Antioxidant activity
and total polyphenol content of coffee extracted
by three extraction methods
INTRODUCTION
Coffee, one of the major commodities being traded all over the world (1), is considered as a hedonic food. Consumers tended to focus on the favors of coffee rather than their functionality. However, coffee contains signifi cant amounts of functional compounds such as caffeic, chlorogenic, hydroxycinnamic, ferulic, sinapic acids (2-5), and melanoidins (6, 7) that have strong antioxidant activity. Coffee is known as a major source of chlorogenic acids for human diet (8, 9). Coffee is also known as a major source of antioxidants in European countries (10, 11). Many studies reported the functionality of coffee is infl uenced by the degree of roasting (12), varieties (13), or roasting methods (14). Although solid-liquid extraction (SLE) had been used in many scientifi c studies (13-15), espresso extraction (ESE) and coffee maker extraction (CME) are the most common methods for extracting coffee. It was unknown whether the antioxidant activity and total polyphenol content (TPC) of coffee extracted by the SLE showed similar to the common extraction methods in our real life to authors’ knowledge. Therefore, the objective of this study was to compare the antioxidant activity by two frequently used in vitro assays (DPPH and FRAP) and TPC of eight different kinds of coffee beans (Coffea Arabica L.) extracted by SLE, ESE and CME.
MATERIALS AND METHODS Chemicals
Folin-ciocalteu reagent, gallic acid, 1,1-diphenyl-2-picrylhydrazyl (DPPH), ascorbic acid, FeCl3·6 H2O and
FeSO4·7H2O (Iron(II) sulfate heptahydrate), were purchased from Sigma Aldrich -LLC. (St. Louis, MO, USA). 2, 4, 6-Tri (2-Pyridyl)-1, 3, 5-triazine (TPTZ) was purchased from Tokyo Chemical Industry Co. (Tokyo, Japan). Hydrogen chloride, acetic acid and sodium acetate were purchased from Samchun Chemical Co. (Seoul, Korea). Ethanol and methanol were purchased from Junsei Chemical Co. (Tokyo, Japan). Sodium carbonate was purchased from Showa Chemical Industry Co. (Tokyo, Japan).
Roasted coffee bean preparation
Eight coffee beans (Mexico Yajalon: MY, Mexico
Maragogype: MM, Guatemala Antigua: GA, Ethiopia Michile: EM, Kenya AA: KA, Brazil Cerrado: BC, Colombia Supremo: CS, Peru Chanchamayo: PC) harvested in 2013 were purchased from local coffee bean traders (Moi, Yongin-si, Korea; Beansguru Co., LTD., Seoul, Korea). Green coffee beans (2000.0 g) were roasted using a commercial coffee roasting machine (R-105, Fuji Royal Co., Ltd., Osaka, Japan) by a coffee roasting specialist. Since the same roasting condition was not necessary to produce consistent roasting quality (13), different roasting conditions were applied based on the condition of each coffee bean by the specialist to maximize the quality of roasted coffee beans. The degree of roasting was controlled by Agtron number (58 ± 2) to meet the light-medium roast of coffee (16). Roasted coffee beans were kept at the room temperature for 72 hours for degassing.
Preparation of coffee extracts
The SLE was applied for extraction using slight modifi cation of Nebesny and Budryn’s method (14). The ratio between
ANTIOXIDANTS
HAN SUB KWAK1,2, SEOKGEUN JI1, MISOOK KIM1,2, YOUNGSEUNG LEE1,2, YOONHWA JEONG1,2*
*Corresponding author
1. Department of Food Science and Nutrition, Dankook University, Yongin-si, 448-701, Korea 2. Institute of Global Food Industry, Dankook University, Yongin-si, 448-701, Korea
16
Agro FOOD Industry Hi Tech - vol. 27(1) - January/February 2016Statistical analyses
One-way analysis of variance (ANOVA) was conducted among the eight coffee samples and three extraction methods. Fisher’s least significant difference (LSD) test was conducted in order to find out the differences for independent variables (samples or extraction methods). Statistical significance was considered when p-value was less than 0.05.
RESULTS AND DISCUSSION
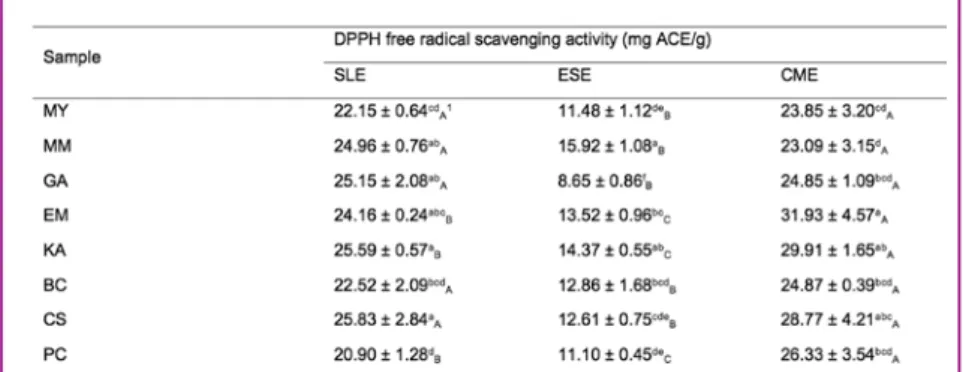
The antioxidant activities of different coffee extracts determined by DPPH assay are listed in Table 1. There were significant differences (F2,71 = 68.20, p < 0.001) among the three extraction methods. CME showed the highest antioxidant activity (average of 26.70 ACE/g), followed by SLE (average of 23.91 ACE/g) and ESE (average of 12.56 ACE/g). ESE contained approximately half of the antioxidant activity compared to CME or SLE. For different kinds of coffee beans, MY, MM, GA, BC, and CS were not significantly different (p > 0.05) between CME and SLE. For ESE extracts, each coffee variety had significantly lower (p < 0.05) antioxidant activity compared to those of SLE or CME.
There were significant differences (p < 0.05) among samples within each extraction method. The highest and lowest coffee varieties for each extraction method were different. The highest DPPH antioxidant activity of SLE, ESE, and CME were CS (25.83 mg ACE/g), MM (15.92 mg ACE/g), and EM (31.93 mg ACE/g), respectively. The lowest DPPH antioxidant activity for SLE, ESE, and CME were PC (20.90 mg ACE/g), GA (8.65 mg ACE/g), and MM (23.09 mg ACE/g), respectively. The orders of antioxidant activities within each extraction method were inconsistent.
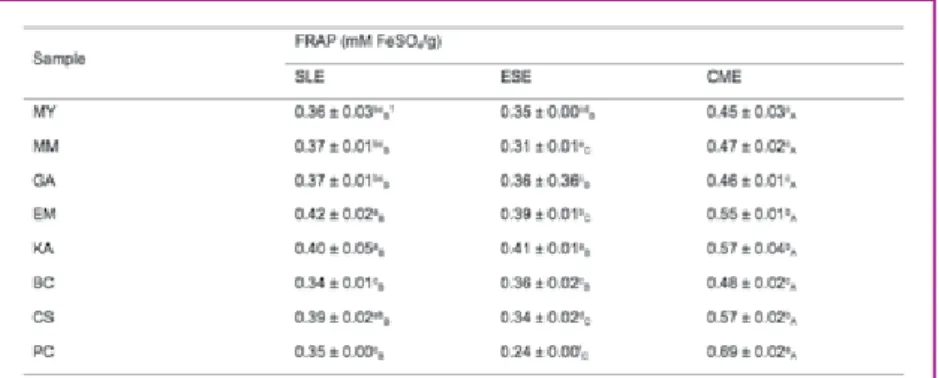
The results of FRAP assay are shown in Table 2. FRAP assay results showed different antioxidant activity pattern compared to DPPH assay (Table 1). CME (average of 0.529 mM FeSO4/g) showed the highest antioxidant activity, whereas SLE and ESE (average of 0.376 and 0.346 mM
FeSO4 / g, respectively) were not significantly different (F2,71 = 68.20, p > 0.05) each other. Inconsistent pattern of antioxidant activity between FRAP and DPPH assays were also found in Vignoli’s study (7). Therefore, different antioxidant activity patterns from the three extraction methods could be due to the different mechanism of antioxidant assays (19). The antioxidant activity of coffee by FRAP assay was similar to black and Oolong teas (20).
the ground coffee and distilled water (98°C) was 1:10 (w/v). Extraction was carried out in a water bath at 98°C for 10 min with 100 rpm in triplicates. Extracts were cooled with tap water to 20°C and centrifuged at 6,485 x g force for 15 min. The supernatant was used for vacuum filtration. The ESE was carried out using a commercial espresso machine (Faema E98, Faema, Milan, Italy). Ground coffee beans (14.5 g) were transferred to a porter filter and tampered. Approximately 60 mL of coffee was extracted. The CME was performed using a home coffee maker (HD7564, Philips, Amsterdam, Netherland). Coffee (10.0 g) was put into No. 2 coffee filters (Melita USA Inc., Clearwater, FL, USA). Filtered water (200 mL) was used for extraction. The extraction was continued for 4 min. All coffee extracts were vacuum-filtered through Advantec No. 2 filter paper (pore size: 6 μm, Advantec MFS, Inc., Dublin, CA, USA). The extracts were frozen and stored in a freezer (-30°C) for analyses.
DPPH free radical scavenging activity
DPPH free radical scavenging activity was conducted using modified Nebesny and Budryn’s method (14). Briefly, 160 μL DPPH solution (1.4 x 10⁻⁴ M) and diluted coffee extract
(coffee extract: distilled water = 1: 100, v/v) were mixed and kept at the room temperature for 30 min. The mixture was added into a 96-well microplate and the absorbance was measured using a microplate reader (Spectra max M2, Molecular Devices, LLC. Sunnyvale, CA, USA) at 517 nm. A blank was prepared by substituting the DPPH solution with methanol. The difference in absorbance (Abssample – Absblank) was compared to the standard curve (R2 = 0.992) of the
absorbance of L-ascorbic acid solutions (0 – 56.25 μg/mL). DPPH free radical scavenging activity was expressed as mg ascorbic acid equivalent/ g of ground coffee (mg ACE/g).
Ferric reducing antioxidant power (FRAP) assay
FRAP assay was conducted using modified Benzie and Strain’s method (17). Briefly, FRAP reagent was made by mixing 300 mM sodium acetate buffer (pH 3.6), 10mM TPTZ/40 mM HCl, and 20 mM FeCl3 solution at ratio of 10: 1: 1 (v/v/v) and incubated at 37℃. The coffee extract (10 μL) and FRAP reagent (290 μL) were mixed and kept at 37℃ for 15 min. Their absorbance was measured at 593 nm using a microplate reader (Spectra max M2, Molecular Devices, LLC). Standard curve (R2 = 0.997) by a
positive control (FeSO4·7H2O) was used to calculate the FRAP value. Results were presented as mM
FeSO4/g of ground coffee.
Total polyphenol content
TPC were determined using Singleton’s method (18). A 20 μL of the extract was mixed with distilled water (1,580 μL). The mixture (160 μL) and 2-N Folin-Ciacalteu’s phenol reagent (10 μL) were mixed and kept for 8 min. After that, 30 μL of Na2CO3 was added. The mixture was kept at room temperature for two hours. A blank sample was prepared by substituting the reagent with distilled water. After incubation, the absorbance values of samples were measured with a microplate reader (Spectra max M2, Molecular Devices, LLC) at 765 nm against the blank sample. The TPC was presented as mg gallic acid equivalent/ g of coffee (mg GAE/g).
Table 1. DPPH free radical scavenging activity of eight roasted coffee bean extracted by solid-liquid, espresso and coffee maker extractions.
1 Different superscripts within a column meant significant difference at p < 0.05 by Fisher’s
least significant difference (LSD) test. Different subscripts within a row meant significant difference at p < 0.05 by Fisher’s LSD test.
When the antioxidant activity of different coffee extracted with a certain extraction method was compared, different orders in antioxidant activity of coffee varieties were found. The highest antioxidant groups for each extraction method by Fisher’s LSD test were EM (0.42 mM FeSO4/g) and KA (0.40 mM FeSO4/g) for SLE, KA (0.41 mM FeSO4/g) for ESE, and PC (0.69 mM FeSO4/g) for CME. The lowest antioxidant groups for each extraction method were inconsistent. Interestingly, PC had the lowest antioxidant activities by SLE and ESE, but PC had the highest antioxidant activity by CME. TPC of coffee extracts using the three extraction methods are listed in Table 3. The average amounts of TPC by SLE, ESE and CME were 26.11, 20.23, and 35.48 mg GAE/g, respectively. There were signifi cant differences (F2,71 = 71.60, p < 0.001) among the three extraction methods. CME showed the highest amount of TPC in general. Only EM showed the highest amount of TPC by SLE. The amounts of TPC for each sample were signifi cantly different. However, TPC among samples in each extraction method did not show any pattern in amount. The highest TPC were EM for SLE (34.23 mg GAE/g) and ESE (21.99 mg GAE/g), and CS (47.29 mg GAE/g) for CME. PC was in the lowest amount of TPC group for SLE and in the second lowest TPC group for ESE. However, PC was in the second highest TPC group in CME based on Fisher’s LSD test. PC showed lower antioxidant activity and TPC in SLE and ESE, where as it belonged to the higher antioxidant and TPC groups for CME. The TPC of coffee extracted by SLE and ESE was lower than that from the black tea (30.5 mg GAE/g) (21); however, CME showed higher TPC in 5 out of 8 coffee beans. TPC was not strongly correlated with DPPH and FRAP assays (r = 0.009 – 0.684) other than the correlation between TPC and FRAP (r = 0.837) in ESE. Different origin of coffee beans would infl uence the low correlation. The low correlation coeffi cients between antioxidant activity and TPC were found in the previous coffee study (13). Throughout the antioxidant activity and TPC, ESE showed the lowest functionality. This trend was similar to a previous report in which CME was signifi cantly higher in deoxyribose damage than ESE (22). Since ESE was extracted with lower amount of water, the functional materials in coffee might have been insuffi ciently extracted. In addition, ESE was carried out in a shorter time (30 sec) compared to SLE (10 min) or CME (4 min). Therefore, ESE would not functional materials from the ground coffee due to the much shorter time for extraction. On the other hand, CME showed dominant functionality in antioxidant activity and TPC. CME extraction was conducted with 1:20 (coffee: water, w/v) ratio, while SLE and ESE were conducted with 1:10 and 1:4.14 ratios, respectively. The amount of water for each gram of coffee might have signifi cantly infl uenced the extraction of functional materials.
CONCLUSIONS
Antioxidant activities and TPC of SLE were different from the two regular coffee extraction methods, CME and ESE. In addition, the orders of antioxidant activity and TPC of eight coffee varieties using three extraction methods were different. Therefore, the antioxidant activity and TPC by SLE from many previous studies might not refl ect the antioxidant activity and TPC of coffee extracts that consumers have drunk from CME and ESE. Consumers consumed more functional materials by CME but less functional materials by ESE in comparison with SLE based on ‘g of coffee’. There was no obvious trend in antioxidant activities and TPC among the eight coffee varieties within each extraction method. This might be due to the different inner structure and composition for each variety. Based on the results of this study, CME appeared to extract more functional materials from coffee beans.
18
Agro FOOD Industry Hi Tech - vol. 27(1) - January/February 20167. Vignoli, J. A., Bassoli, D. G., Benassi, M. T. “Antioxidant activity, polyphenols, caffeine and melanoidins in soluble coffee: The influence of processing conditions and raw material”, Food
Chemistry, 124 (3), 863-868 (2011).
8. Clifford, M. N. “Chlorogenic acids and other cinnamates–nature, occurrence, dietary burden, absorption and metabolism”, Journal of
Agricultural and Food Chemistry, 80 (7),
1033-1043 (2000).
9. Daglia, M., Papetti, A., Gregotti, C., et al. “In vitro antioxidant and ex vivo protective activities of green and roasted coffee” Journal of Agricultural
and Food Chemistry, 48 (5), 1449-1454. (2000).
10. Qureshi, S. A., Lund, A. C., Veierød, M. B., et al. “Food items contributing most to variation in antioxidant intake; a cross-sectional study among Norwegian women”, BMC Public Health, 14 (1), 45 (2014).
11. Pulido, R., Hernandez-Garcia, M., Saura-Calixto, F. “Contribution of beverages to the intake of lipophilic and hydrophilic antioxidants in the Spanish diet”, European Journal of Clinical
Nutrition, 57 (10), 1275-1282 (2003).
12. Somporn, C., Kamtuo, A., Theerakulpisut, P., et al. “Effects of roasting degree on radical
scavenging activity, phenolics and volatile compounds of Arabica coffee beans (Coffea
arabica L. cv. Catimor)”, International Journal of Food Science and Technology, 46 (11),
2287-2296. (2011).
13. Hečimović, I., Belščak-Cvitanović, A., Horžić, D., et al. “Comparative study of polyphenols and caffeine in different coffee varieties affected by the degree of roasting”, Food Chemistry, 129 (3), 991-1000 (2011).
14. Nebesny, E., Budryn, G. “Antioxidative activity of green and roasted coffee beans as influenced by convection and microwave roasting methods and content of certain compounds”, European Food
Research and Technology, 217 (2), 157-163 (2003). ACKNOWLEDGEMENT
The authors thank to Jae Wook Do, owner of café MOI, for coffee roasting and espresso extraction.
REFERENCES
1. International Coffee Organization. Available: http://www.ico.org. (last checked on Nov. 21th 2014)
2. Manach, C., Scalbert, A., Morand, C., et al. “Polyphenols: food sources and bioavailability”, The American Journal of Clinical
Nutrition, 79 (5), 727-747 (2004).
3. Shi, X., Dalal, N. S., Jain, A. C. “Antioxidant behaviour of caffeine: efficient scavenging of hydroxyl radicals”, Food Chemistry and
Toxicology, 29 (1), 1-6 (1991).
4. Moreira, D. P., Monteiro, M. C., Ribeiro-Alves, et al. “Contribution of chlorogenic acids to the iron-reducing activity of coffee beverages”, Journal of Agricultural and Food Chemistry, 53 (5), 1399-1402 (2005).
5. Gallardo, C., Jimenez, L., Garcia-Conesa, M. T. “Hydroxycinnamic acid composition and in vitro antioxidant activity of selected grain fractions”, Food Chemistry, 99(3), 455-463 (2006). 6. Parliment, T.H: An overview of coffee roasting, in Caffeinated
Beverages, in Health Benefits, Physiological Effects and Chemistry, ACS Symposium Series 75,. Edited by Parliament T.H., Ho C.T.,
Schieberle P., Eds. American Chemical Society, Washington, DC, USA. (2000).
Table 2. Ferric reducing anxioxidant power (FRAP) of eight roasted coffee bean extracted by solid-liquid, espresso and coffee maker extractions.
1 Different superscripts within a column meant signifi cant difference at p < 0.05 by Fisher’s
least signifi cant difference (LSD) test. Different subscripts within a row meant signifi cant difference at p < 0.05 by Fisher’s LSD test.
Table 3. Total polyphenol content of eight roasted coffee bean extracted by solid-liquid, espresso and coffee maker extractions
1 Different superscripts within a column meant signifi cant difference at p < 0.05 by Fisher’s
least signifi cant difference (LSD) test. Different subscripts within a row meant signifi cant difference at p < 0.05 by Fisher’s LSD test.
15. Del Castillo, M. D., Ames, J. M., Gordon, M. H. “Effect of roasting on the antioxidant activity of coffee brews”, Journal of
Agricultural and Food Chemistry, 50 (13), 3698-3703 (2002).
16. Cupping specialty coffee, in SCAA protocols. Specialty Coffee Association of America, Long Beach, CA, USA (2009).
17. Benzie IF, Strain JJ. “[2] Ferric reducing/antioxidant power assay: Direct measure of total antioxidant activity of biological fl uids and modifi ed version for simultaneous measurement of total antioxidant power and ascorbic acid concentration”, Methods in
Enzymology, 299, 15-27 (1999).
18. Singleton, V. L., Orthofer, R., Lamuela-Raventos, R. M. “[14] Analysis of total phenols and other oxidation substrates and antioxidants by means of folin-ciocalteu reagent”, Methods in Enzymology, 299, 152-178 (1999).
19. Thaipong, K., Boonprakob, U., Crosby, et al. “Comparison of ABTS, DPPH, FRAP, and ORAC assays for estimating antioxidant activity from guava fruit extracts”, Journal of Food Composition and
Analysis, 19 (6), 669-675 (2006).
20. Benzie, I. F., Szeto, Y. T. “Total antioxidant capacity of teas by the ferric reducing/antioxidant power assay”, Journal of Agricultural
and Food Chemistry, 47 (2), 633-636 (1999).
21. Turkmen, N., Sari, F., Velioglu, Y. S. “Effects of extraction solvents on concentration and antioxidant activity of black and black mate tea polyphenols determined by ferrous tartrate and Folin– Ciocalteu methods”, Food Chemistry, 99 (4), 835-841 (2006 22. Parras, P., Martínez-Tomé, M., Jiménez, A. M., et al.
“Antioxidant capacity of coffees of several origins brewed following three different procedures”, Food Chemistry, 102 (3), 582-592 (2007).
Join Europe’s leading health trade show for the
free from, functional and vital food industries
The place to be when Food Retail, Food Service and all other
Health Food Buyers meet their International Suppliers
I N V I T A T I O N
BOOK
YOUR STAND NOW!
WWW.FREEFROMFOODEXPO.COM
√ Gluten Free
√ Lactose Free
√ Dairy Free
√ Yeast Free
√ Wheat Free
√ Vegan
√ Fat Free
√ Nut Free
√ Soy Free
√ Salt Free
√ GM Free
√ Egg Free
√ No sugar
√ No additives
√ No preservatives
√ ...and many more
N
√ Vitamins √ Food Supplements √ Nutritional Supplements √ Protein Supplements √ Protein Snacks √ Carbohydrate Shakes √ Nutritions√ Sports Nutrition, Gels & Powder √ Isotonic Instant Beverages √ De-hydration Beverages √ Medical Food
√ Diet Food Solutions √ Dietary Beverages √ Amino Acids √ Omega 3 √ Probiotics √ ... and many more