Reducing
transonic
wind
tunnel
sting
interference
effects for concealed
store
release
testing
Graham
Doig
1,2,
Goran
Bogdan
2,
Kaveh
R
Kabir
3and
Murray
R
Snyder
4,5Abstract
Internal weaponsbaysarebecomingincreasinglycommononaircraftforreasonsofstealthandaerodynamicperform ance,andwillbeevenmoreprevalentoncominggenerationsofunmannedcombataerialvehicles(UCAVs).Windtunnel testingofstorereleasestoassessforcesandmomentsforsafetyandclearancemustbeconductedwithastoremounted toanangledstrutratherthanaconventionalrearsting,toallowthefullrangeofmotionasthestore‘‘drops’’frominside the aircraft. Interference from this strut can disrupt the flowfieldsand thusthe reliabilityof momentsobtained, and thereforeaninvestigationwasconductedtoquantifythepotentialextentofdiscrepancies;originalsmall-scaletransonic wind tunnel testing was undertakenin a limited programwhich wassupported byextensive numerical work. Itwas concluded that the precise geometry of the strut/store interface was of critical importance, with a typical design producing non-linear interference at highangles of attack.A simple improved design is proposed– making use of a blendedinterfaceanda moreappropriatesupercriticalaerofoilstrutcrosssection– yieldingmarkedimprovementsin force andmomentpredictions.
Keywords
Storerelease,CFD,wind tunnel,transonic,stinginterference
Introduction
In order to optimize both stealth capabilities and aerodynamic performance,itisincreasinglycommon for modern military fighter/bomber aircraftto carry storesinsideaninternalcavity,typicallyandhereafter referred to as the weapons bay. New-generation advanced unmanned combat aerial vehicles (UCAVs) will be configuredin this way as common practice.
Potentially complex behaviours of stores when released from aircraft must always be extensively tested to ensure no damage to the aircraft and no loss of expensive munitions; this has historically meant wind tunnel testing, which can be expensive (particularlyifusinga relativelylarge-scaletransonic facility). More expensive still is actual flight testing, whichisnaturallythemostrealisticflowfield,butpro hibitively costly and risky at thedesign phase. Data acquisition and repeatability are also issues in the latterinstance.Effectiveandreliablewindtunneltest ing is therefore essential prior to any flight testing, yet each new store design or modification must be individually flight tested, resulting in a large
predictions from the wind tunnel can minimize any danger anddown-time. Itis now relatively common for computational fluid dynamics (CFD) work, par ticularly using Reynolds-Averaged Navier–Stokes (RANS) modelling, to be involved in theprocess to both predict design problems in advance ofphysical testing and, increasingly, to plan and help interpret thetunnel data itself before scalingup to real-world Reynoldsnumberstoanticipatefurtherissues.1–5
Mounting an aircraft tunnel model to one sting, andthestorefromthereartoanother,isnot applic ableforweapons bayworkwherethestoreisorigin ally in the cavity when ejected, before crossing the highly turbulent shear layer and proceeding to clear
1
AerospaceEngineeringDepartment,CaliforniaPolytechnicState University,SanLuisObispo,USA
2
UNSWAustralia,Sydney,Australia
3
MacquarieUniversity,Sydney,Australia
4
GeorgeWashingtonUniversity,Washington,DC,USA
5
UnitedStatesNavalAcademy,Annapolis,USA
Correspondingauthor:
GrahamDoig,CaliforniaPolytechnicStateUniversity,SanLuisObispo,
CA93407,USA.
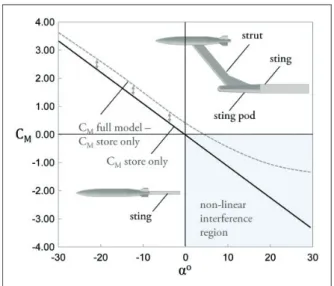
the vicinity of the aircraft. An additional strut arm connectingtothemiddle ofthestoreisonestandard design approach (a very short rear sting and strut could interfere much more with the cavity flow), whereby the sting itself can be far from the store, reducinginterference.However,thestruttendstobe simplistic and produces its own effect on the store pressuredistribution–thetypicalproceduretoevalu atethisinvolves afull sweepof anglesandpositions with a clean store, then a repeat with the strut arrangement; a form of superposition can then be undertakenin subtractingone result from theother, assuming that the difference between the two states should be relatively linear, predictable and consist ent.6 Unfortunately, this israrely the case, and par ticularlyathighanglesthereappearstobeincreasing divergenceinthetwobehavioursthatcanbeattribu ted to unwanted strut interference. A representative diagram of the pitching moment issue, with inset images of a typical store/strut arrangement, is shown in Figure 1, based on prior studies.6,7 The behaviour of the store by itself is the ideal result which cannot be reproduced when it must emerge from a cavity, and a predictable, systematic offset occurs when the store is mounted to the strut and pitchedatnegativeangles.Atpositiveangles,adiver genceinpredictedpitchingbehaviouroccurssuchthat thestorebyitselfwouldcontinuetoexperiencea lin earlyincreasingmoment.However,thestrutinterfer enceeffectinducesaless-predictabletrend.
Whileitmaybepossibletoevaluatethedifferences and compensate at all conditions, this would have to be repeated for every single spatial condition for every strut and store combination, decimating the proposed advantages of an efficient CFD/tunnel programaheadofreducedflighttestingforstorecer tification.1 It wouldbe markedly more preferable to beableto trustresultsobtainedwiththestrutknow ingthatbehaviour wouldnotchangenon-linearly or suddenly across the angle of attack, roll or yaw ranges.
ArecentstudybyFinneyandHallberg6compared computationalfluid dynamics simulations with wind tunneltestdatafromtheNavyInternalCarriageand Separation (NICS) cavity8,9 and provided a useful illustrationof thestrut interference problem. Forces were measured on a Mk-82 bomb model as it tra versedthelongitudinal axisofa cavityatseveraldif ferent bay depths, and a scenario similar to that shown in Figure 1 emerged. Unfortunately, no detailed description of the store support mechanism in the NICS test data was available, though a very simple strut was used with a long arm attached to the sting. Finney and Hallberg’s CFD simulations showedlittle differentiation between simulations run onacleanstore(withnoattachedstrut)andthebase line Mk-82 with strut. Based upon the disparity between wind tunnel and their CFD results, Finney andHallbergconcludedthattheirstrutwasprobably
Figure 1. Representativegraphofthepitchingmoment
interferenceissue.
not a representativemodel of thatusedin theNICS cavity, highlighting the need for CFD to properly reproduce the experiments in order to repeat the struteffects.
Although the comparisons at negative angle of attack were in good agreement with the test data, and matched wind tunnel data for an aft mounted stingforthisstore,therewassubstantialdisagreement at positive angles of attack. A follow-up numerical studywith amore representativestrutindicated that there was significant deviation between store/strut CFDand clean-storewind tunnelresults whenangle ofattackaexceededapproximately10o,7
andthedis crepancy was not significantly aided by greatly increasing the length of the strutarm in an attempt toreduceanypossibleinterferencefrom theconnect ingstingpodatthebottom.Thepodwasfoundtobe sufficiently faraway already,and ratherthejunction between strut and store was identified as being a majorsourceofflow disruption.10
Thepresentworkbuildsonthesepreviousinvesti gations which originally identified the interference issue6,7,11; the study focuses on the influence of the interface betweenthestrut andthe storeand isaug mented by original wind tunnel testing to allow a more comprehensive validation of the numerical method.
Stemming partly from a very limited wind tunnel testingperiod,ahighlysynergisticintegrationofCFD andexperimentswaspursuedfollowingthesuccessof previousinvestigationsusingtheUSNavalAcademy (USNA) small-scale Transonic Wind Tunnel and RANSmodelling.11–14SimplisticCFD(notdescribed here)wasoriginallyusedtoidentifytheflowfeatures likelytobeencountered,andthenthesamenumerical approach was used to help design the wind tunnel experiments(anticipatingblockageissues,walleffects, and the location of high gradients for pressure tap ping, etc.). Three-dimensional printing of tunnel
models allowed quick redesign and manufacture for increased strength and rigidity, and the experiments were performed specifically with CFD validation in mind;forthis reason,thefloorandceilingwerekept fullyclosed(atleastfortheresultsreportedhere)and everyconditionoftheexperimentwasnotedsuchthat CFD could be conducted with thorough testing of parameters. Multi-comprehensive assessment of numerical accuracy than,for instance, therefore, surface pressure measure-mentsweretakenaswellasforces,moments,and sur-As a result of the approach, the study aimswere to properly understandthenature of the store/strut interference issue, to propose a pathway foreffectivedesigntoavoidsuchissues,andto evalu-atetheusefulnessofashort-duration,tightly-coupled which neither dataset is necessarilycomplete in a traditionalsense. The following sectionsdetail the experimental meth-odology first,thenthenumerical approach including validationandverification,beforediscussingthe aero-dynamics in moredetail in orderto provide context for theproposed strutredesigns thatareexpected to
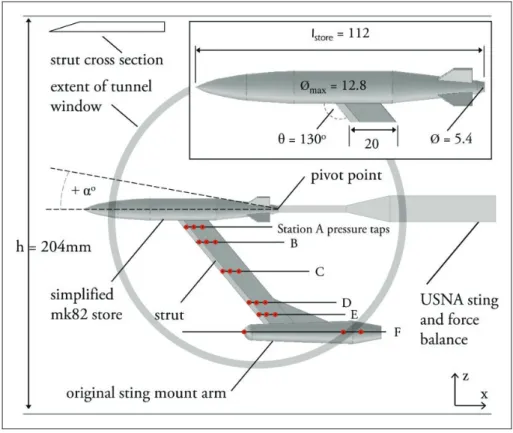
Testing in the US Naval Academy 8-inch by 8-inch transonicblowdowntunnelinvolvedallmodelsbeing mountedtotheforcebalancestingbytherearofthe store itself, as shown in Figure 2 (which also high-lights other features of the experimental design and the model size and placement in the tunnel). This mounting alloweda more directmeasurementof the influenceofthestrutarmandtheoriginalstingmount and more interference close to the roof of the tunnel. A Mk82 geometry was simplified toincludea morebasic boat-tail than an actual store, and by removing the nose pod and The strut thickness was 5.4mm compared to the store diameter of 12.8mmat itsmaximum, and fea-turedsharpjunctionstothestoreandthelowersting pod.Thestrutrearwasastraightforward perpendicu-larangletothefreestream-alignedside,suchthatflow wouldseparateentirelythere,and themainarmwas fromthe verticalto matchthe arrange-mentpreviouslytestedandreportedintheliterature.7 Thestrutleadingedgeexpansionanglewas30o.Both
an exagger-ation of themodelsin theliterature on whichit was to ensure sufficient strength in the Nylon to avoid breakage in the tunnel and to exaggerate the showed this choice to have little bearing on the trends obtained
TestswereconductedforCFDvalidationwiththe tunnel porous floor and ceiling fully closed (as the porous plate and plenumchamber wouldhave been effectively impossible to model properly), though a separate set of test data was conducted with the porous floor and ceiling open to alleviate any wall effects. Thesecond set ofdata is not describedhere. Therefore,whilewalleffectswerecertainlyinfluential, theywouldalsoexistinthenumericalmodel,ensuring aneffective matchof data sets anestimateof wall effectsisdescribedin Figure10.Adescriptionof the conditionstested,forboththestorebyitselfand the storeandstrut,isshowninTable1withasummaryof calculatederrors.
The small scale of the model dictated a limited number of pressure tappings, particularly on the thinstrut.Forthisreason,thethreemodelswere con-structed from laser-sintered Nylon12 (sanded and paintedto ensurea smooth finish,andmeasuredfor repeatability to within 0.1 mmof thestore diameter before and after), featuring different arrays of pres-sureports.WithrepeatabilityoftheMachnumberin thetunnel withina satisfactoryrange forthepresent purposes,thisallowedthecombinationofdatasetsto provide overall adequate spatial resolution from 18 tapsforCFDvalidation.
Allgeometriesweresizedtoavoidexcessive block-age rather than to achieve a specific Reynolds number; at zero angle of attack, the blockage of the store/strut/sting model (based on projected frontal area) was 1.4% or 2.3% if the portion of the rear force balance and sting support that sits in the rear of the test section is included. At 12o
this was increased to 2.2%, which is considerable at M1 ¼ 0.85 with closed walls, though blockage and wall effects were later quantified using CFD and found to be slight at all but thehighest angles. Thestore-only configurationhad amaximum block-age of 0.8% at 12o , and the discrepancies
between model types and their blockages at different angles provoked minor adjustments to the stagnation pressures required to ensure that the same freestream Mach number was attained for eachtest.
Boundary layer transition was triggered with a small roughness line 2mm from the leading edge of thestore, strutandsting pod,and theincoming tur-bulence intensity of the tunnel for the measurement periodwasdeterminedtobe0.12%throughextensive calibration testing. Deflection of the model either through forces acting on the model and sting, or mild bending of the Nylon models, was measured using stills extracted from videos taken during the wind-on startup phase values are reported in Table 1 (to the accuracy afforded by the resolution of the stills) and are higher at the highest angles tested: upto 0.25o above8o.WhileCFD could have
beenusefultoestimatethisinfluenceontheforcesand moments measured, thevaluesare presentedas-is in turbulence modeling and mesh
variable testing allows for a more
– forces alone –
facevisualisation. threefold –
CFD and experimental program in
greatlyimproveresults.
Experimental
method
compared to a clean store-only case, importantly left the store free of wall
othersmallgeometricfeatures.6
swept at 40o
this angle and the strut thickness were
– based,7
effects previously noted; later results compared topreviousresults.
Figure 2. RelevantparametersofwindtunnelsetupandsimplifiedMk.82storemodel.
Table 1. Tunnelparametersandmeasurederror.
Value Estimatedexp.error
Machnumber Angleofattack Turbulentintensity 0.85 -8o to12o (þ20forCFD) 0.12% ±0.01
0.05(at0o windoff),0.1(at0o windon)
to0.25(±8o windon)
±0.015
subsequentcharts without this effect included in the errorapproximations.
Due to the small-scale of the model preventing extensive quantitative pressure data (and limited time in the facility itself), multiple investigative techniques were employed to maximize available information about the flowfield and the store. Temperature-sensitive liquid crystal coating was appliedforsurfacevisualization,designedtofacilitate a pinpointing of separation/reattachment or shock locations on the strut. This visualization was time-dependent, as the model cooled during the operation of the tunnel, thus allowing only a short window in which to capture the thermochromic liquid crystal (TLC)colourplay.TheTLCcoatingswerelooselycali brated but quantitative data was not the aim in this instance.Astandardhalogenlightwasusedforillumin ation,andhigh-definitionvideowasobtainedat60fps– fromthis,stillswereextractedforcomparisontoCFD. A three-axis force balance was used to generate data for the forces and moments obtained during
multiple runs at Mach 0.85. Angles of attack from -6o to12o wereexaminedat2o intervals,withamin
imum oftwo runspermodel for eachof themodels (toaverageresults),givingatotalnumberinexcessof 130 tunnel runs. Data was acquired at 10Hz for approximately 10s of steady, established flow, and the values of all properties were averaged over the middle 5s of this time in post-processing. Mach number typically varied by approximately 0.01 during any given data-acquisition period. All error plotsinsubsequentgraphsarebasedoncombinations of standard deviations in force or velocity measure ments stemming from both repeatability tests and variations withineachactualrun.Itisacknowledged that the0.5mmdiameter of thepressuretaps at the surface islarge relative to the overall dimensions of the model. However, this could not be avoided to allowforpracticalmanufactureandinstrumentation; in critical areas, the pressure gradient is strong and thus a consideration of the average pressure in the tappingareasinthecomparisonCFDwasrequired.
ANSYSFluent14wasutilizedtogenerateallresults discussed here. The code was run in pressure-based coupledmodeon 64-bitmachines.Convergence, typ-iterations, was deemed to satisfy a minimum acceptable level when 0.1%)variationinaerodynamicforce extensive continued most cases con-vergedtoamuchlowerlevelthanthis,andat normal-or lower. Second-order assumed to provide ade-computationally efficient configured to evaluate Results obtained with the Fluent density-based solver werehighly compar-able, butwithrun timesof upto 150%compared to The model pivoted around the centre rearof the same as in the tunnel tests.Thetestsectionwas physicallyextended diffuser which exists in the real facility, to allow diffusion of flow as an aid to the solver. Original inlet and outlet distances were increasesto7.5Land 9L, and 10L and 12L wereexamined and it was found 0.3%) to the aerodynamic forces and moment between the latter 15% change between the former used for all wind tunnel simulations. Latercases featuring a full domainwithout tunnelwallshadboundariesas indi-measurements were not available,buttoavoid additionalmesh complex-ity and solvertime in eachCFD run, simulationsof theanticipatedtunnel boundarylayer thicknesswere used to deduct thatthickness from the domainsuch implemented. 0o showed
0.2%difference inforcesobtained,thusthesimpler methodwaschosenforallsubsequentcases.
Totestformeshconvergence,threecelldensitieswere generatedforthewind tunnelemulationmodels, fea-cellsintotal (store-only meshes had cell counts approximately 20% less). In order,thesemeshesfeatured120lengthwisenodeson the store and 20 nodes around the circumference at the widest point, then 180 and 30, and 360 and 60 respectively. Lift and drag forces for the store only assessed at zero plotted in
Figure 4. It is clear that while all meshes of the store only configuration featured very little error due to mesh resolution, the strut/sting model was more sensitive; if the 30.6 million cell mesh is con-sideredthemostaccurate,the5millioncellmesh fea-tured 5.1% error in lift and 1.8% error in drag. However, the additional computational expense of the larger mesh was not warranted for the lift number,asthestore-onlyforces(extractedseparately fromthestrut/podmodel)fromthefullmodelwerean order of magnitudelower and thereforein line with thetruecleanstorenumbers,indicatingthatthemain discrepanciesexistedonthestrutandstingpodrather thanthestoreof interest.Theerrorsofthe5million cellmeshwereplacedinthecontextofthoseachieved intheexperimentanddeemedtobeofanacceptable levelforrapidturnaroundofCFDcases;particularly since trends wereof moreimportance than absolute accuracyforthisparticularinvestigation.
Once converged solutions were obtained, limited local mesh refinement was undertaken to improve shock resolution, typically adding 0.2x 10⁶ cells to the mesh. Very mild unsteadiness in some solutions likely due to excessiveshock diffusion or displace-mentacrosscells–wasaddressedinthisway,though the effect on forces and moments was never signifi-cant. For later runs that were unconstrained by tunnelwalls,themeshcellcountswereapproximately 300,000 greater, but the mesh around the store was identical.
After arriving at the meshing strategy, the wind tunnelresults wereexaminedin conjunctionwith the numerical results, and are presented in this fashion
Figure 3. Exampleofbasicmeshlayout(top)anddomainsfor
windtunneland‘freeflight’runs.
Numerical
method
General
approach
ically obtained in less than 1000 nosignificant(<
coefficients was observed with iteration (>1000 additional steps); ized residual values of 10-5
upwind discretization was quate accuracy in a manner, and the solver was gradients at the cell centres.
thepressure-basedsolver.
store for different angles of attack, significantly downstream from the features prior to the outlet boundary 5L and6L respectively–
that there were negligible changes (< two cases (from �
two). Therefore, 7.5L and 9L were
catedinFigure3.
Tunnel wall boundary layer
that zero-shear walls could be Comparisons of both sets of results at <
Verification
and
validation
– turing2.7x106,5.0x106,and30.6x106
for the store/strut/sting arrangement
and store/strut/sting models were degrees a, the results of which are
here. The pressure distributions at the tapping sta-tions are presented in Figure 5 for the zero degrees The CFD prediction has been afforded an approximation(thickgrey band) oferrors, including distribution varies acrossthe0.5mm width ofthe pressuretapholes in The numerical results show good agreement with the measured data within the bounds of error and uncertainty, particularly with regards to the trends and well-defined points such as the stagnation loca-tionattheforemostpointofthelowerstingpod (sta-peak pressures. the wedge portion of thestrut,but inallcasesminordiscrepanciesemerge downstreamofthisregion.Astrong shockwaveand on the strut were flowfield exacer-bated by vortices forming at the junctions between the strut and the store, as well as the strut and the and E were located).Thesefeatures, combined,present consider-ablechallengesforRANSturbulencemodelling–two commonmodelsfortransonicaerospaceapplications the 1-equation Menter’s k–o 16
At virtually allstations, theSAmodelpredicteda greatersuctionpeakinthepresumablyseparatedzone downstreamofthewedgeangle,andamildergradient the flow reattaches when compared to the SST results. As a result of this consistent behaviour, the resultsareambiguousfordeterminingsuperiormodel model is clearly better than the other for matching all three points at each station. Despite this, the matching of the trends across sta-tionsandinparticularacrossthestingpodis encoura-have a basic
At8o,showninFigure6,themodelsappearmore
closely matched for suction peak and reattachment behavior, and at station E the SST model now pre-dicts a greater maximum low pressureon the wedge angle.Thisafeaturedconsiderablymoreinterference from the strut,as can be observedlater (Figure12). While correlation remains good, again, particularly with regards totrends, a morenotable set of discre-pancies can be observed from the tappings down-stream of the leading-edge wedge, indicating a stronger pressure gradient in the experiments than the CFD was able to predict at stations A to E. This suggests that the CFD was somewhat under-predicting the expansion of flow from the wedge ontothemain(flow-aligned)sideofthestrut, poten-tially due to separation. A similar scenario in the expansion region at the rearmost tap of station E wasseeninbothcases,on thesting podboat-tail.
For both angles presented here, the SA model appears better at predicting the flow over the sting pod, and marginally better at predicting CP at the
majority of strutstations. Withouthigher-resolution pressuredatatodrawon,itwasdecidedthattheSA model was the preferable option as it combined satisfactory performance with a slightly reduced computational expense. Ideally,well-calibrated pres-sure-sensitivepaintwouldhelpgreatlyin helping dif-ferentiate themodels.However,only thermochromic liquidcrystal(TLC)coatingswereavailablewithinthe narrowbudgetandtimeframeandthesedidnot pro-vide enough instantaneous clarity and range to help refine theanalysisof themodel discrepancies.
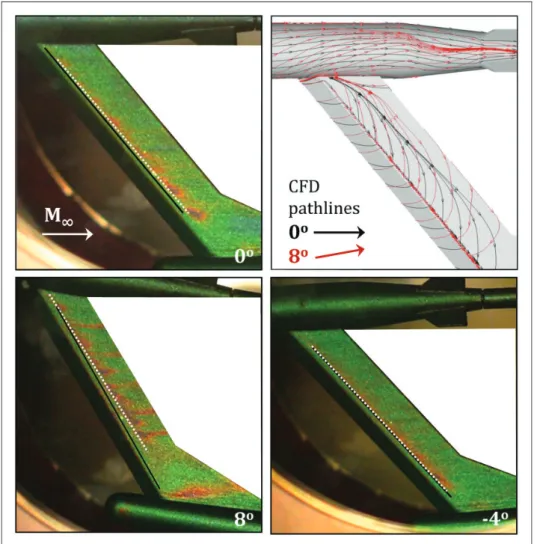
Nevertheless a comparison was made to images taken of the TLC tests; these are presented in Figure 7. In the images, and consistent with time even as the model cooled and the colour-change observed varied, a clear line could be seen on the flow-aligned side of the strut approximately 1.5mm behindthe wedgeregion. TheCFDresults indicated thattheflow wasseparating at thispoint,remaining sooveralargeportionofthestrut(thoughno signifi-cant vibration was observed or measured, this sug-gests thepotential for strong buffet in different flow conditions).Thethreedimensionalityoftheflowdue to the sweep angle delayed the separation from the wedge angle as seen in the inset of Figure 7, which showspathlines inthe cellnext to thesurface of the strut for two different angles. It is likely that the experimental separation line was slightly (<0.5mm) rearwards of the predicted points due to the model paint coating blending the otherwise sharp angle to a small extent, helping the flow around the corner more effectively than in the sharp, idealized CFD model.
Overall,thematchoftheCFDandtheexperiment intermsofthisseparationlinewasdeemedtobegood otherthanat 8o,where theCFD separationline was
considerably closer to the wedge angle, potentially due to the paint issue mentioned as well as slight
Meshconvergenceforliftanddragcoefficients,
Figure 4.
storewithandwithoutthestrut/sting.
a case.
the way in which the pressure thetunnel model.
tion F, x/c¼0), and the strut Correlation is acceptable on
potential for extensive separation anticipated, presenting a complex
lower sting pod (where stations A
were used for CFD comparisons: Spalart-Allmaras (SA) model15 and ShearStressTransport(SST) model.
as
performance as no
ging, indicating that both models competencefortheflowfield.
differencesintheangleofattackduetomodel deflec-tion. With separation lines fairly constant over the whole strut, this further suggests that the influence and that a simple lengthening of the strut wouldbe unlikely to over the upper
and pitching moment coefficients from the tunnel tests, presented configurations differential principle shown in moments were summed based on a centreof pressurefor the clean
store predicted at x/l¼ 0.485.Thetrendsof allthree graphs areconsistent with otherreported studies on storesusingtypicalstrutstings.6,7
TheFigure8dragcoefficient(CD)plotindicatesa
distinct‘‘bucket’’ shapefor lowerdrag atlow angles of attack, and a considerable increase at the higher angles where separation, particularly around the sharp fins, is experienced as opposed to the fully attached flow at low angles creating minimum drag conditions. The results obtained from the difference between clean store-only models and the strut-mountedversions(corrected)produceda consistently lowerCDacrossthewholerange,andalthoughifone
looksat onlythe drag force of thestore part of the store/strut arrangement, the CFD indicates that the dragcoefficient(basedon onlythestorefrontalarea) ishigher–likelyduetothestrutinterferenceincluding
Chordwisepressurecoefficientsateachstrutstation(c*islocalchord)vs.CFDpredictionswithSAandSSTmodels.
Figure 5. 0o
of the lower sting pod is very slight influence the pressure distributions part ofthestrutandthestoreitself.
Forces
and
moments
The lift and drag force coefficients for store-only and store/strut/sting (using the superposition
described in the introduction), are Figures 8–10, respectively. All
Figure 6. þ8o Chordwisepressurecoefficientsateachstrutstation(c*islocalchord)vs.CFDpredictionswithSAandSSTmodels. additionalwave drag andboundary layer disruption
asisdiscussedinthesubsequentsection.
TheCFDresultstendtowardsunder-predictionof thedrag coefficients,excepting thestoreonlyat high anglesofattack(>8o).Thediscrepancymaybedueto
the increasing error in true tunnel attack at higher angles, coupled with a tendency for the turbulence modeltoover-estimatetheextentof separationfrom the fins and base of the model. Nevertheless, the ‘‘bucket’’ is less pronounced in the experimental results than with the CFD for the strut-corrected model, with higher measured drag – it is possible that the CFD may fail to accurately capture the extent of separation on the strut and original sting podasa increases,though thisisjustonehypothesis andunfortunatelycannotbe establishedconclusively fromtheavailablepressureandvisualization.
Theliftcoefficientsin Figure9 indicatethatCL is
under-predictedwiththestrut-correctedversioncom pared to the clean store, in both experiments and CFD. The CFD matches the experimental results more closely than for drag, and both results are within respective margins of error of each other apartfrom above10o a.Thenegativeoffsetof liftat
0o is a clear indication of theunwanted influenceof
thestrutevenwhenthestoreresultsarecorrectedfor its influence (as CL should be zero here), and the
marked divergence of the coefficients from both types of model at a above 4o help to point to
the pitching problem that the study set out to investigate.
Accordingly,thepitchingmomentcoefficients(CM)
presented in Figure 10 highlight the expected result, beingthatthecorrectedstore/strutmomentsbeginto
diverge, increasingly,fromtherelatively linear store-onlymoments atanglesofattackabove4o.Atlower
angles, the discrepancy is fairly constant and would lend itselfto a simplecorrective factordueto avery
systematic offset. At higher angles, the discrepancy begins to become more exaggerated. The maximum angles tested did not fully explore the extent of the divergence, though this is shownmore clearly in the
Thermochromicliquidcrystalvisualizationofstrutseparationlinesforvariousangles(experimentdenotedbywhite
Figure 9. CFDcomparisonstoexperimentalresultsforlift
coefficientvs.angleofattack.
CFDcomparisonstoexperimentalresultsfordrag
Figure 7.
overlay,CFDpredictioninblack).
Figure 8.
non-windtunnelmodelresultsinthenextsection.The storeitself inthestore/strut model(from forcesonly actingonthestoresurfaces,extractedfromtheCFD) exhibits a moment which would not serve to return thestore toa more neutralangle ofattack, withthe strut,thetrendiscorrectstillbut furtherstruteffects would be present in any experiment measuring the totalmomentsofthefullgeometrysothesemoments arepresentedmerelyforcomparisonandasanaidto pinpoint the strut influence. Taken all together, the moments shown are indicative that the simplified
Figure 10. CFDpredictionsofpitchingmomentcoefficient
vs.angleofattack.
strut/store model presented here suffers the effects reportedbyothers.
CFDresultsfromtheunbounded(notunnelwalls) model is included in Figure 10as an indication that walleffectswereslight,especiallyforthelow-blockage store-onlymodel.Thehigher-blockagestrutmodelin the tunnel exhibited a general over-prediction of the moment with decreasing consistency in trends from pointtopoint;however,theprimarygoalwastoval idate CFDability to reproducetheimportant trends and flow features and therefore the CFD approach was well placed to evaluate proposed solutions to themomentdivergenceproblem.
Further
numerical
analysis
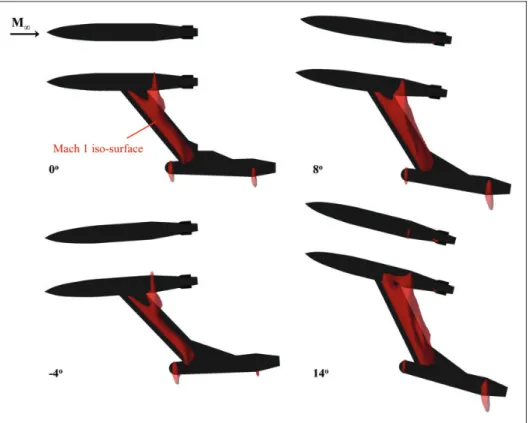
The CFD was interrogated further to provide a clearer representation of the problems of such a strut. Figure11 showsa visual representation of the regionsofsupersonicflowaroundthestore.TheCFD resultshighlightedthefactthata flowregion greater thanMach1formedovertheanglebetweenthestrut leadingedge wedgeand theparallelmainsection for allanglesofattackwiththestrutmodel,aidedbythe separationbubbleonthestrutproducinganaerofoil esque flowcurvaturetofollow.
The flow downstream of the strut wedgeremains separated for a portion of the strut surface as was indicated by the TLC results, but the supersonic region around the surface maintains until further downstream, or into the wake at 8o and above.
Notablefrom thesegraphicsisa‘‘creep’’ofthestrut shockwaveontothestoreintheregionofthejunction interface, which is also in the vicinity of the store region of strong pressure gradient). No such shockwave was observed for the means that at ,aminorchangeinforcesandmomentscould beexpected.However,at thehigher anglesofattack, the issue was significant super-sonic flowexistsarounda large portionofthelower store at the strutjunction and downstream, and the vortexproducedherecouldalsobeexpectedtoexerta the fins downstream. The add-itional low pressure associated with this effectis the overwhelmingreasonfortheincreasingdivergence of the pitching moment predictions from store-only to start of this paperasbeingtheprimarymotivationforthisstudy. This hypothesis issupported byFigure 12, which showsthesurfacepressurecoefficientdistributionson thestore-only andstore/strut/sting modelsat 0o , -4o ,
.Thecleanstore exhibitsrelatively benign the pitching momentresults,withtherearfinsprovidingastrong restoring momentcoupled with thelow pressuredip on theupper portions wherethe central body meets in place, what begins as a mild exaggerationandasymmetry of the very strong
interferenceatthehigherend–thestrutandthe junc-tion between it and the store become increasingly exposed to the oncoming flow. A combination of the strong vortex forming there and the effective reductioninstrutsweepangleencouragingastronger shock waveserves to significantlyinfluencethe pres-sure distribution, to the extent where the pitching characteristicsofthestorewouldbecomefarremoved fromthatwhichwouldbeexpectedofa‘‘clean’’store. Thelowerportionoftheboat-tail experiencesstrong lowpressure(suction)behindthestrutandtheflowto thefinsisgreatlyaffected theseeffects resultin the divergent valuesof thestore-onlymoments seen pre-viouslyinFigure10.Thejunctionbeginsclosetothe store mid-point but ends far downstream, and it is furtheryettothetailbeforetheseinfluencesmanifest themselvesfully;thusthelocationofthestrutjunction appears to be poorly positioned, resulting in highly undesirable flow over the full boat-tail and fins where the moment-producing forces are most prominent.
Results
of
redesign
Two very simpleredesigns were consideredas initial stepsthatcanlaterbeoptimizedforusewithspecific geometries resultspresentedhere indicate preferen-tialcharacteristicsforstrutshapeandlocation.While it isvery likely thatthe strutcould be less extensive (thinner, shorter chord) depending on the material
Pressurecoefficientsonthesurfaceofthestoreandstrutforcleanandsting/strutconfigurationsatvariousanglesof
Figure 12. attack.
boat-tail (and therefore a
store-only comparison model, which zero a
and particularly up at 14o – where
expected to bemore exaggerated–
– strong influence on
store-strut models, mentioned at the
8o and14o
changes as would be expected from
– the boat-tail region. With the strut
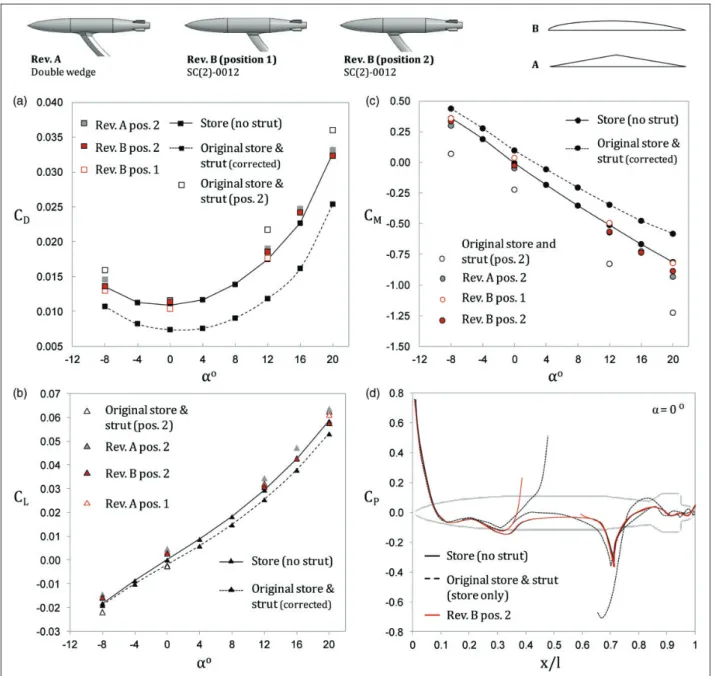
Figure 13. (a)Dragcoefficient,(b)liftcoefficient,and(c)pitchingmomentcoefficientforcleanstore,originalconfiguration(pos
itions1and2),andreviseddesignsAandBatdifferentpositions,vs.angleofattack.(d)Storelength-wisecentrepressurecoefficients
fororiginalandredesignedstruts.
andstrengthneeded,theoveralllengthandmaximum thicknessweretheonlyvariablespreserved.A double-wedge profile (REV A) was tested along with one featuring an aerofoil cross-section (REV B), chosen as a modified NACA0012 (SC-2-0012,17 exhibiting some of the rudimentary features of a supercritical section to delay shock onset). These can be seen at the top of Figure 13; not shown is the full strut, which was designed with variable sweep such that theangle formed a continuous curveaway from the junction(at23o)tothehorizontalsectionrequiredto
matetotheoriginalstingmount.Thiswasdesignedto mitigatethe onset of supersonic flow and associated wavedragandbuffeting,providingalevelofimmun isation against unwanted reductions in the sweep angle with increasing store a. A more complex,
real-world strut could be designed to maintain an angle appropriate to the Mach number even as the store angleofattackchanged,but theredesignshere wereintendedonbeingfixed,unhingedarrangements. Twopositionswereestablished,oneatthesite ofthe original strut junction (position 1), and another on the forward portion of the store (position 2). Both theoriginal strutandtherevised designswereevalu atedatposition2,toprovideaclearercomparisonof theeffectof movingthejunctionlocation.
The REV A junction centre was approximately coincident with the centre of pressure of the clean store, and REV Bfurther upstream than thiswith a longertrailingtaperonthejunction.Simulationswith theexpandedcomputationaldomain(notunnelwalls) wererunforthecleanstoreandtheoriginalstoreand
o),aswellas
and20o).
Figure 13(a)showsthatthedragunder-prediction fromtheoriginalstrutresultshas largelybeensolved differences of approximately exist across the additional corrections required, as opposed to 0.005–0.008 with the original strut. The aerofoil-sectioned REVB is marginallycloser to the cleanstoreplot,andperformsbetterclosertotherear (position 1) than the forebody. Moving the original struthadtheeffectofgoingfromunder-predictionto over-prediction whenonlythestore forceswere con-interference effect than previously. Figure 13(b) indicates that the predicted liftcoefficientsaresimilarlymuchimprovedwithREV B (and slightly more accurate at position 2), to the pointwherethevaluesarenear-identicaltocleanstore results at the higher angles.The REV Astrut, how-similar amount to that under-predicts, caused by thelargepressuregradientoverthewedgeatthe junc-tion, which gives thestore a slightly higher pressure onthelowersidetowardstheboat-tailthanontop.A refinement of thejunction could minimize this the the wedge shape into the store even with a fillet,whereas a more subtleblend wouldreducethiseffect.Theaerofoilsectionblendis naturallymoregentleandtangentialatalltimestothe negation of this on the store coefficient graph in Figure 13(c) showsthatin contrast tothe increasing divergence of store moments from the original strut revisions offer markedimprovementstothemomentfidelity,tending the restoring moment at the highest angles tested. REV B offers
the superior match to the clean store CM, staying
moretruetotheplotatthehighestanglesand match-ing the trend of the curve better than the double wedgemodel thisistheresult oflargely shock-free flowoverthewholestrut,thecarefuljunction blend-ing, and the junction location just upstream of the centre of pressure; all three traits appear to be highly preferable and should be applied to future designoptimizations.Atlowandnegativeangles, pos-ition 2 is preferable, but at higher angleswhere the originalproblemwasmostexacerbated,therearwards position1ismoreeffective.Movingtheoriginalstrut to position2 has a detrimental effect,in fact produ-cing a more erroneous moment coefficient than the original.
Figure13(d)showsthattheREVBpressureprofile around the mid-store (symmetry) planematches the cleanstoreprofileinnear-exactfashion,withtheonly exceptionbeingatthejunctionleadingedgewhereCP
jumpsbyabout0.2locally–theboat-tailCPis
negli-gibly affected. Itoffers a demonstrable improvement overtheoriginalstrutinterferenceandcanbefurther refined to minimize the junction pressure spike in a similar means by which the extended trailing edge does.ThepressurecoefficientplotsinFigure14clarify the overallstrutinterference for RevB in both pos-itions,andindicatethattheforwardpositionsat0and 12degreesbothhaveaslightlyhigherinfluenceonthe storethantherearwardposition.
Conclusions
Theadverseinterferenceeffectscausedbyastrutsting forstorereleasewindtunneltestingwereinvestigated usingacombinationofCFDandwindtunnel experi-ments at Mach 0.85. The sting was based on ones typically used for this kind of work, and the store was a simplified Mk82. Blowdown wind tunnel tests weredesignedtobeeffectiveasameansofvalidating
Pressurecoefficientsonthesurfaceofthestoreandstrutfor(top)cleanandforeandaftREVBsting/strutconfigurations
Figure 14.
at0o and12o anglesofattack.
strut(-8o ,-4o, 0o, 4o, 8o, 12o, 16o and20
thetwonewrevisions(-8o, 0o, 12o, 16o
– with both redesigns –
0.001–0.002 (typically 2–3%) in CD a range with no
sidered, indicating a worse
ever, over-predicts lift by a which the original strut
– current design preserves
store circumference, leading to a problem and an extremely mild effect pressuregradients.
Accordingly, the moment
compared to the clean store, both towards a slight over-prediction of
the numerical model, which was used in turn to enhance the value of multi-variable wind tunnel results and elucidate, with higher resolution, the natureofthestrut/storeinterference.
It was found that the junction between the strut andthestoreisbyfarthemaincauseindiscrepancies betweenthesting model andthe‘‘store only’’model freeof any sting effects. Theunrefined aerodynamic characteristicsofthestrutcausedtheflowtoseparate in places, whereas in the store-only case the flow is largely separation-free. The disruption of the strut contaminates the pressure distribution over the store,causinga shiftin thepredictedmomentcoeffi cient that increasingly deviates from the store-only case withincreasing angle of attack.The strutblunt trailing edge was too close to the start of the store ‘‘boat-tail’’ section, causing a constructive interfer ence effect that exaggerates the discrepancies, and also influences the flow reaching the fins and wake region. At high anglesof attack,the effective sweep angle of the strut is reduced, leading to a stronger shock that eventually surrounds the store aft of the junction.Aredesignedstrutusingasupercriticalaero foilsection,variablesweep,andacarefulblendofthe store/strut junction was shown to provide marked improvementstotheaccuracyandconsistencyofpre dictedmoments, suchthat littlecorrection wouldbe necessarytorawtunnelresults.Althoughnotpursued here,inanindustrialstudythevalidated CFDmeth odology could subsequently be applied to the full-scale problem in much more detail to obtain results for conditions which could not be examined in the tunnel.
Acknowledgments
Many thanks are extended to Alex Cenko for providing significantcontinuing adviceandbackground information during this work. Dr Doig’s travel to the US Naval Academy was financed by the American Australian AssociationthroughaQANTASAirlines-sponsoredfellow ship. The assistance of technical staff at the US Naval Academy is gladly acknowledged, particularly Rusty Foard,FritzWoolford,GeorgeBurtonandMattStanley. DeclarationofConflictingInterests
Theauthor(s)declarednopotentialconflictsofinterestwith respectto the research, authorship,and/or publication of thisarticle.
Funding
Theauthor(s)receivednofinancialsupportfortheresearch, authorship,and/orpublicationofthisarticle.
References
1. CenkoA.Experienceintheuseofcomputationalaero dynamics to predict store release characteristics. Progr AerospSci2001;37:477–495.
2. CenkoA.OneCFDcalculationtoendpointflighttest ing.AeronauticalJ2006;110:39.
3. CenkoA. Store separation lessonslearned during the last 30 Years. In: Proceedings of ICAS2010, Nice, France,19–24September2010.
4. O’BrienCW,SnyderMR,HallbergEN,etal.Effectsof targetingpod modificationonF/A-18C Hornetweap onsrelease.AeronauticalJ2012;116:743–755. 5. FinleyDB,MessinaT,ChankayaK,etal.Comparison
of CFD-basedsimulation ofexternal fuel tank separ ationwithflighttest.In:52ndAIAAaerospacesciences meeting, Maryland, National Harbor, 13–17 January 2014,AIAAPaper2012-3337.
6. Finney L and Hallberg E. An investigation of cavity flow effects on a store in the vicinity of the shear layer. In: International Test and Evaluation Association, 15th aircraft/stores compatibility sympo sium,FortWaldenBeach,FL,19–22April2010. 7. SnyderMR,ShahR,O’BrienCW,etal.Struteffectson
store freestreamaerodynamics. In:29th AIAAapplied aerodynamics conference, Honolulu, Hawaii, 27–30 June2011,pp.1–11.
8. Dix RE, Perkins TM and Grubbs MA. Store loads, static and fluctuating pressures, and separation trajec tories near a generic cavity. TN: Arnold Engineering DevelopmentCentre,1987.
9. CenkoA,ChenDandTurzanskiR.Influencefunction method application to cavity flowfield predictions. JAircraft1989;26:760–764.
10. DoigG,SnyderM,BogdanG,etal.Aspects ofsting interferencefortransonicstorereleasewindtunneltest ing.In:51stAIAAaerospacesciencesmeetingandexhib ition,GrapevineTX,2013.
11. DoigG,BarberTJ,NeelyAJ,etal.Experimentalval idationasanintegralcomponentofcomputationalfluid dynamicresearch.ANZIAMJ2010;51:265–279. 12. BarberTJ,DoigG,BevesC,etal.Thesynergisticinte
grationofCFDandEFDforgroundeffectaerodynam ics studies. Proc IMechE, Part G: J Aerospace Engineering2012;226:602–619.
13. DoigG,BarberTJ,NeelyAJ,etal.Aerodynamicsofan aerofoilintransonicgroundeffect:Numericalstudyat full-scaleReynoldsnumbers.AeronauticalJ2012;116: 407–430.
14. DoigG,BarberTJ,NeelyAJ,etal.Aerodynamicsofan aerofoilintransonicgroundeffect:Methodsfor blow-down wind tunnel scale testing. Aeronautical J 2012; 116:599–620.
15. SpalartP andAllmaras S.A one-equationturbulence modelforaerodynamicflows.AIAAPaper1992-0439, LaRechercheAerospatiale1,1994,p.5.
16. Menter FR. Two-equation eddy-viscosity turbulence modelsforengineeringapplications.AIAAJ1994;32: 269–289.
17. AbbottIHandVonDoenhoffAE.Theoryofwingsec tions,includingasummaryofairfoildata.Mineola,New York:CourierDoverPublications,1959.
Appendix
Notation
CD dragforcecoefficientinthex-direction,
CL
CM CP
h
liftforcecoefficientbasedon projected platformarea
pitchingmomentcoefficient pressurecoefficient
heightofwindtunneltestsection(mm)
k turbulentkineticenergy
l storelength(mm)
M1 freestreamMachnumber angleof attack
! specificturbulence dissipation
by guest on May 25, 2016