137
USING GIS TECHNOLOGIES IN PROCESSING AND INTERPRETATION
OF SATELLITE IMAGES
M. HERBEI* , L. DRAGOMIR *, C. Popescu*, Silvica ONCIA* *
Banat University of Agriculture Sciences and Veterinary Medicine Timisoara – Faculty of Agronomy E-mail: [email protected]
Abstract: The Geographic Information System is a collection of located, collected, stored and managed geographic data with the use of the computer, data which can be used to perform various spatial analyses. The special GIS operations over the spatial information make from these instruments more than just efficacy instruments for making maps, but especially, irreplaceable instruments for analyzing the information that refer to the terrestrial surfaces. GIS maps must be made exploiting all available resources based on rigorous analysis of their content and the costs involved, seeking assurance required with maximum efficiency. Each data source requires the existence of specialized programs that would bring appropriate map data into digital form, starting with providing necessary equipment, going through technological problems and data conversion, with the purpose of preparation and proper training of personnel. In a GIS, data can be stored in two fundamental spatial data models: vector and raster. Raw raster data can be as follows: satellite images or orthophotos, while the raw vector data can be obtained from topographic survey or data acquired by GPS technology. The information obtained from remote sensing is contained by the cosmic or aerial images, which can be interpreted for many purposes. Building these images is based on detection and registering of electromagnetic energy reflected or issued by the surface of the objects present on the visual field of the sensors, which interacted with the electromagnetic energy issued by a natural source (e.g. Sun, Moon) or an artificial one (e.g. radar). The response of the objects from nature to various wavelengths of electromagnetic radiation is different, depending on their physical and chemical properties, configuration and surface roughness, its illumination intensity and angle of incidence. These responses recorded via sensors translate the image by the emergence of patterns (features), based on which objects can be distinguished and identified.The remote sensing data is public, meaning it can be acquired from any area of the world and by anyone, with some restriction.
Key words: GIS, Landsat, bands, combination, band math INTRODUCTION
Landsat satellite imagery signifies perhaps the most important episode in the history of remote sensing and Earth observation. Between 26 July 1972 and 18 November 2011, six satellite missions have produced an impressive archive, given that the registration of the same area (satellite scene) was performed every 19 days (the first satellite) and every 16 days (the Landsat 5 and Landsat 7 satellites). Used sensors (optical, and from Landsat 5, optical and thermal infrared) have produced images of medium spatial resolution (eg. 30 m in multispectral, 15 m in 60 m panchromatic and infrared thermal sensors on Landsat 7 ETM +).
The main advantage of such images is the remarkable spectral resolution, allowing numerous combinations and possibilities especially valuable digital analysis using specialized software packages. Although Landsat mission is now complete, it is planned for 2013 LDCM project initiation (Landsat Data Continuity Mission), by the placing in orbit of Landsat 8.
138
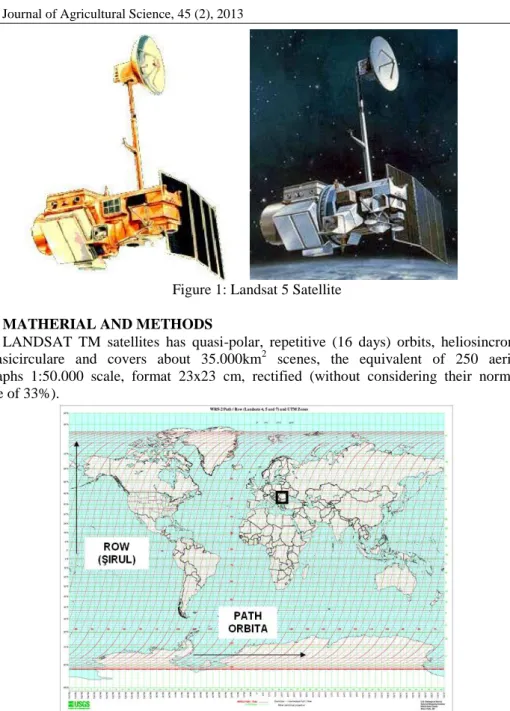
Figure 1: Landsat 5 Satellite MATHERIAL AND METHODS
LANDSAT TM satellites has quasi-polar, repetitive (16 days) orbits, heliosincrone and cvasicirculare and covers about 35.000km2 scenes, the equivalent of 250 aerial photographs 1:50.000 scale, format 23x23 cm, rectified (without considering their normal coverage of 33%).
139
Figure 3: Romania and dividing the LANDSAT ETM + satellite scenes
Detectors record the electromagnetic radiation in 7 spectral bands. Bands 1,2 and 3 is visible portions of the spectrum and are useful for detection of engineering infrastructure works but also allow water turbidity study. Lanes 4, 5 and 7 are in the infrared region of the electromagnetic spectrum and are used with priority to delimitation of the land surface covered with water, especially in the study of vegetation. Band 6 (thermal infrared) is used for monitoring vegetation. An important feature of this channel is that the captured energy is emitted by the Earth's surface.
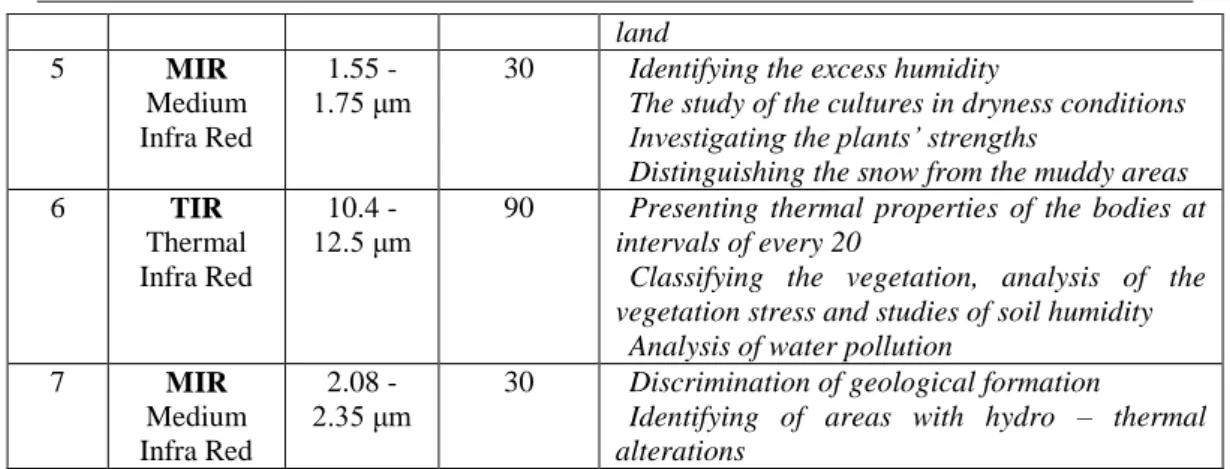
In the following table are the LANDSAT bands and their applicability.
Table 1 The LANDSAT bands and their usability
Band no. Spectral band Length waves Spatial resolution (m) Usability 1 B - Blue 0.45 - 0.52 μm
30 Interpretation of the water occupied areas Analysis of soil characteristic, vegetation and land use
Identification of anthropic elements
2 G- Green 0.52 -
0.60 μm
30 Achieving a qualitative dissociation of the vegetation (identifying healthy vegetation)
Identification of anthropic elements
3 R - Red 0.63 -
0.69 μm
30 Distinguishing of plant species
Determining of pedological and geological limits 4 NIR Near Infra Red 0.76 - 0.90 μm
30 Determining the vegetation type Determining the biomass quantity Identifying the cultures
Precise mapping of the water front
140 land 5 MIR Medium Infra Red 1.55 - 1.75 μm
30 Identifying the excess humidity
The study of the cultures in dryness conditions Investigating the plants’ strengths
Distinguishing the snow from the muddy areas
6 TIR
Thermal Infra Red
10.4 - 12.5 μm
90 Presenting thermal properties of the bodies at intervals of every 20
Classifying the vegetation, analysis of the vegetation stress and studies of soil humidity
Analysis of water pollution
7 MIR
Medium Infra Red
2.08 - 2.35 μm
30 Discrimination of geological formation
Identifying of areas with hydro – thermal alterations
Typically, the analysis of remote sensing are using standard combinations of spectral bands tailored for the considered topics.
RESULTS AND DISCUSSIONS
For this application was used a Landsat TM satellite image of 2011 covering Timişoara metropolitan area.
Metropolitan area of Timisoara municipality is a future project which aims to create an integrated administrative unit, between Timisoara and peri-urban communities: Dumbravita Ghiroda, Mosnita noua, Giroc, Sanmihaiu Roman, Săcălaz, Sanandrei, Giarmata, Ortisoara, Remetea Mare, Sag and Parța.
Figure 4: Timisoara Metropolitan Area
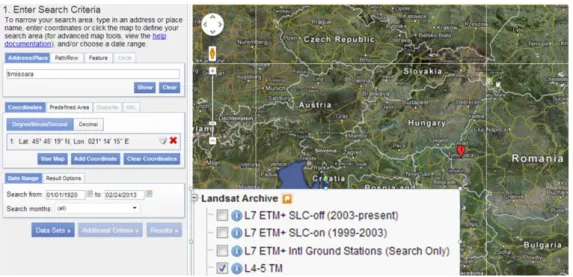
Satellite image with the 7 spectral bands was downloaded from Earth Explorer database (http://earthexplorer.usgs.gov), and subjected to complex mathematical operations in the digital environment.
141
Figure 5 Satellite image downloading
Image covering the study area was downloaded together with all 7 spectral bands, having a spatial resolution of 30m and the following indication: LT51860282011248MOR00 which has the following meaning:
LT5: Landsat 5 TM, satellite and sensor; 186: orbit;
028: row;
2011 – registration year; 248 – number of days in 2011;
MOR00 – land station capturing the signal and creating the image. (Moscow, Russia).
142
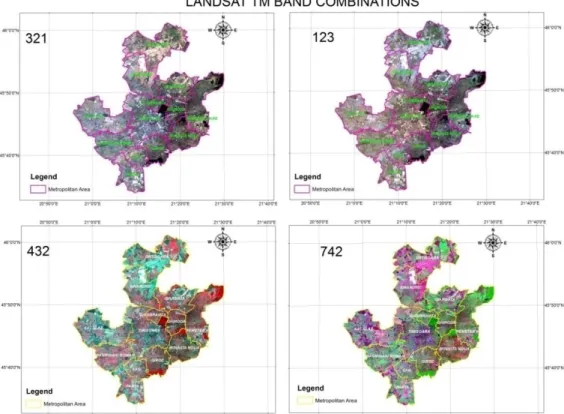
Below are the most important combinations of spectral bands, which were processed from Landsat TM satellite image of Timişoara metropolitan area, processing performed using ArcGIS software v10, Raster Processing module - Composite Bands. There is also presented the interpretation of results for the combinations:
Combination: blue-green-red 321
This combination has the best situation on the ground so it is easy to interpret because natural colours allow easy recognition of land, especially if known date of taking over the scene. The scope is the shallow water bathymetry analysis and degree of clogging.
Interpretationof these resulted images is the following: dark green / purple for coniferous forests (spruce), dark green / black for coniferous forests (spruce, pine), light blue for the subalpine and alpine meadows, white for settlements and isolated farms, roads, yellow-gold for clogged lakes, brown for plowed fields.
Combination: red-green-blue 123.
This combination carries the name of "natural colours" because it is using visible bands perceived by the human eye. Scope is the study of surface water or sediment in suspension.
Interpretation of these resulted images is the following: dark green - black / brown for coniferous forests (spruce, fir), including juniper trees, green for leafy forests, pastures and meadows, white for snow, clouds, soil brown, silt in the river valleys, roads, driveways,ski slopes, construction and household hearths scattered settlements, soil erosion, and steep limestone quarries with rock; light brown - for mountain soils acidic; brown – for plowed lands withcernoziomoidesoil, buildings covered with tiles, violet - for plowed lands withcernoziomoidesoils affected byhydromorphismin alluvial plains.
Combination: near infrared-red-green 432
This combination includes two bands from the visible area, of near infrared, representing an area with shaded vegetation response and cloud formations are easily penetrated. This combination is useful in the study of vegetation, remote sensing analysis and delineation of the built space covered with vegetation.
Interpretation of these resulted images is the following: deep red
fordeciduousforests, red for green meadows, grassy farmland, dark green-black for conifer forests, blue-green light for land with
open
soil ,white for snow remaining, avalanche colour or niches, green for land with excess moisture, blue for lakes and minor rivers beds, light green for settlements.Combination: medium infrared –near infrared -green 742/542
This combination is very similar to the 247 but can bring some new elements in the interpretation of satellite images. The scope is for geology and it is best in identifying eroded land and some structural tectonic differences.
Interpretation of these resulted images is the following: green image
fordeciduousforests, arable land covered by vegetation, orchards, pastures depression, dark pink for grassland and arable open ground or poorly covered with vegetation, green dark – brown for conifer forests, violet foropen land on steep rock,
asphalt roads, concrete
143
construction, blue for remaining snow and avalanches colour, dark blue for white minor rivers, lakes cuvettes, dark pink-gray for bare land with excess moisture, green-gray for grassy field with excess moisture.
.
Combination: green – near infrared – medium infrared 247
This combination requires an extra effort in recognition of geographical entities in the field because it had a colour range, which can be difficult to interpret. Due to the use of 2 lanes from the medium infrared region together with the band from the visible area increases spectral resolution and the ability to distinguish categories of vegetation in relation to soil and rocks. The scope is to differentiate categories of vegetation in relation to soil and bark,highlighting the excess moisture and flooded land, difference of construction levels inside the towns.
Interpretation of these resulted images is the following: dark pink for grassland and arableopen groundor poorly covered with vegetation, orange-red for areas with steep open rock,
asphalt roads, concrete constructions, yellow for snow, light green for leafy forests, arable land covered by vegetation, orchards, pastures depression, dark green, dark blue for conifer forests, blue for land excess moisture in the alluvial plain, brick buildings covered with tiles, black for white minor rivers, lakes without tributaries premises.
Combination: near infrared - medium infrared –red 453
Using two infrared bands this combination shows better spectral signature of vegetation and cloud formations are almost completely eliminated. Here the scope is the study of vegetation and land use and construction differentiation by the material used.
Interpretation of these resulted images is the following: bright orange
fordeciduousforests, orchards, orange – gray for grassy meadows, deep orange, dark green for mixed forest (beech and conifers), dark green for coniferous forests (spruce, pine), blue-green light for subalpine meadows with bare soil after snowmelt, pink for snow remaining, light green for land with permanent humidity excess, blue for settlements, roads, railroads, Black for river valleys, drainage channels, lakes, white and blue for constructions made predominantly of brick.
Combination: green – red – near infrared 234
This combination introduces near - infrared together with 2 bands from the visible area so that vegetation response is more pronounced and cloud formations are easily penetrated. This combination allows differentiation of the uncovered areas from the ones covered by vegetation, and depending on the situation it also allows differentiation of forest types.
Interpretation of these resulted images is the following: deep red
fordeciduousforests, light red for green meadows, farmland grass, dark green – black for conifer forests, light blue-green for open ground, subalpine and alpine meadows, white for snow, green for land with excess moisture, blue for minor lake and river beds, green light to white for settlements, where light shades are brick constructions and the dark shades are concrete constructions.
Combination: near infrared – medium infrared - medium infrared 457 Because this combination uses only the spectral bands from near-infrared area and medium infrared area, the spectral signature is diverse and thus it can distinguish certain details that are smaller size than the spatial resolution. This combination is useful in analysing wet
144
areas. Because it does not use any bands from the visible area, shading effects are eliminated from the slopes and cloud formations.
Interpretation of these resulted images is the following: dark orange
fordeciduousforests, light orange for green secondary grasslands, arable land and pasture grass in unincorporated areas, parks and gardens in urban areas; orange and dark green for mixed forests, orange-green for secondary grasslands without grass, poorly protected soil and excess moisture, dark green – black for conifer forests, mountain pine; red for snow remaining, bluish green for arable land, soil subalpine open meadows; blue for construction, buildings of dark shades made of concrete and light shades made from other materials and cement; black navy for rivers beds, ponds, greenish grey for areas with excess moisture.
145
Fig. 8. Landsat TM Combinations for Metropolitan area of Timişoara CONCLUSION
In order to optimize aspects of soil production capacity, an inventory management of this resource is required using remote sensing techniques.
Research of land area from airspace and outer space using remote sensing techniques delivers valuable information for many industries, among which: agriculture, forestry, geology, soil, hydrology, cartography, exploration and evaluation natural resources, environmental monitoring (soil, water and air) and others.
Landsat images can be used successfully in a number of scientific applications and practical problems: global urbanization, wetland delineation, detecting changes regarding the use of land, forest areas management, management of natural parks etc.
BIBLIOGRAPHY
1.DAVIS, D., - „GIS for Everyone”, ESRI, 1999;
2.IONESCU, I. – “Engineering Photogrammetry”, Ed. Matrixrom, Bucuresti, 2004;
3.VOROVENCII, I. – “Researches guarding the possibilities of using satellite images in forest” Development projects. Doctor’s degree paper. “Transilvania” University, Brasov, 294 p, 2005;
4.POPESCU, C. – “Remote sensing and geographical informatics systems in agriculture” Eurobit press, Timisoara, 2007.
5.HERBEI O. & HERBEI M. – “Geographic Information Systems. Theoretical and applications”, Universitas Press, Petrosani, 2010.