Procedia - Social and Behavioral Sciences 53 ( 2012 ) 590 – 600
1877-0428 © 2012 The Authors. Published by Elsevier Ltd. Selection and/or peer-review under responsibility of SIIV2012 Scientific Committee doi: 10.1016/j.sbspro.2012.09.909
SIIV - 5th International Congress - Sustainability of Road Infrastructures
Turbo-roundabouts
vs
Roundabouts Performance Level
Giuffrè O.
a, Granà A.
a*, Marino S.
aaDepartment of Civil, Environment, Aerospace and Materials Engineering, University of Palermo Viale delle Scienze Ed. 8, 90128 Palermo, Italy
Abstract
In this paper the performance level of basic turbo-roundabouts and double-lane roundabouts are compared. Cowan’s M3
headway distribution was chosen to take into account bunched vehicles moving along each circulating lane; the Hagring model was adopted to evaluate entry capacity both at turbo-roundabout and at double-lane roundabout.
The comparative analysis was performed evaluating operational performances in terms of delay suffered by users entering the intersection.
Results of the analyses show that efficiency of basic turbo-roundabouts highly depend on traffic situations and can be significant when major road captures most of the traffic demand.
© 2012 The Authors. Published by Elsevier Ltd.
Selection and/or peer-review under responsibility of SIIV2012 Scientific Committee Keywords: turbo-roundabout; double-lane roundabout; delay.
1.Introduction
Turbo-roundabouts represent a recent evolution of roundabouts. Among patterns of roundabouts characterized by high capacity and improved traffic performances, the design choice may fall on a standard double-lane roundabout or on a basic turbo-roundabout. This last concept of roundabout has been designed to increase the level of safety at roundabouts without reducing their efficiency, but adequate evaluation of safety performances is not yet available due to only a few installations are actually operating. So the choice between the two intersection layouts may be done by evaluating the convenience in terms of performances, when the traffic demand is known. Nevertheless, although entering flows have to give priority to circulating vehicles moving anticlockwise around a central island as in traditional roundabouts, at turbo-roundabouts conflicting schemes between entering and circulating flows are modified. This can be attributed to curved paths of entering flows forced to merge into lanes physically separated, as well as to spiral lines and raised lane separators on the ring requiring drivers to choose
* Corresponding author. Tel.: +39-091-23899718; fax: +39-091-487068. E-mail address: [email protected]
© 2012 The Authors. Published by Elsevier Ltd. Selection and/or peer-review under responsibility of SIIV2012 Scientific Committee Open access under CC BY-NC-ND license.
their direction before entering the intersection. On the basis of these considerations the evaluation of capacity and operational performances at turbo-roundabouts can result more complex compared to traditional roundabouts.
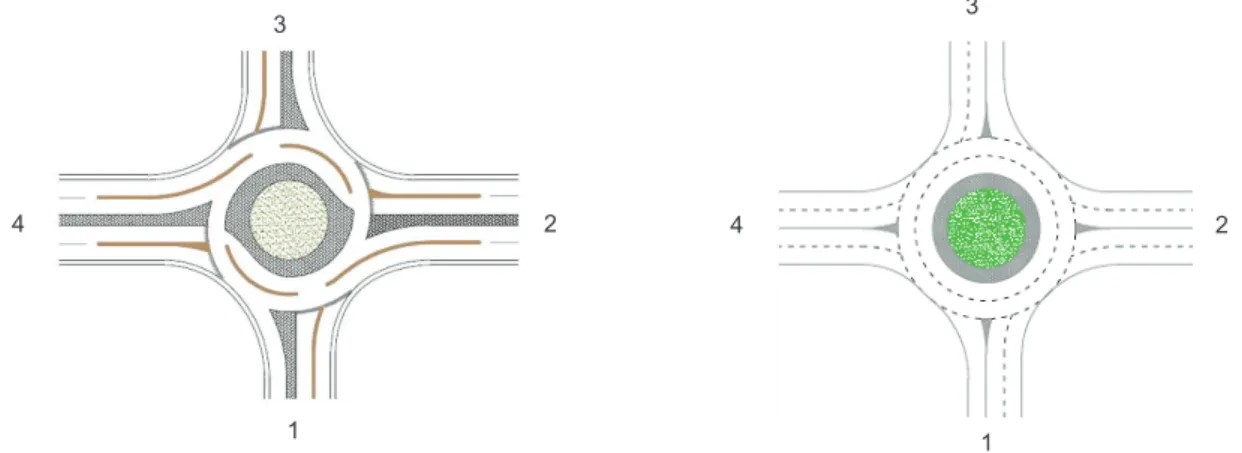
Despite the subject has already been discussed in technical literature, in this paper we intend to assess the convenience (in terms of operational performances) between basic turbo-roundabouts and double-lane roundabouts; this objective has been aimed keeping consistent assumptions on the arrival process of circulating streams and entry capacity models founded on the gap-acceptance theory. The performance analysis of basic turbo-roundabouts and double-lane roundabouts was carried out by applying the capacity formula developed by Hagring [1] to the schemes being compared. The convenience of the compared intersections was estimated in terms of delay suffered by entering vehicles, considering its relation to the level-of-service. Figure 1 shows the schemes of basic turbo-roundabout and standard double-lane roundabout here examined to compare performances. Only to simplify the exposition, in relation to the configurations chosen for the two schemes, legs 2 and 4 will be hereafter referred to as major entries and legs 1 and 3 as minor entries, implicitly assuming a hierarchy between the two roads reaching the intersection.
Fig. 1. (a) basic turbo-roundabout; (b) double-lane roundabout
2.Basic concepts on capacity models at roundabouts
Fundamental capacity methods for two-way-stop-controlled intersections can represent a foundation for evaluating roundabouts (and turbo-roundabouts) operational performances. Very briefly capacity analysis at unsignalized intersections depends on the interaction between vehicles on major streams having priority and vehicles on the stop controlled (or minor) streams. Linear or exponential empirical regression and gap acceptance models are currently used to describe this interaction and to develop this type of analysis.
Linear or exponential empirical regression models require a wide data collection and are based on traffic volumes observed during time intervals of limited duration appropriately chosen in oversaturated conditions (or in sites with continuous queuing). Driver behaviour, as well as geometric design features, can create variation in the data; thus, to develop an appropriate model, each traffic pattern and/or geometric situation have to be observed.
In a gap acceptance model, drivers on the minor (or entering) stream are required to select an acceptable gap on the major (or circulating) stream in order to perform the desired manoeuvres; the critical gap on which the theory is founded is represented by a distribution of values due to the variability of driver behaviour. According to Tanner [2], from the point of view of the traffic on minor road, traffic on the major road forms alternately gaps and blocks; during a block formed by bunched vehicles, each of which is separated by a minimum gap, no vehicles can enter the major stream. Vehicles are able to enter the major stream only when the gap after the last
3 4 2 1 2 4 1 3
vehicle of the block is equal to (or greater than) the critical gap. The evaluation of arrival headways in opposing stream is fundamental to model gap acceptance process and then to estimate capacity and performances at roundabouts and other unsignalized intersections. Whatever capacity model based on the gap-acceptance theory requires to specify the probability distribution of headways between vehicles in major stream (or in circulating traffic flows at roundabouts, where entering vehicles look for and accept gaps in circulating streams). An appropriate choice for the intersections performing multiple turning movements is to adopt, by manoeuvre type, capacity models homogeneous each other, namely obtained by assuming the same arrival headway distribution in major stream. With reference to the case where a major stream uses only one lane and hampers entering manoeuvres from a minor road, Table 1 shows the best-known probability density functions of arrival headway distributions and the corresponding capacity models at unsignalized intersections.
Table 1. Headway probability density functions and capacity models at unsignalized intersections
Headway Probability density function Gap-acceptance function Entry capacity
)
f(W n(W) C Q f³n(W)f(W)dW
0 c e Negative Exponential Distribution – M1
) exp( ) f(W O OW 3600 QC O Step function [3][4] ) T exp( 1 ) T exp( C f c e O O O
Linear function [5][6] exp( T )
T 3600
C 0
f
e O
Shifted Negative Exponetial Distibution – M2
>
O W'@
W!' O W) exp ( ) f( C C Q 3600 Q ' O Step function>
@
) T exp( 1 ) (T exp Q C f c c e O ' O Linear function exp
>
(T )@
T 3600
C 0
f
e O '
Cowan’s Distibution – Dicotomic Shifted Negative Exponetial Distibution – M3
' W M W) 1 f(
>
O W'@
W!' O M W) exp ( ) f( C C Q 600 3 Q ' M O Step function [2]>
@
) T exp( 1 ) (T exp Q C f c c e O ' O M Linear function [7]>
@
f 0 c e T ) (T exp Q C O ' O M Note: O=scale parameter where the conflicting flow rate (Qc) is expressed in pcu/h;' the average intrabunch headway [s] or minimum headway between vehicles moving along the opposing lane; Tc :Critical gap [s]; Tf : Follow-up time, [s];
2 T
T f
0 c
T [s].
The exponential arrival headway distribution models are known as negative exponential (M1), shifted negative exponential (M2) and shifted negative bunched exponential (M3); the shifted negative bunched exponential distribution was introduced by Cowan [8][9] and was adopted by several authors [7][8][11]. Hagring [1] derived the capacity of a minor stream crossing or merging independent major streams, each having a Cowan’s M3 headway distribution. Cowan’s M3 headway distribution explicitly takes into account the number of bunched
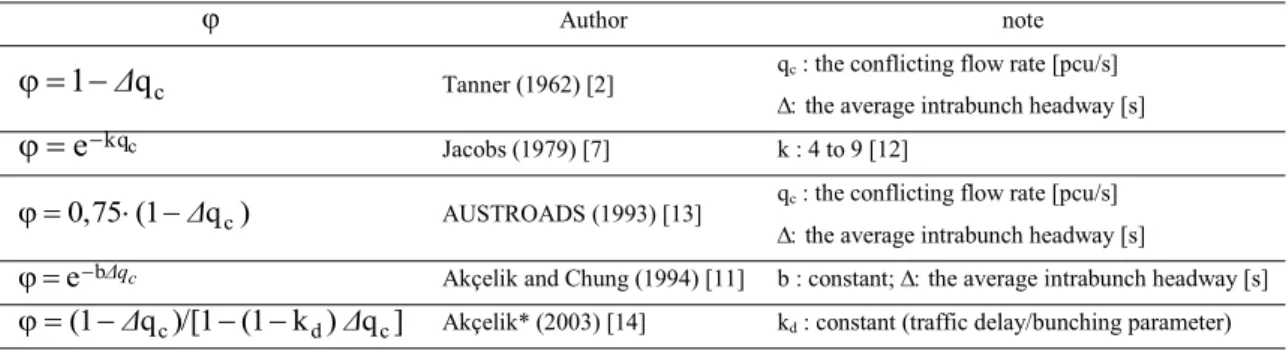
vehicles through the M parameter representing the proportion of free vehicles. Table 2 shows bunching models estimating M parameter as formulated by several Authors.
Table 2. Usual bunching models estimating M parameter
M Author note
c
q
1
Δ
M
Tanner (1962) [2] qc : the conflicting flow rate [pcu/s]' the average intrabunch headway [s] c kq
e
M
Jacobs (1979) [7] k : 4 to 9 [12] ) q (1 0,75 Δ cM AUSTROADS (1993) [13] qc : the conflicting flow rate [pcu/s]
' the average intrabunch headway [s]
ebΔqc
M Akçelik and Chung (1994) [11] b : constant;' the average intrabunch headway [s] ] q ) k (1 )/[1 q (1Δ c d Δ c
M Akçelik* (2003) [14] kd : constant (traffic delay/bunching parameter)
* this is the expression as introduced in aaSIDRA 2.1
3.Capacity models for basic turbo-roundabouts
Up-to-day literature offers few examples of capacity models for turbo-roundabouts because of recent introduction of this type of intersection on the international scene. Fortuijn and Harte [15] proposed a linear empirical regression model, known as Meerstrooksrotonde-verkenner, for estimating entry capacity at turbo-roundabouts. To take into account the traffic split among circulating lanes Fortuijn modified the Bovy linear regression model [16], developed in its turn to evaluate entry capacity at traditional roundabouts.
Differently from the capacity model proposed in [15], Mauro and Branco [17] adapted to turbo-roundabouts the Brilon capacity model [18], based on the theory of the gap-acceptance; moreover, for comparing compact multilane roundabouts and turbo-roundabouts, they particularized the Brilon capacity model assuming the same number of entering and circulating lanes (setting them equal to 1). Giuffrè et al. [19] proposed a criterion for evaluating entry capacity at turbo-roundabouts based on existing formulations for unsignalized intersections founded on the gap-acceptance theory. In particular, they adopted the Brilon formula for estimating right and left lane capacity from major entries and to estimate right lane capacity from minor entries. Harders capacity formula [3] was assumed, instead, for left lane capacity from minor entries; in this case the conflicting flow in front of the subject entry was assumed equal to the sum of traffic circulating flow in the outer lane and in the inner lane at the circulatory carriageway. Further models can be considered to evaluate entry capacity; among them, as said in the introduction section, Hagring [1] derived a more general capacity formula for multi-lane intersections able to take into account behavioural and traffic flow parameters specified by conflicting streams. According to Hagring [1] the entry lane capacity is obtained as the capacity of a minor stream crossing or
merging independent major streams, each having a Cowan’s M3 headway distribution as follows:
)
3600
exp(
1
)
(
3600
exp
3600
-3600
3600
3600
, , , , , , f,m m m cm m c m l c,l l l cl l c l k c,k k j j c j j c j eT
Q
Q
Δ
T
Q
Q
Q
Δ
Q
Q
C
'
»
¼
º
«
¬
ª
'
¸
¹
·
¨
©
§
'
¦
¦
¦
M
M
M
(1) (1) where:Ce: entry lane capacity [pcu/h];
MB: Cowan’s M3 parameter representing the proportion of free traffic within the major stream;
Qc,_: conflicting traffic flow [pcu/h]; Tc,_ : critical gap for circulatory lane [s];
Tf,_ : follow-up time, [s];
'B: minimum headway of circulating traffic [s];
j, k, l, m: indices for conflicting lanes (differing in mathematical form, but repeatedly representing the same lanes).
It is well known that in the evaluation of entry capacity at unsignalized intersections is necessary to take account of bunched vehicles that can cause a drastic reduction in entry capacity when conflicting traffic flows increase, as described by a shifted negative bunched exponential distribution (M3). Moreover, at a basic turbo-roundabout, patterns of conflict both with only one antagonist traffic stream (right and left lanes at major entries; right entry lane at minor entries) and with two antagonist traffic streams (left lane at minor entries) are coexisting. So applications of the Hagring model [1] can result appropriate to evaluate entry lane capacity at
turbo-roundabouts: the Hagring model allows to assume, indeed, a Cowan’s M3 headway distribution in each
conflicting stream along circulating lanes, taking into account differentiated values (lane-by-lane) for behavioural parameters (Tc, Tf), minimum headway (') and antagonist traffic flow moving on one or two lanes in the circulatory carriageway.
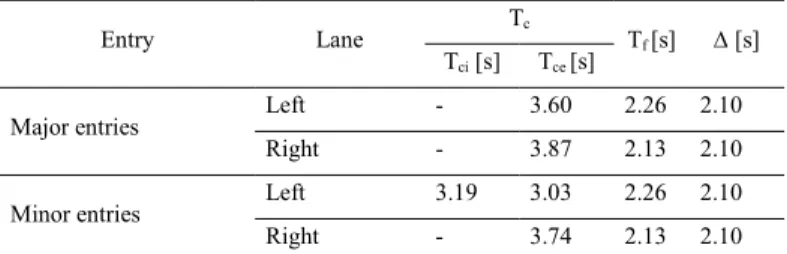
Basing on the above considerations, Hagring model was applied in order to compare operational performances between intersections in Figure 1. With regard to behavioural parameters, estimates of Tc and Tf for basic roundabouts were obtained by Fortuijn [20] by means of experimental observations carried out on turbo-roundabouts operating in the Netherlands. Collected values for critical gap and follow-up time were differentiated by leg (major or minor entries) and by lane (right or left entry lane). Only for the left entry lane at minor entries, Fortuijn [20] found two critical gap values: Tci for the inner circulating lane and Tce for the outer circulating lane. Starting from data reported by Fortuijn [20], in the present paper we assumed gap acceptance parameters as shown in Table 3. Since Tc values were obtained in different sites, each of them with a proper sample size, a weighted mean of these parameters was considered. According to literature the parameter ' was assumed equal to 2.10 s.
Table 3. Gap acceptance parameters found by Fortuijn (2009)
Entry Lane Tc Tf [s] '[s]
Tci [s] Tce [s]
Major entries Left - 3.60 2.26 2.10
Right - 3.87 2.13 2.10
Minor entries Left 3.19 3.03 2.26 2.10
Right - 3.74 2.13 2.10
The Hagring model in equation (1) was specified both in relation to the antagonist circulating flow values (Qc,i or Qc,e) faced by drivers coming from the considered entry approach and in relation to Tc, Tf and ' values. The Tanner bunching model [2] was used for estimating M parameter. To evaluate entry capacities the following assumptions were made.
Right-lane capacity and left-lane capacity of major entries (legs 2 - 4) and right-lane capacity of minor entries (legs 1 - 3) were estimated as a function of the only one circulating traffic flow in the outer circle lane in front of the considered entry approach (Qc,e); they were computed by the following equation:
¸¸ ¹ · ¨¨ © § ¸¸ ¹ · ¨¨ © § ' ¸¸ ¹ · ¨¨ © § ' f e c c e c e c e c e T Q T Q Q Q C 3600 exp 1 3600 exp 3600 1 , , , , (2)Left-lane capacity of minor entries (entries 1 - 3) was considered, instead, as a function of both circulating traffic flows in the outer (Qc,e) and in the inner circle lane (Qc,i) and was computed by the following equation:
¸¸ ¹ · ¨¨ © § ¸¸ ¹ · ¨¨ © § ' ' ¸¸ ¹ · ¨¨ © § ' ¸¸ ¹ · ¨¨ © § ' f i c e c i c i c e c e c i c e c i c e c e T Q Q T Q T Q Q Q Q Q C 3600 exp 1 3600 3600 exp 3600 1 3600 1 , , , , , , , , , , (3)
Notations in equations (2) and (3) have the same meaning as in equation (1). It should be noted that for calculating the left-lane capacity of entries 1 and 3 critical gap values Tc,i and Tc,e are different for the inner and the outer circle lane; so values found by Fortuijn [20] were applied as reported in Table 3.
4.Capacity models for double-lane roundabouts
Literature presents several operational models used for analysing performances at roundabouts. Harders [3] developed one of the first models, afterwards introduced into the Highway Capacity Manual [4]. Brilon et al. [18], as adopted by the German Highway Capacity Manual [21], used the Tanner capacity equation [2] for uncontrolled intersection in a form adjusted to needs of roundabout analysis and expressed the entry capacity for roundabouts with ne entry lanes and nc circulating lanes, by the following equation:
»
»
¼
º
«
«
¬
ª
¸¸
¹
·
¨¨
©
§
'
¸¸
¹
·
¨¨
©
§
'
2
3600
exp
3600
1
3600
c c f f e c c eT
T
Q
T
n
n
Q
C
c n (4) where the symbols have the usual meaning. In more recent studies, Brilon [22] focused on the empirical regression of on-field experimental data and reached a simplified form of the previous capacity equation derivedfrom the Siegloch’s capacity equation [5], given as:
»
»
¼
º
«
«
¬
ª
¸¸
¹
·
¨¨
©
§
2
3600
exp
3600
c c f f eQ
T
T
T
n
C
(5)Depending on the lane configuration of roundabout, Brilon [22] suggested for a compact double-lane roundabout the following values: ne = 1.14; Tc = 4.3 s; Tf = 2.5 s and for a large double-lane roundabout, instead, the following values: ne = 1.6; Tc = 4.1 s; Tf = 3 s. Moreover the eq. (5) is valid for a circulating traffic volume below 1,600 pcu/h for a double-lane compact roundabout and 2,500 pcu/h for a double-lane large roundabout.
More recently, further adaptations of Siegloch’s model were proposed in [6] for evaluating capacity of right and left lanes at a double-lane roundabout entry opposed by two conflicting lanes:
c r eQ
C
3
,1
.
130
exp
0
.
7
10
(6) c l eQ
C
3
,1
.
130
exp
0
.
75
10
(7)where Qc has the usual meaning and where:
Ce,r : capacity of the right entry lane [pcu/h]; Ce,l : capacity of the left entry lane [pcu/h].
In this paper a particular operational scheme was hypothesized for entering manoeuvres at the double-lane roundabout. According to adopted assumptions, entering vehicles face one or two circulating streams depending on their entry lane. In detail drivers coming from the right entry lane get into the outer lane of the circulatory roadway, only interacting with the outer circulating stream; conversely, drivers coming from the left entry lane get into the inner circulating lane, crossing the outer circulating stream and merging the inner one.
It should be noted here that at traditional roundabouts drivers do not have to preselect their entering lane related to their destination (although that is desirable); thus it was considered appropriate to determine the whole entry approach capacity simply adding both capacities of each entry lane. Similarly to what considered for turbo-roundabouts, circulating traffic flows at double-lane roundabouts were modelled according to the Cowan’s M3
headway distribution; so entry lane capacities were calculated separately by the Hagring model [1]. In this view, Hagring model was adapted to the case of a single antagonist stream (Qc,e) for calculating capacity of the right entry lane, as expressed by eq. 2, and to the case of two antagonist traffic streams (Qc,i; Qc,e) for calculating capacity of the left-entry lane, as expressed by eq. 3. Thus, also for double-lane roundabouts the circulating traffic flow was splitted in two streams, assuming that the outer one consists in vehicles leaving the intersection at the exit following the subject entry.
Considering that the manoeuvre schemes described for a double-lane roundabout are analogous to schemes occurring at the minor road of a basic turbo-roundabout, it was chosen to adopt for Tc and Tf the values already shown in Table 3 for right and left lanes at minor roads (see entries 1 and 3 in Figure 1). The parameter ' was also in the case of roundabout assumed equal to 2.10 s according to literature.
5.Comparing basic turbo-roundabout and double-lane roundabout
Operational performances of schemes in Figure 1 were examined in view to obtain a choice criterion for a given distribution of traffic demand. Comparison of the two types of intersection was inspired by the methodological approach developed by Mauro and Branco [17] in order to assess benefits of turbo-roundabouts against compact multilane roundabouts. This approach was adopted here in order to obtain suitability domains in undersaturated conditions for the selected intersections and to evaluate operational benefits resulting from the choice of one or the other intersection scheme. In this research we compared geometric patterns of intersection slightly different from those considered by the cited Authors. Different assumptions regarding the conflicting flows (namely those faced by left turning vehicles from minor roads) and capacity models were also made; moreover, the suitability domains for the selected schemes were obtained estimating the control delay instead of the degree-of-saturation.
To exemplify operating conditions that can occur at the intersection schemes examined in this research, three situations of traffic (corresponding to three matrices of traffic flow percentages) were analysed. In this manner it was possible to explore the influence on operations of different traffic patterns:
x in the case (a) percentages of traffic flow turning from a leg to any other leg were assumed balanced;
x in the case (b) through movements from and to major entries were assumed to be prevailing on the other turning movements; left and right turning movements from minor to major entries were assumed to be prevailing on through movements from and to minor entries;
x the case (c) is analogous to case (b) except for percentages of left and right turning movements from minor to major entries for which percentage rates are now inverted.
The vector of traffic demand [Qe1; Qe2; Qe3; Qe4] was assumed to have equal values both for each minor entry [Qe1 = Qe3] and for each major entry [Qe2 = Qe4], so that “balanced” conditions at entries were represented. Moreover, all cases where (Qe2+Qe4)<(Qe3+Qe1) were excluded from representation of suitability domains.
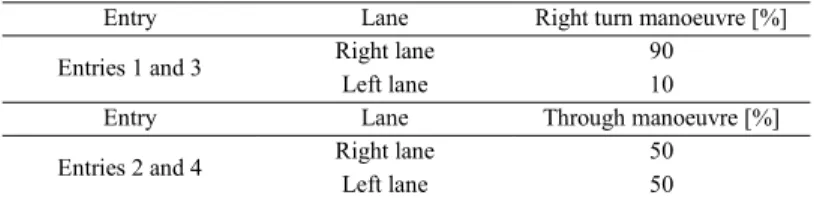
Further assumptions were related to the entry lane selection percentages of traffic flows performing different manoeuvres from legs. At basic turbo-roundabouts right turning movements from minor entries and through
movements from major entries can be performed whichever entry lane users select. Table 4 shows the percentages of right turn manoeuvres from entries 1-3 and of through manoeuvres from entries 2-4 here assumed.
Table 4. Lane selection percentages by manoeuvre at basic turbo-roundabout
Entry Lane Right turn manoeuvre [%]
Entries 1 and 3 Right lane 90
Left lane 10
Entry Lane Through manoeuvre [%]
Entries 2 and 4 Right lane 50
Left lane 50
The comparison between intersections in Figure 1 was performed by comparing the control delay for the whole intersection, as weighted mean value of the mean control delay at each entry lane:
¦ ¦ 4 1 4 1 i ei i i ei Q Q d d (8)
where di is the mean control delay at each entry lane icomputed as a function of entry lane capacity Ce,i and the corresponding degree-of-saturation (Qe,i/Ce,i) by the equation 17-38 in [4]. Calculation of di presents no problems in the case of turbo-roundabouts, where pre-selection allows to evaluate the degree-of-saturation of each entry lane; in the case of double-lane roundabout di is the mean control delay at each entry computed by the equation 17-38 in [4] as a function of the whole entry capacity and the corresponding degree-of-saturation. Figure 2 shows the suitability domains (in case of undersaturation) for the three considered traffic conditions. The yellow area is the double-lane roundabout suitability area and corresponds to case in which delays at double-lane roundabouts are less than 50 percent of those that users suffer at turbo-roundabouts under the same traffic volumes; in turn, the blue area corresponds to case in which delays at turbo-roundabouts are less than 50 percent of those that users suffer at double-lane roundabouts. In all cases the area in green represents a situation in which neither suitability of roundabout nor suitability of turbo-roundabout (as above specified) is reached and so a significant benefit in terms of delay cannot be deducted in favour of the turbo-roundabout or the double-lane roundabout.
6.Conclusion
The paper proposes applications of the Hagring model to evaluate entry capacity at turbo-roundabouts where movements both with only one antagonist traffic stream and with two antagonist traffic streams coexist. The
Hagring model allows to assume, indeed, a Cowan’s M3 headway distribution in each conflicting stream along circulatory lanes, accounting by this way of bunched vehicles that can cause a drastic reduction in entry capacity when conflicting traffic flows increase; it also accounts for differentiated values (lane-by-lane) of behavioural parameters (Tc, Tf), minimum headway (') and antagonist traffic flow moving on one or two lanes in the circulatory carriageway. In view of a consistent comparison, the Hagring model was also specified for evaluating entry capacity at double-lane roundabouts.
Suitability domains for the intersections in Figure 1 were obtained using control delay as comparison criterion; results of the performed comparison allow to affirm that advantages of (basic) turbo-roundabouts in terms of performance levels with respect to double-lane roundabouts are not obvious, but depend on traffic situations:
Case a O/D 1 2 3 4 1 0 0.33 0.33 0.33 2 0.33 0 0.33 0.33 3 0.33 0.33 0 0.33 4 0.33 0.33 0.33 0 Case b O/D 1 2 3 4 1 0 0.30 0.05 0.65 2 0.05 0 0.05 0.90 3 0.05 0.65 0 0.30 4 0.05 0.90 0.05 0 Case c O/D 1 2 3 4 1 0 0.65 0.05 0.30 2 0.05 0 0.05 0.90 3 0.05 0.30 0 0.65 4 0.05 0.90 0.05 0
Note: total balanced main flows are equal to Qe2+Qe4; total balanced minor flows are equal to Qe1+Qe3 Fig. 2. Examples of suitability domains in undersaturated conditions
x in traffic situations where origin/destination matrix is balanced (Fig. 2, case a), double-lane roundabouts perform better than turbo-roundabouts especially when high traffic flows enter the circulatory carriageway from major road and low traffic flow enter from minor road; increasing traffic flows from minor road, double-lane roundabouts still perform better than turbo-roundabouts if traffic flow coming from major road ranges within middle values. For entering traffic flow ranging from low to lower-middle values roundabout and turbo-roundabout perform in a similar way without clear benefits of one over the other;
x in traffic situations where movements directed to major road are prevalent over the other turning movements (Fig. 2, cases b and c), turbo-roundabouts can provide operating conditions advantageous compared to double-lane roundabouts under the same entering traffic volumes. In these cases, in particular, delays are much shorter for turbo-roundabouts than for double-lane roundabouts when high traffic flows enter from major road and low traffic flow enter from minor road; increasing traffic flows from minor road, turbo-roundabouts still perform better than double-lane roundabouts if traffic flow coming from major road ranges within middle (or relatively high) values. For entering traffic flows ranging from low to lower-middle values the two intersections offer equivalent performances from the particular comparison point of view. Note that under the condition in which all the entries are undersaturated, case c allows significantly larger minor traffic flows than case b; it can be explained considering that in case c right turning movements from minor road are prevalent on the others.
Obviously, the obtained results are influenced by the assumptions adopted in the analyses, especially with regard to the user behaviour at turbo-roundabouts, for which few experimental data are up to now available. Nevertheless, within the boundaries of a theoretical study as the present one, the performed comparisons can be still valid, if considered in relative terms, and usefully inform us about the convenience in choosing basic turbo-roundabout rather than double-lane turbo-roundabout.
References
[1] Hagring, O. (1998). A further generalization of Tanner's formula. Transportation Research Part B: Methodological, 32, 423-429. [2] Tanner , J.C. (1962). A theoretical analysis of delay At An Uncontrolled Intersections. Biometrika, 49, 163-170.
[3] Harders, J. (1968). Die Leistungsfaehigkeit nicht signal geregelter staedtischer Verkehrsknoten (The capacity of unsignalized urban intersections). Schriftenreihe Strassenbau und Strassenverkehrstechnik, 76.
[4] Highway Capacity Manual (2000). Special Report 209. Washington D.C., U.S.: Transportation Research Board.
[5] Siegloch, W. (1973). Die Leistungsermittlung an Knotenpunkten ohne Lichtsignalsteuerung (Capacity calculations for unsignalized intersection). Schriftenreihe Strassenbau und Strassenverkehrkehrstechnik, 154.
[6] Rodegerdts, L., et al. (2010). Roundabouts: An Informational Guide (2nd ed.). Washington D.C., U.S.: NCHRP Report 672. [7] Jacobs, F. (1979). Capacity calculations for unsignalized intersections (Technical report in German). Institute fur StarEenEau und Verkehrswesen, University Stuttgart.
[8] Cowan, R.J. (1975). Useful headway model. Transportation Research, 9(6), 371-375.
[9] Cowan, R.J. (1987). An extension of Tanner’s results on uncontrolled intersections. Queuing Systems, 1, 249-263.
[10] Troutbeck, R. J. (1990). Traffic Interactions at Roundabouts. In proceedings of the 15th Australian Road Research Board Conference, 15(5), 17-42, Darwin, Northern Territory, Australia.
[11] Akcelik, R., & Chung, E. (1994). Calibration of the bunched exponential distribution of arrival headways. Road and Transport Research, 3(1), 42-59.
[12] Wu, N. (2001). A Universal procedure for capacity determination at unsignalized (priority controlled) intersections. Transportation Research B, 35, 593-623.
[13] AUSTROADS (1993). Roundabouts. Guide to traffic engineering practice (part. 6). Austroads, Sydney, Australia.
[14] Akcelik, R. (2003). Speed-flow and bunching relationships for uninterrupted flows. In proceedings of the 25th Conference of Australian Institutes of Transport Research, Adelaide, Australia.
[15] Fortuijn, L.G.H., & Harte, V.F. (1997). Multi-lane roundabouts: exploring new models. Traffic engineering working days 1997, CROW, Ede, The Netherlands.
[16] Bovy, H., Dietrich, K., & Harmann, A. (1991). Guide Suisse des Giratoires. Lausanne, Switzerland, p. 75 (see summary: Straße und Verkehr, 3, 137–139).
[17] Mauro, R., & Branco, F. (2010). Comparative analysis of compact multilane roundabouts and turbo-roundabouts, Journal of Transportation Engineering, 136(4), 316-322.
[18] Brilon, W., Wu, N., & Bondzio, L. (1997). Unsignalized intersections in Germany – A state of the art 1997. In proceedings of the 3rd International Symposium on Intersections without traffic signals (pp. 61-70), Portland, Oregon, U.S.
[19] Giuffrè, O., Guerrieri, M., & Granà, A. (2009). Evaluating capacity and efficiency of turbo-roundabouts. In proceedings of the TRB 2009 Annual Meeting, Washington D.C., U.S.
[21] FGSV (2001). Handbuch für die Bemessung von Straßenverkehrsanlagen (Handbook for assessing road traffic facilities - German Highway Capacity Manual). Forschungsgesellschaft für Straßen- und Verkehrswesen (Hrsg.), No. 299. FGSV Verlag GmbH, Köln, Germany.
[22] Brilon, W. (2005). Roundabouts : A State of the Art in Germany. In proceedings of the National Roundabout Conference 2005, Vail, Colorado, U.S.