Cancer Pathways
.
White Rose Research Online URL for this paper:
http://eprints.whiterose.ac.uk/148841/
Version: Accepted Version
Proceedings Paper:
Kurniati, AP orcid.org/0000-0002-4747-1067, McInerney, C
orcid.org/0000-0001-7620-7110, Zucker, K et al. (3 more authors) (2020) A Multi-level
Approach for Identifying Process Change in Cancer Pathways. In: Di Francescomarino, C,
Dijkman, R and Zdun, U, (eds.) Lecture Notes in Business Information Processing.
Business Process Management Workshops 2019, 01-06 Sep 2019, Vienna, Austria.
Springer , Cham, Switzerland . ISBN 978-3-030-37452-5
https://doi.org/10.1007/978-3-030-37453-2_48
© Springer Nature Switzerland AG 2019. This is an author produced version of a
conference workshop proceedings published in Lecture Notes in Business Information
Processing. Uploaded in accordance with the publisher's self-archiving policy.
[email protected] https://eprints.whiterose.ac.uk/ Reuse
Items deposited in White Rose Research Online are protected by copyright, with all rights reserved unless indicated otherwise. They may be downloaded and/or printed for private study, or other acts as permitted by national copyright laws. The publisher or other rights holders may allow further reproduction and re-use of the full text version. This is indicated by the licence information on the White Rose Research Online record for the item.
Takedown
If you consider content in White Rose Research Online to be in breach of UK law, please notify us by
cancer pathways
Angelina Prima Kurniati1,2,* [0000-0002-4747-1067], Ciarán McInerney1 [0000-0001-7620-7110], Kieran Zucker3 [0000-0003-4385-3153], Geoff Hall3 [0000-0002-8864-5932], David Hogg1
[0000-0002-6125-9564], Owen Johnson1 [0000-0003-3998-541X] 1 School of Computing, University of Leeds, UK LS2 9JT 2 School of Computing, Telkom University, Bandung, Indonesia 40257 3 School of Medicine, University of Leeds, UK LS2 9JT; Leeds Teaching Hospitals Trust,
Leeds, UK LS9 7TF
* email: [email protected]
Abstract. An understudied challenge within process mining is the area of
pro-cess change over time. This is a particular concern in healthcare, where patterns of care emerge and evolve in response to individual patient needs and through complex interactions between people, process, technology and changing organi-sational structure. We propose a structured approach to analyse process change over time suitable for the complex domain of healthcare. Our approach applies a qualitative process comparison at three levels of abstraction: a holistic tive summarizing patient pathways (process model level), a middle level perspec-tive based on activity sequences for individuals (trace level), and a fine-grained detail focus on activities (activity level). Our aim is to identify points in time where a process changed (detection), to localise and characterise the change (lo-calisation and characterisation), and to understand process evolution (unravel-ling). We illustrate the approach using a case study of cancer pathways in Leeds Cancer Centre where we found evidence of agreement in process change identi-fied at the process model and activity levels, but not at the trace level. In the experiment we show that this qualitative approach provides a useful understand-ing of process change over time. Examinunderstand-ing change at the three levels provides confirmatory evidence of process change where perspectives agree, while con-tradictory evidence can lead to focused discussions with domain experts. The ap-proach should be of interest to others dealing with processes that undergo com-plex change over time.
Keywords: process mining, cancer pathways, process change, concept drift,
multi-level process comparison
1
Introduction
In general, process-mining research projects work with data collected over months or years and start with the assumption that the processes are largely unchanged during the period of study. In reality, there are many reasons why both the process and the data about that process might change over time. This is a particular concern in healthcare,
where patterns of care emerge and evolve in response to individual patient needs and through complex interactions between people, processes, technology and changing or-ganisational structures. Arguably many healthcare processes are in a constant state of flux and evolution. A better understanding of how to identify and model process change over time is important if process mining is to be applied effectively within healthcare.
The changing nature of processes over time has been termed ‘concept drift’ by the machine learning community [1]. It has been adopted in the process mining community and there is a growing literature exploring potential new approaches [2]–[4]. Three challenges when dealing with concept drift are: (1) change point detection, which aims to detect that a process change has taken place and the time where this occurred; (2) change localisation and characterisation, which aims to characterise the nature of a change and identify the changed elements of a process, and (3) change process evolu-tion, which aims to unravel the more gradual evolution of a process over time periods. The standard approach to analysing process changes over time is to construct process models from different time periods in a large dataset and compare them to identify changes. A common application for comparing processes is for conformance checking, where a reference model is compared to the real behaviour recorded in the event log [5]. Partington et al. [6] proposed an approach for comparison by defining points for comparison with various metrics. However, Partington et al. was concerned with dif-ferences in process between different clinical settings so their methods are not directly applicable to analysing concept drift. Furthermore, Partington et al.'s approach required the selection of specific clinical metrics that vary between different clinical domains. Bolt et al. [7] suggested another process-comparison approach by comparing frequen-cies and percentages of the activities in the logs. This facilitated detailed comparison between each activity in two logs, but not between processes. Both of Partington et al. and Bolt et al. works are not directly related to process change analysis, but can be used for analysing concept drift or process change over time.
In our exploratory study, we developed an approach to discovering and analysing changes over time in complex longitudinal healthcare data. Our case study examined process data related to the treatment of endometrial cancer over a 15 year period (2003-2017) in one of the UK's largest cancer centres (Leeds Cancer Centre) with a specific focus on the routes to diagnosis. Process mining has been used and shown promising results to support process analytics in Oncology [8]. Our event logs were drawn from the Electronic Healthcare Record (EHR) system of Leeds Teaching Hospital NHS Trust. In earlier work with this data [9], [10], we had assumed the processes were largely unchanged during the time period but had not explicitly tested this. We were aware that the time period was long, that the system, people and organisation had evolved and changed over time but we were not aware of specific process changes be-fore we commenced the investigation. Our experience with applying process mining on MIMIC-III, an open-access database [11], [12] showed that a change in the system af-fected the discovered process. The Leeds EHR system, Patient Pathway Manager Plus (PPM+) [13], [14], was developed in-house and we were fortunate in having access to the software developers of the system, the training team and clinical staff and senior clinicians involved in the process. Changes detected through our multi-level process
change analysis method could therefore be evaluated and explored with staff who help identify in potential causal links between changes detected in the data and in practice.
2
Method
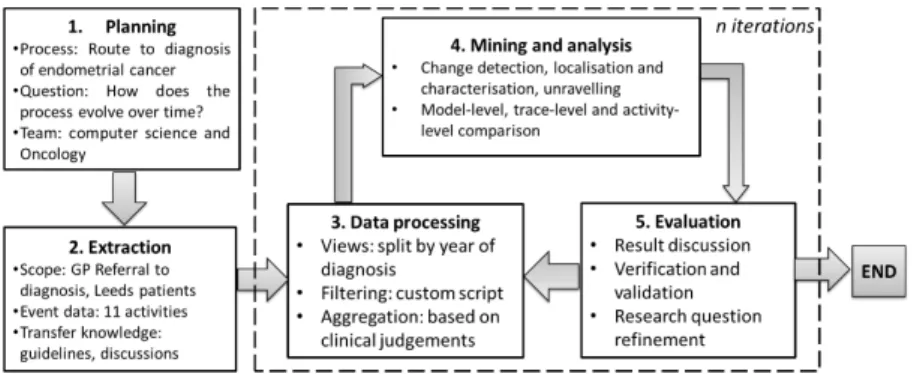
2.1 General MethodOur structured approach combined the well-established PM2 process mining method [15] with concept drift analysis [4]. Bose et al. [4] proposed to analyse process change by process change detection, localisation and characterisation, and unravelling process evolution. Our proposed approach applies process comparison at three different levels: process model, trace, and activity levels. We applied our approach to analyse the route to diagnosis of endometrial cancer. Fig 1 shows our general methodology.
Fig. 1. General methodology for multi-level process change analysis
Planning was done by defining business process, research questions, and team members in this study. The following definitions describe the main components of our study.
Definition 1 (Event logs and traces). An event log E is a set of events (c, a, t). An
event refers to an activity a which happened at a timestamp t and is related to a partic-ular case c. A trace T is a sequence of events that happened to a case c ordered by timestamp t, where T E. In this study, a case represents a patient having a set of events that happened between the timestamps of referral and diagnosis of endometrial cancer.
Definition 2 (Sub-logs). A log S is a subset of an event log E based on a
setting criteria. The subsetting should be done such that a trace is grouped in to a sub-log with no duplication in other sub-sub-logs. For this study, the subsetting was done based on the year of timestamp t where the activity label a is Diagnosis. The event log was split into sub-logs based on the year of diagnosis of each patient. There are clearly many subsetting options that could be adopted.
Definition 3 (Process models). A process model M is a directed graph modelling
the traces T in the event log E. Process model M draws activities a as nodes and the possible paths p between nodes as arcs from one node to another. Standard process mining algorithms can be used to discover process models with additional components, such as frequency of nodes and arcs as the occurrence of a and p in E, respectively.
2.2 Process Change Analytics
Sub-logs were analysed at the process-model, trace, and activity levels to describe the behaviour of the processes of interest. A summary of the metrics used at each level is presented in Table 1.
Table 1. Metrics for describing the behaviour of processes at multiple levels
Level Metrics Description
Model Replay fitness The proportion of traces in the log that can be reproduced in the process model.
Precision The proportion of the sequence of events allowed by the model which is not seen in the event log.
Generalisation The proportion of the model to reproduce future sequence of events of the process.
Trace Duration The number of days of the pathway from Referral to Diagnosis. Variant
propor-tion
The proportion of variants in the sub-log that were one of the most frequent variants in the complete log.
Activity Frequency The number of patients having a specific event within one year. Percentage The percentage of patients having a specific event out of all
pa-tients within a year.
Our general process model for the model-level comparison, was built using interactive Data-Aware Heuristics Miner (iDHM) in ProM 6.8 [16] from the complete event log from 2003 to 2017. The iDHM enables an exploration of the parameter space and sev-eral heuristics, and focuses on the gensev-eral pattern based on the most frequent activities. Our model level behaviour was described by the replay fitness, precision and generali-sation [5] of each sub-log to the general model. Our trace-level behaviour was described by durations and variants of the traces in the sub-logs using bupaR [17]. Our activity-level behaviour was described by activity frequency and its percentage in the sub-logs. We then adopted a visual-analytic approach to identifying possible changes by quanti-tatively comparing visualisations of these aforementioned descriptions of process be-haviour.
2.3 Case Study: Route to diagnosis of Leeds patients diagnosed with endometrial cancer during 2003-2017
We examined the route to diagnosis of Leeds patients diagnosed with endometrial can-cer over an extended fifteen year time period. We used an anonymised event log from the PPM+ EHR that had been through significant data cleaning (documented in full in [9]) and extracted events related to the route to diagnosis for endometrial cancer. The route to diagnosis [18] or cancer waiting time [19] is seen as one of the important per-formance indicators in cancer treatment. In the UK, it is monitored by Public Health England and forms a key benchmark for high quality cancer care.
Endometrial cancer is a type of cancer that affects the female reproductive system and is more common in women who have been through the menopause. The most com-mon symptom is unusual vaginal bleeding, which is usually followed by a GP consul-tation and referral to an Oncology specialist (Gynaecologist). The specialist conducts some tests, such as an ultrasound scan, a hysteroscopy or a biopsy. If diagnosed with endometrial cancer, further investigations might be needed to determine the cancer stage [20]. At the Leeds Cancer Centre, all these events have been coded in the PPM EHR since 2003 and should therefore be present in the extracted event log giving a rich data source for process mining of the pathway from GP referral to diagnosis. The PPM EHR includes nine tables relevant to our study and these tables contain broad categories of activity such as Referrals, Admission, and Surgery.
3
Results
3.1 Data extraction and processing
We applied four selection criteria to create the study cohort. Patients were selected if they had i) a legitimate care relationship with Leeds Teaching Hospital NHS Trust (LTHT), ii) a primary diagnosis of endometrial cancer (ICD-10 code C54 or C55), iii) a diagnosis between 2003 and 2017, and iv) a diagnosis of endometrial cancer at max-imum 120 days after referral to an oncology specialty. The last criteria was based on discussion with clinical experts, because a longer time period is implausibly long for the events to be related. Based on those criteria, 943 out of 1126 endometrial cancer patients (84%) were selected in this study. In total, there are 65,200 events selected or 58 events per patient on average.
From those selected patients, we extracted all time-stamped events recorded between GP Referral and Diagnosis, which resulted in 339 different activity types. For the pur-pose of our study, we focus simply on the broad categories of activity represented by the nine tables. We split Admission and Discharge that were from the same table and split out Diagnostic Surgery from the Surgery table. The resulting 11 activities were agreed with clinical co-authors, they are: Referral, Outpatient, Consultation, Admis-sion, Discharge, Investigation, Pathology, Diagnosis Surgery, Multi-Disciplinary Team Review (MDT Review), Diagnosis, and Surgery. The event log contained 7,967 events with the minimum 2, median 6, mean 6.3, and max 12 events per patient.
3.2 Process model comparison
Figure 2 shows the general process model based on process mining of the complete log for the full 15 years. For simplicity, the process model shows the eight most frequent activities and the most-frequent paths between them. The Outpatient, Consultation, and MDT Review activities appeared infrequently and were omitted from the process model to produce the simple diagram as shown in Fig. 2. The Outpatient activity appeared in 149 out of 943 patients (16%), Consultation appeared in 152 out of 943 patients (16%), and MDT Review appeared in 231 out of 943 patients (24%). The general process model
was highly representative of the complete event log (replay fitness = 0.81, precision = 0.83, generalisation = 0.99).
Fig. 2. The directly-follows graph, originally produced by the iDHM plugin in ProM 6.8, shows
process model of the pathway from referral to diagnosis. The pathway flows from left to right, with rectangles represent activities and arrows as flows from one activity to the other. Numbers on the arrows show the number of patients having the activity flows to the other activities.
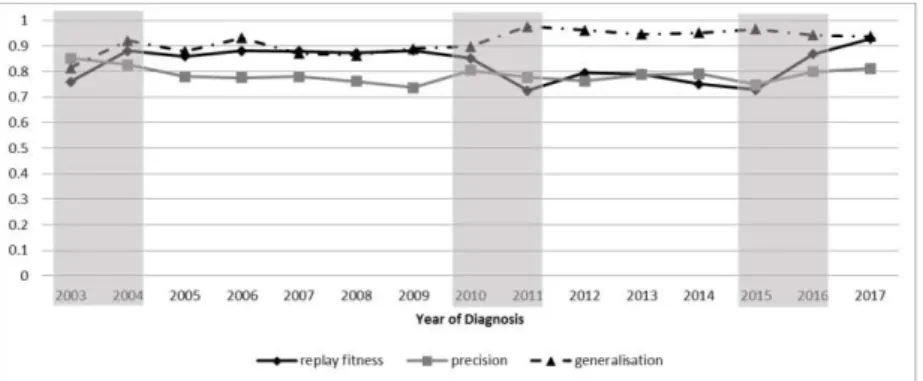
We split the complete event log into 15 sub-logs covering one calendar year each and tested each yearly sub-log for conformance against this general process model. The general process model remained reasonably representative of each yearly sub-log (me-dian [inter-quartile range]: replay fitness = 0.86 [0.10], precision = 0.78 [0.03], and generalisation = 0.93 [0.06]). All measures were similar across years (see Fig. 3). Our qualitative assessment suggest possible changes in 2004 where the replay fitness and generalisation are increased and precision was dropped from the previous year, in 2011 where the trace fitness was dropped while the generalisation increased, and in 2016 where both trace fitness and precision were started to increase. We thus identified three periods of potentially significant change in 2003-2004, 2010-2011 and in 2015-2016.
Fig. 3. Conformance to the general process model over years. The shaded areas show the periods
where change might have occurred at the process model level.
3.3 Trace comparison
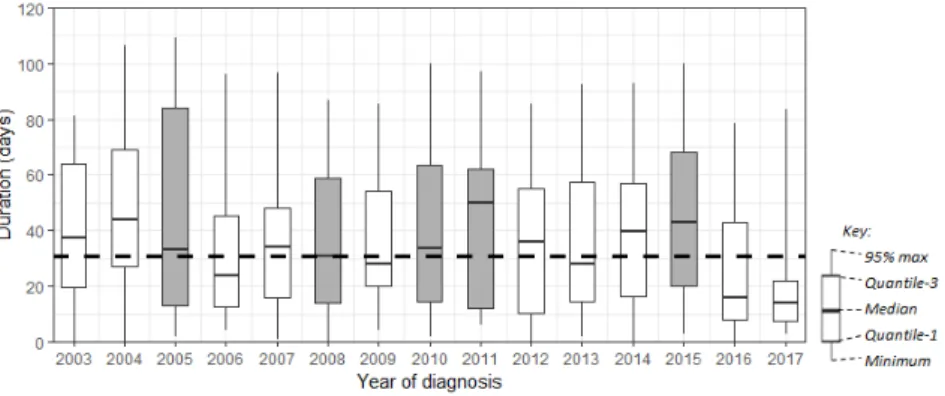
We examined the profile of trace duration from Referral to Diagnosis for each yearly sub-log to produce the box plots in Fig 4. There is no obvious qualitative pattern based on the distribution of the duration, except on the inter-quartile range (IQR). The IQR is generally decreasing across year, with exceptions on 2005 where the IQR increased from 42 to 71 days (68%), on 2008 where the IQR increased from 32 to 45 (39%), on
2010 where the IQR increased from 34 to 49 days (44%), on 2011 where the IQR in-creased from 49 to 50 days (2%), and on 2015 where the IQR inin-creased from 41 to 48 days (18%). Based on those analysis, we identified five periods of potentially change.
Fig. 4. Boxplot of number of days from GP Referral to Diagnosis by year of diagnosis. Dashed
line shows target duration (31 days). The shaded boxes show the periods where change might have occurred.
Figure 5 shows the top ten trace variants (representing 52%) from the general model and the presence of those variants over the years. Those top ten trace variants show only seven activities, excluding Surgery. The first variant is the common pathway of patients who got the sequence of Referral (R), Investigation (I), Pathology (P), Diag-nostic Surgery (DS), and finally got a Diagnosis (D) of endometrial cancer. The second variant is similar to the first one, but with no record of Investigation. The third variant is similar to the first, except that the patients were admitted after an Investigation. The three most common variants (median [IQR]) are R-I-P-DS-D (19[9]%), R-P-DS-D (10[7]%), and R-I-A-P-DS-D-Di (6[3]%). The qualitative distinction between years is the waving trend of the first variant and the decreasing trend of the other variants.
Fig. 5. Summary of the trace variant comparison over years. Size represents the most frequent
3.4 Activity comparison
We plotted the total number of patients having each of the main activities over years. There is a sudden increase in almost all activities in 2003-2004. There was also a sudden increase in almost all activities in 2010-2011 except on Discharge, and a sudden de-crease in all activities in 2015-2016. These three periods of change (see Fig.6) were also suggested in Section 3.2 when reviewing the model level.
Fig. 6. The total number of patients having each of the main activities over years. The shaded
areas show the periods where change might have occurred at the activity level.
We plotted the percentage of each activity for the number of patients each year (see Fig. 7). We grouped the activities into frequent activities occurring in at least 60% pa-tients, and infrequent activities occurring in less than 60% patients. The three most-frequent activities in all years (median [inter-quartile range]) are Pathology (93[7]%), Diagnostic Surgery (87.5[9]%), and Investigation (80[16]%). The four most-infrequent activities in all years (median [inter-quartile range]) are MDT Review (12[20]%), Out-patient (13[7]%), Surgery (15.5[23]%), and Consultation (16[24]%). Qualitatively, the period of 2010-2011 was marked by a change in the frequency of the four infrequent activities, while Discharge was decreased to be lower than the four infrequent activities. In 2013, the frequency of the infrequent activities were increased except for Outpatient.
Fig. 7. Percentage of activity presence by the number of patients each year. The frequent
activi-ties are presented in solid black lines, the infrequent activiactivi-ties in solid grey lines, and the high-varied activities in dashed grey lines. The shaded areas show the periods where change might have occurred at the activity level. The referral and diagnosis activities are not presented, but both had 100% activity presence in all year groups.
4
Discussion
For our case study of endometrial cancer care in Leeds Cancer Centre, we followed the PM2 methodology, with the exception of Process Improvement and Support. It is in these blind cases where the presence or characterisations of changes are not known in advance that an exploratory approach is appropriate. Our approach supports this explo-ration through a qualitative, multi-level perspective for detecting, localising and char-acterising change in processes. Graphical data visualisations supported discussions about process evolution and change with domain experts and makes use of humans’ natural pattern-seeking capacities. We found that such discussions provoked deep re-flection on the changing nature of the process over time and generated hypotheses about potential causal links between changes detected in the data and changes in practice.
These hypotheses can then be tested by further, more tightly focused process and data analysis. In that respect, our approach is perhaps just a starting point for further exploratory studies. For example, in this case study, we split a fifteen year event log into 15 yearly sub-log but further division of the log into months, weeks, days or hours can be used to isolate potential change events of interest for further study.
Our approach is based on Bose et al.'s process change analysis: detection, localisa-tion and characterisalocalisa-tion, and unravelling [4]. We have improved on Bose et al.'s ap-proach by considering the detection of changes from multiple levels, rather than just at the activity level. Bose et al. suggest that the best place to start analysing process change is by detecting that a process changes has taken place. If that is the case, the next steps are to identify the time periods at which changes happened and characterise the nature of change. The alternative approach described by Partington et al. requires the domain expert to pre-characterise the expected differences that they want to detect and localise. In contrast, our approach did not require prior specification of the changes and instead uses domain experts in the later stage of what Bose et al describe as “Unravelling”. This supports initial exploration without over-burdening collaborators or when the collabo-rators are not able to pre-specify the expected differences.
4.1 Change detection
Changes were detected at all three levels: five at the trace level and three at model and activity levels. From our blinded exploration of our case-study process, we cannot attest to the validity of these detections nor can we know about any true process changes that were not detected. Future work using simulations could attempt to determine the sensi-tivity of our suggested approach to changes in the magnitude and characteristics of pro-cess changes.
4.2 Change localisation and characterisation
Assuming that the detected changes were true changes, we have localised those changes to the 2010-2011 and 2015-2016 periods. These localisations were supported by agree-ment between changes in metric values across multiple levels. The usefulness of our multi-level approach is that the changes detected at one level can guide focused
inves-tigation of the same period at other levels. For our case study, no change was inde-pendently detected at the trace level in 2003-2004 despite detection at the model and activity level. The duration analysis also shows possible changes in 2005 and 2008, where the IQR of durations were increased. A review of the trace durations led us to consider that the median duration in 2016 was the first example of a year’s median duration lying outside the interquartile range of the previous year. Nevertheless, agree-ment in the localisation of changes lends support to the validity of the detected changes.
The aforementioned, post-hoc review of trace durations is an example of how our approach facilitates characterising change at levels where there were not found when investigated in isolation. The different median duration of traces was the only trace-level characterisation of change in 2016. The strongest evidence for a 2016 change came from the sharp decline in trace frequencies at the activity level, and was supported by an unexpected rise in replay fitness at the model level. This multi-dimensional per-spective of a suspected change event informs a more-rounded, complex picture of changes that can be taken to domain experts for discussion.
4.3 Unravelling process evolution
The rich characterisation forms the substance for discussion with clinical experts as we collaborate to explain the mechanism and consequences of the detected changes. Our discussion with clinical experts to unravel process evolution found several findings based on three different levels of process comparison. The process model discovered (see Fig. 2) has been agreed to reflect the general pathways of referral to the diagnosis of endometrial cancer. There was no significant change of the duration and sequence from referral to the diagnosis that the clinical experts were aware of, which confirmed the perspective in the trace-level comparison (see Fig. 4 and Fig. 5). A concern was raised by clinical experts about some trace variants (see Fig. 5) that have an Admission (A) without a Discharge (Di) (variant 7 and 10). Further analysis on these traces re-vealed that the discharge event happened after diagnosis, hence not captured in the trace variants. In the activity level comparison, clinical experts highlighted their concern on the finding that MDT Review is one of the infrequent activities, while in fact, all patients would need to be discussed in the MDT review at some point of their cancer treatment. Further discussion revealed that the MDT reviews usually happened after diagnosis.
Another important discussion about the activity-level comparison is that the system from which the data was collected is evolving. For example, it is shown in Figure 6 that the Outpatient activity started to appear for patients diagnosed in 2006 and the Consul-tation activity started to appear in patients diagnosed in 2008. Further discussion with the PPM development team confirmed that the system was modified in these years to start recording these activities. There were also improvements to the PPM system that introduced automatic imports from other systems (pathology, for example) that were previously captured manually with the effect that data volumes and the reliability of the data increased when the system was improved. There are opportunities for further anal-ysis to examine the effect of these changes in the system on the process over time.
4.4 Reflection on our proposed approach
We discovered our general process model using interactive Data-Aware Heuristics Miner (iDHM) plug-in [16] but other options, like Inductive Miner and Fuzzy Miner or being entirely informed by clinical guidance, might have produced different process models. We used iDHM because its heuristic approach allowed us to get a process model at the desired level of detail. The visualisations provided in the plug-in made it possible to explore the directly-follows graph, dependency graph, causal net, or Petri net. Future work will look at the sensitivity of conclusions to the choice of plug-in.
Further flexibility evident in our approach is the rule for splitting the logs into sub-logs. We split sub-logs based on the calendar year of diagnosis but an equally reasona-ble method would be to split the log to enforce a uniform number of traces in each sub-log. The consequence of the first method is that the number of traces in each sub-log varies and the consequence of the second is that the duration of the sub-log varies. We addressed the consequence of our choice by analysing the frequency in percentage in-stead of the number of occurrences.
5
Conclusion
This paper presented an approach to analyse process changes over time and provided a real-life case study. The case study examined the route from GP Referral to Diagnosis of endometrial cancer in Leeds Cancer Centre patients. The general method followed in this study is the PM2, with a focus on process analytics stage to analyse process changes over time. Process change detection, localisation, and characterisation were carried out at three different levels of comparison: model, trace and activity. This ap-proach allows to detect changes when comparing one year with another. One important limitation of the proposed approach is that it is not able to detect the exact point in time when the change actually occurred. Moreover, this approach could not detect changes back and forth during the same year however, repeating the method with a finer grained time interval would allow the change point to be more accurately detected.
Future work could review the splitting method, the comparison metrics, and the ref-erence model discovery. The comparison metrics used in this study are defined to rep-resent three different level of details but further work might examine other metrics for comparisons. The reference model discovery can be improved by considering clinical guideline as the reference model, or by including only valid traces in the discovery step.
Acknowledgment
This research is supported by ClearPath Connected Cities Project, the Yorkshire and the Humber NIHR Patient Safety Translational Research Centre and the Indonesia En-dowment Fund for Education (LPDP). Access to data used in this study is under the Health Research Authority (HRA) Approval Number 206843.
References
[1] J. C. Schlimmer and R. H. Granger, “Beyond Incremental Processing: Tracking Concept Drift,” AAAI, pp. 502–507, 1986.
[2] J. Carmona and R. Gavaldà, “Online Techniques for Dealing with Concept Drift in Process Mining,” Int. Symp. Intell. Data Anal., pp. 90–102, 2012.
[3] T. Li, T. He, Z. Wang, Y. Zhang, and D. Chu, “Unraveling Process Evolution by Handling Concept Drifts in Process Mining,” Proc. - IEEE 14th Int. Conf. Serv. Comput. SCC 2017, pp. 442–449, 2017. [4] R. P. J. C. Bose, W. M. P. Van Der Aalst, I. Žliobaite, and M. Pechenizkiy, “Handling concept drift in
process mining,” Lect. Notes Comput. Sci. (including Subser. Lect. Notes Artif. Intell. Lect. Notes Bioinformatics), vol. 6741 LNCS, pp. 391–405, 2011.
[5] J. C. A. M. Buijs, B. F. Van Dongen, and W. M. P. Van Der Aalst, “On the role of fitness, precision,
generalization and simplicity in process discovery,” Lect. Notes Comput. Sci. (including Subser. Lect. Notes Artif. Intell. Lect. Notes Bioinformatics), vol. 7565 LNCS, no. PART 1, pp. 305–322, 2012. [6] A. Partington, M. Wynn, S. Suriadi, C. Ouyang, and J. Karnon, “Process Mining for Clinical
Processes: A comparative analysis of four Australian hospitals,” ACM Trans. Manag. Inf. Syst., 2015. [7] A. Bolt, et al., “A visual approach to spot statistically-significant differences in event logs based on
process metrics,” in Lecture Notes in Computer Science, 2016, vol. 9694, pp. 151–166.
[8] A. P. Kurniati, O. Johnson, D. Hogg, and G. Hall, “Process mining in oncology: A literature review,” in Proceedings of the 6th International Conference on Information Communication and Management, ICICM 2016, 2016, pp. 291–297.
[9] K. Baker, E. Dunwoodie, et al., “Process mining routinely collected electronic health records to define real-life clinical pathways during chemotherapy,” Int. J. Med. Inform., vol. 103, 2017.
[10] O. Johnson, P. S. Hall, and C. Hulme, “NETIMIS : Dynamic Simulation of Health Economics
Outcomes using Big Data,” Pharmacoeconomics, vol. 34, no. 2, pp. 107–114, 2015.
[11] A. P. Kurniati, G. Hall, D. Hogg, and O. Johnson, “Process Mining in Oncology using the MIMIC-III
Dataset (accepted version),” IOP J. Phys. Conf. Ser. 971, vol. 971, no. 012008, pp. 1–10, 2018. [12] A. P. Kurniati, E. Rojas, D. Hogg, and O. Johnson, “The assessment of data quality issues for process
mining in healthcare using MIMIC-III , a publicly available e-health record database,” no. 2, 2017. [13] A. Newsham, C. Johnston, and G. Hall, “Development of an advanced database for clinical trials
integrated with an electronic patient record system,” Comput. Biol. Med., vol. 41/8, pp. 575–586, 2011. [14] O. A. Johnson and S. E. Abiodun, “Understanding What Success In Health Information Systems Looks Like: The Patient Pathway Management System At Leeds,” UK Acad. IS Conf. Proc., no. 22, 2011. [15] M. L. Van Eck, X. Lu, S. J. J. Leemans, and W. M. P. Van Der Aalst, “PM2: A process mining project
methodology,” Lect. Notes Comput. Sci., vol. 9097, pp. 297–313, 2015.
[16] F. Mannhart, M. de Leoni, and H. A. Reijers, “Heuristic mining revamped : an interactive, data-aware, and conformance-aware miner,” in Proceedings of the BPM Demo and Dissertation Award (CEUR Workshop Proceedings), 2017, no. 1920, pp. 1–5.
[17] G. Janssenswillen and B. Depaire, “bupaR: Business Process Analysis in R,” in Business Process Management (BPM) Demo, 2017.
[18] L. Elliss-Brookes, et al., “Routes to diagnosis for cancer - Determining the patient journey using
multiple routine data sets,” Br. J . Cancer, vol. 107, no. 8, pp. 1220–1226, 2012.
[19] National Health Service, “Delivering Cancer Waiting Times: A Good Practice Guide,” pp. 0–67, 2015. [20] National Cancer Institute, “Uterine Cancer - Patient Version,” 2018. [Online]. Available: https://www.cancer.gov/types/uterine/patient/endometrial-treatment-pdq. [Accessed: 20-Aug-2007].