Leukemia and small round blue-cell tumor cancer detection using
microarray gene expression data set: Combining data dimension
reduction and variable selection technique
Sadegh Karimi
a,⁎
, Maryam Farrokhnia
baDepartment of Chemistry, College of Sciences, Persian Gulf University, Bushehr, Iran b
The Persian Gulf Marine Biotechnology Research Center, Bushehr University of Medical Sciences,Bushehr,Iran
a b s t r a c t
a r t i c l e i n f o
Article history: Received 26 May 2014
Received in revised form 25 August 2014 Accepted 5 September 2014
Available online 16 September 2014 Keywords:
Microarray gene expression Linear discriminant analysis Clustering of variable Kohonen self-organizing map Genetic algorithm
Using gene expression data in cancer classification plays an important role for solving the fundamental problems relating to cancer diagnosis. Because of high throughput of gene expression data for healthy and patient samples, a variable selection method can be applied to reduce complexity of the model and improve the classification performance. Since variable selection procedures pose a risk of over-fitting, when a large number of variables with respect to sample are used, we have proposed a method for coupling data dimension reduction and variable selection in the present study. This approach uses the concept of variable clustering for the original data set. Significant components of local principal component analysis models have just been retained from all clusters. Then, the variable selection algorithm is performed on these locally derived principal component variables. The proposed algorithm has been evaluated on two gene expression data sets; namely, acute Leukemia and small round blue-cell tumor (SRBCT). Our results confirmed that the classification models achieved on the reduced data were better than those obtained on the entire microarray gene expression profile.
© 2014 Elsevier B.V. All rights reserved.
1. Introduction
Cancer research is one of the most important research areas in the medical sciences. A correct prediction of different tumor types has no-ticeable value in providing better treatment and toxicity minimization on the patients. The early diagnosis of cancer can significantly reduce mortality rates among the patients[1]. On the other hand cancer
classi-fication and detection have always been morphological and clinical based while using conventional methods have own several restrictions in their diagnostic ability[1]. In order to increase a better insight into the problem of cancer classification, systematic approaches based on global gene expression analysis have been proposed[2]. One of the good criteria in cancer detection is the expression level of genes. This phenomenon contains the keys to address fundamental problems relat-ing to the inhibition and treatment of diseases, biological evolution mechanisms and drug discovery.
The recent advent of microarray knowledge has assisted the scien-tists to quickly measure the levels of thousands of genes expressed in a biological tissue sample just in a single experiment[3–7]. This kind of data has some properties. One of their main characteristics is that micro-array studies often generate massive amounts of data (usually contains tens to thousands of genes), which are difficult to be exhaustively
examined by hand. Therefore bioinformatics analysis and interpretation are essential to extract genetic patterns from these data for gaining bio-logical insights from experiments[8]. The second characteristic is related to the publicly available data size which is very small; for example some data have sizes below 100 samples. This subject led to small sample size problem (the ratio of variable to sample is high). In this condition, the classification methods such as LDA have a tendency to show over-fitting result[9]. Finally, most of genes are irrelevant to cancer distinction and should be discarded or removed.
On the other hand, the rise of chemometrics as an important sub-discipline of analytical measurement science results in providing powerful multivariate data analysis. In addition, rapid growth of analyt-ical instrumentation produces huge data set. Consequently, applying chemometric methods in the analysis of these huge data leads to extraction of more information.
Interestingly, a similar revolution has also occurred in biological sciences resulting from new measurement technologies in the last two decades and subsequently the need for the effective data analysis tools such as chemometric methods has been increased. For instances, differ-ent classification methods from statistical and machine learning area have been applied to cancer classification, but there are some issues that make it difficult to perform. For example, it is evident that these conventional classification methods have not been designed to handle this kind of data efficiently and effectively. Some researchers proposed to do the gene selection prior to cancer classification[10–14]to reduce
⁎ Corresponding author.
E-mail addresses:[email protected],[email protected](S. Karimi).
http://dx.doi.org/10.1016/j.chemolab.2014.09.003 0169-7439/© 2014 Elsevier B.V. All rights reserved.
Contents lists available atScienceDirect
Chemometrics and Intelligent Laboratory Systems
the variable space size. Therefore this approach can improve the running time. Significantly, gene selection removes a large number of irrelevant genes and results in better classification accuracy[15].
In the present study, due to the important role of removing unneces-sary genes or factors which are irrelevant for cancer classification, we have suggested the new strategy based on local data dimension reduc-tion with variable selecreduc-tion method for analyzing the gene expression data set. In this approach, clusters of the original variable concept are used to cluster the gene value and only significant components are retained, which is similar to segmented principal component analysis and regression (SPCAR)[16,17]. Finally, a variable selection algorithm (GA) combined with LDA is performed on those locally derived princi-pal component variables instead of whole original data.
2. Theory
2.1. Linear discriminant analysis (LDA)
The LDA is one of the most used traditional classification techniques
[18]. The method is a probabilistic parametric classification technique which performs dimensionality reduction by maximizing the variance between categories and minimizing the variance within categories. The classification index (discriminant function) is based on the Bayes minimum error rule, i.e. samples are classified into the class with the maximum a-posteriori probability and LDA makes the assumption that the classes have identical covariance matrices andfits a multivari-ate normal density to each group with a pooled estimmultivari-ate of the covari-ance. Since a pooled covariance matrix is calculated, the number of objects must be greater than the number of variables. In the other words when the number of variables is exceeded the number of samples, the LDA classifiers does not work[19], i.e. on the percentage of correctly assigned samples, evaluated both on cross-validation groups and external test samples.
2.2. Kohonen self-organizing map
Self-organizing map (SOM)[20]is from the category of artificial neural network (ANN) algorithms that uses unsupervised learning to create a two dimensional representation of training samples. This two dimension representation which is called map consists of components called nodes or neurons. Accompanying with each neuron, there is a weight vector with the same dimension as the input vectors in the map space. The interesting feature of SOM algorithm that distinguishes it from other artificial neural networks is the use of a neighborhood function. During the training step, the Kohonen network adjusts itself in such a way that similar input (here, gene value) is associated with the topological close neuron in the network. The arrangement of neurons is in two dimensions in a hexagonal or rectangular space, with size (p×p) wherepis a defined network sizes.
The mapping procedure is used tofind the neuron in the created net-work with the closest weight vector to the input vector. The most sim-ilar neuron (small distance metric with input vector) has been selected as a winner. Then, the neighbor neurons (in thefirst and second neigh-borhood) also adjust their weights with respect to the winner neuron. Changes in neighboring neuron depend on the neighborhood function. As a result, when the process is completed, similar input vectors (gene values) are clustered in the space, based on their similarities. It should be noted that we have applied SOM to cluster the gene values not the objects. Hence, the variables in the original data matrix, including simi-lar information, are mapped into one node or neighboring nodes. The variables in each node can be collected to form a sub-matrix Di. 2.3. GA-LDA based on SOM
In some cases, we deal with data sets included many variables. For analysis (multivariate calibration and classification) of such data sets,
we should careful about over-fitting problem. Although variable selec-tion methods have been proposed for the aforemenselec-tioned problem, but these methods (genetic algorithm, GA, and forward selection) are not appropriate solution when the number of variables is too large. Related to this issue, Ballabio and co-workers[21]have explained that, GA algorithm results in severe over-fitting or non-optimal solu-tions when the huge number of variables exists. Thus, they have sug-gested that a reduction of data dimension can be useful when dealing with high-dimensional data (MALDI–MS or GC–MS) in which the chemical rank is well below the dimension of the data.
In the present study we faced with the same problem of high dimensional data namely gene expression data set. With this aim, an efficient algorithm for the extraction of significant features from high-dimensional data has been proposed. First, the variables (gene values) have been clustered using Kohonen self-organizing map as clustering algorithm. Subsequently, PCA[22]has been applied on each cluster of the original gene expression profile, similar to the characteristics of the SPCAR algorithm[16,17]. Then, the original data set has been trans-formed into a new data set of which their columns are significant prin-cipal components retained from these local clusters. Finally; the specific PC selection algorithm combined with classification methods can be used for analysis this reduced data set.
Suppose we have a data matrix (D) withIrows (the samples) andJ columns (the gene value). The data dimension reduction can be illus-trated using the subsequent steps:
1- In the first part, the whole gene expression value has been partitioned inqcluster using Kohonen self-organizing map (SOM). Thus, the gene values have been clustered in a different sub-matrix (Di) according to their similarities in information.
D¼ ½ D1½ D2…Dq
h i
h i
ð1Þ
2- In the next step, in order to calculate the principal components and loading of each cluster, PCA can be applied in each sub-matrix (Di) separately. It should be noted that different preprocessing algo-rithms (depending on the type of data) can be used for each cluster.
Di¼TiPTi i¼1:q ð2Þ
The matrices Tiand Piare the principal components and loadings of the each cluster (Di) respectively. The superscript“T”indicates the matrix transpose notation.
3- In this step, the most important of PCs and corresponding loadings form each cluster should be selected. Different strategies can be con-sidered for this screening. In the present study, explained variance (EV) and root mean square error of cross-validation (RMSCV) have been used as criteria to select the most significant PCs in each cluster. For explained variance criterion, the PCs of which their explained variances are higher than the specific value (95%) have been kept. By substitution of Eq.(2)into Eq.(1)we obtain:
Dr¼ T1P T 1 h i T2P T 2 h i …TqP T q h i h i : ð3Þ
The T1to TqandP1TtoPqTare the PCs and loadings obtained from different sub-matrices (Di).
The new data set, Dr,which we called reduced data matrix, consists of all the obtained PCs from different clusters. Obviously the dimen-sions of Dris (I×r), whereIis the number of samples andris the total number of principal components obtained from previous step. Eq.(3)indicates that one can be able to separate the PCs and load-ings of different clusters. If we have just rearranged Eq.(3), a new possibility can be obtained (Eq.(4)).
Dr¼ T1T2…Tq
h i
The mathematical description of Eq.(4)is the same as the PCA application on whole microarray gene expression data. In the other words,
D¼TPT: ð5Þ
Now these PCs and loadings (T and P matrices) come from the orig-inal D-matrix, respectively. By comparison, Eqs.(4) and (5)indicate that:
T¼ T1T2…Tq
h i
and PT¼V: ð6Þ
However, as it is evident from Eq.(4)the principal components have been extracted from different clusters while those in Eq.(5)have been obtained from whole microarray gene expression data of D. The V matrix in Eq.(4)contains the loading vectorsP1T–PqTin its diagonal and zero values in other positions:
V¼ PT2 0 … 0 0 PT2 … 0 … … … … 0 0 … PTq 2 6 6 6 4 3 7 7 7 5:
Obviously the number of columns in V is equal to the number of columns in the original D matrix and the number of rows in V is equal to the sum of extracted significant PCs from the clusters. By this approach, three main purposes have been obtained. Thefirst one is that the most information of original data matrix has been maintained. The second one, which is the most important, is that the dimension of data has been reduced. Lastly, the information in the PCs of original data set has been divided into different parts. 4. Similar to what is done in conventional LDA[23], the classification
score for training sample (xi) is defined as: classification scoreð Þ ¼xi ðxi−μkÞ
X−1
pooledðxi−μkÞ−
1
: ð7Þ
∑pooled−1 , is the inverse of class covariance matrix, andμkis the mean vector of classk.
It is worthy to mention again that, for an ill-condition situation which the number of variables is higher than the number of objects, the estimations of the class covariance matrix become highly uncer-tain, which is not true in our case.
5. The reduced data (Dru), for prediction step[17], where the columns are PC variables (tu), can be constructed as:
tu¼ t1ut2u…tqu
h i
¼DuVþ: ð8Þ
The superscript‘+’denotes the matrix pseudo-inversion.
Two important issues must be considered in this algorithm: thefirst one is the type of clustering algorithms and the second ones is the cluster size (q). Related tofirst one, we have recently compared the
five clustering algorithms such as, PCA (loading plot), K-means, Fuzzy-c-mean, hierarchical and Kohonen self-organizing map (SOM) on the efficiency of SPCAR algorithm[24]. Different data sets have been ana-lyzed and the statistical parameter demonstrated that using nonlinear clustering such as SOM has superiority with respect to other clustering algorithms[24]. The cluster size (q) should be optimized by trial and error thus all classification models have been performed on any net-work size and the obtained results have been compared for their predic-tion abilities. The performance evaluapredic-tion of the each cluster size form LDA classification models which has been used based on Not-Error
Rate (NER) values, evaluated both on cross-validation groups and exter-nal test samples. The validation of the presented classification models is based on leave many out (LMO) cross-validation (1/5 being excluded during each run).
As it is noted previously, the PCs of different clusters and corre-sponding loadings can be considered as explanatory and redundant one for classification. Obviously the second ones degrade the calibration and prediction ability of classification methods, thus the useful PCs which can improve the classification model should be extracted. This can be done by applying the PC selection algorithm such as genetic algo-rithm (GA) on the reduced data set (Dr). We do not confront with any problem using GA, because the number of variables (PCs) is decreased and the extracted PCs are not highly collinear. For any network size of SOM, the classification models have been constructed based on selected PCs and statistical parameters have been used to compare the network sizes.
Genetic algorithms[25], the approach used in this paper is described by Leardi and Lupianez Gonzalez in PLS regression[26], however the basic difference is that GAs are coupled directly with LDA[27] to improve the power of the classification algorithm. The selection of variables is performed by repeating GAs,ttimes and then including the variables on the basis of the frequencies of selection. All the setting parameters for GA are listed inTable 1.
In the current study, useful PCs have been selected on the basis of NER values as a function of the number of selected PCs. Finally, it should be noted that the basic idea of GA-LDA based on SOM is similar to SPCAR
[17]but it is used in classification problem. Moreover with this strategy the aforementioned problem of LDA and GA in the huge data can be solved.
3. Description of data experimental data sets
Two gene expression data sets are used in this work in order to show the efficiency of the proposed algorithm. The data sets are acute Leukemia[28]and SRBCT [29]. The description of the data sets is given as follows: Thefirst one comprises of DNA microarray gene ex-pression data of human acute Leukemia for cancer classification. Two types of acute Leukemia data are provided for classification namely acute lymphoblastic Leukemia (ALL) and acute myeloid Leukemia (AML). In accordance with Golub et al.[28]approach the data set has been divided to 38 calibration and 34 prediction samples. The 38 bone marrow samples in calibration set consist of 27 ALL and 11 AML, over 7129 gene value. The test set consists of 34 samples with 20 ALL and 14 AML, prepared under different experimental conditions. The second data is the small round blue-cell tumor data set consists of 83 samples with each having 2308 gene values. This is a four class classification problem that makes it more difficult for analysis. The tumor samples are Burkitt lymphoma (BL), the Ewing family of tumors (EWS), neuro-blastoma (NB) and rhabdomyosarcoma (RMS). As suggested by Khan et al.[29], the 63 samples which contain 8, 23, 12 and 20 from BL, EWS, NB and RMS respectively, have been used for calibration set. The test set has been composed of 20 samples which include 3, 6, 6 and 5 samples of BL, EWS, NB and RMS respectively. The compositions of cal-ibration and prediction samples have been collected in Supplementary Tables S1 and S2 for Leukemia and SRBCT data sets.
Table 1
Setting of genetic algorithm (GA) parameter.
Parameter Value
Population size 150
Cross-over 50%
Mutation probability 1%
Number of generation 200
3.1. Computational details
Data analyses have been performed in a MATLAB environment (MathWorks, Inc., Natick, MA, USA, version 7.2). GA-LDA is based on GA-PLS of Leardi which is modified for classification problem by him. The LDA classification and Kohonen self-organizing map toolboxes pro-vided by Ballabio were downloaded for free from the website of Milano Chemometrics and QSAR research group (http://michem.disat.unimib. it/chm/download/kohoneninfo.htm).
3.2. Preprocessing
Prior to principal component extraction form each cluster, gene expression profiles of each cluster were subjected to normalized preprocessing.
4. Results and discussion 4.1. PCA overview of acute Leukemia
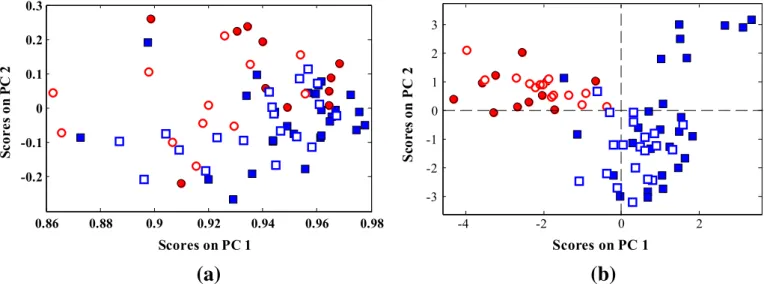
To get an overview of the data, the calibration data set of 38 training samples was applied to the extracted PCs and then those PCs were used to analyze 34 test samples. A plot of thefirst two principal components,
accounting for 91.27% of the original variance, is shown inFig. 1a. This picture indicates the relative position of studied samples with respect to each other based on the similarity between their gene expression microarray data. Since most of variations are unrelated to class informa-tion, more extraction of PCs is not useful. There is no evidence of sepa-ration between the two classes along the two principal components and there is a large degree of overlapping between classes. In the other words, the PCA model has no practical value in this subject.
However, by clustering of variable concept before application of PCA on whole variables, better class separation has been observed in two-dimensional spaces of factor scores. InFig. 1b one representative plot is shown. The scores of this plot have been calculated from the best net-work size of Leukemia data set (q= 5). In comparison with convention-al PCA plot (Fig. 1a), much better separation of classes is observed. In other words, obtained PCs and corresponding loadings (gene variables), possess better information regarding the Leukemia biomarkers.
4.2. GA-LDA based on SOM: PC selection and classification 4.2.1. Data set 1 (acute Leukemia)
The gene expression of Leukemia data matrix is composed of 7129 variables. However, not all parts of the presented gene value have useful information about the class of samples. In this case, we have considered
(a)
(b)
Fig. 1.Distribution pattern of the Leukemia samples in the two-dimensional PCA-based factor space of their gene expression microarray data: (a) whole microarray gene expression variables. (b) Selected PCs used in the LDA for network size (q= 5). Acute myeloid Leukemia (○,●) (AML), acute lymphoblastic Leukemia (□,■) (ALL). Filled and open markers denote calibration and prediction samples, respectively.
Table 2
Statistical parameters of the GA-LDA based dimension reduction models obtained from different clusters (nodes of the Kohonen network): Leukemia data set. Number of segments (Kohonen nodes) NEPCa NSPCb NERcalc NERvald NERpree NERrdCV,calf NERrdCV,valg NERrdCV,preh 4 (2 × 2) 30 3 0.89 0.80 0.75 0.89 0.85 0.83 9 (3 × 3) 43 3 0.95 0.91 0.84 0.92 0.93 0.90 16 (4 × 4) 54 3 1.0 0.95 0.91 0.97 0.96 0.92 25 (5 × 5) 85 5 1.0 1.0 0.94 0.98 0.97 0.97 36 (6 × 6) 127 5 1.0 1.0 0.90 0.97 0.97 0.92 49 (7 × 7) 133 4 1.0 0.90 0.86 0.97 0.92 0.88 64 (8 × 8) 141 4 0.98 0.90 0.80 0.96 0.92 0.85 a
Number of the extracted PCs from all clusters. b
Number of selected PCs. c
Not error rate for calibration set. d Not error rate for validation. e Not error rate for prediction set. f
Not error rate based on repeated double cross-validation for calibration set. g
Not error rate based on repeated double cross-validation for validation set. h
that the chemical rank can be the subtypes of acute Leukemia (AML, ALL) which is well below than the dimension of data. Thus, GA cannot handle this high dimensional data set. In thefirst step of our proposed algorithm, Kohonen SOM is employed to cluster gene value based on their similarity. One of the significant features of SOM is the optimiza-tion of the number of Kohonen nodes. Eachn-node SOM model pro-duces (n×n) cluster of variables. Thus, the number of clusters (q) produced by each SOM model is equal ton2. The variables in each cluster are considered as one cluster of variables which have similar informa-tion. Each cluster can be described asSi,j, whereiandjare row and col-umns of clusters in Kohonen map, respectively. Seven SOM networks with the node sizes of 2 to 8 were checked. The distribution pattern of variables in the (5 × 5) SOM network is presented in Fig. S1. Thisfigure reveals that the distribution pattern of the gene values by clustering al-gorithms (SOM) is not homogeneous. This is an inherent property of clustering algorithms. In some clusters (such asS2,4,S3,3,S3,4,S4,3and S5,4) a high population of gene values is observed, whereas some others such asS4,4andS4,5contain few numbers of genes. Each cluster is subjected to PCA separately and the meaningful PCs and loading are extracted using mentioned criteria. According to Eq.(4)and LDA algo-rithm, the extracted PCs of all clusters were linearly related to the class information of the training set by genetic algorithm PC selection.
Table 2lists the statistical classification parameters of the models obtained from different number of clusters through Kohonen SOM method. This table also includes the number of total PCs which are ex-tracted from the submatrices (NEPC) and the number of PCs selected in thefinal LDA model (NSPC) using genetic algorithm. One of the impor-tant issues in GA-LDA based on SOM is selection of the best model. As we discussed in our previous publications[16,17]by considering the higher number of cluster size, the statistical parameter of calibration
and validation is increased but worse prediction statistics is obtained. Description of this subject can be attributed to chance correlation phe-nomena. By increasing the number of clusters, the number of extracted PCs, and consequently, the ratio of the number of variables to the num-ber of samples are increased. According to the recommendation of Topliss and Edwards[30], by increasing this ratio (variable to sample) the probability of getting a chance model is increased. Thus, both cali-bration and prediction results have been considered for optimum model selections. As it is evident fromTable 2the number of extracted PCs is increased (from 30 to 141) when the number of clusters or Kohonen nodes is increased (from 4 to 64). However, the number of se-lected PCs remains relatively constant (3 to 5) and are independent of the number of clusters. The Not Error Rate (NER) of calibration and cross-validation statistics shown inTable 1reveal that GA-LDA model obtained fromfive Kohonen nodes (25 clusters) is the optimum one for both calibration and prediction classification ability. This 25-cluster GA-LDA model which usesfive PCs out of 85 extracted PCs, has very high degree of correctly assigned sample (NER) 1.00, 1.00 and 0.94 for calibration, cross-validation and prediction, respectively. The same con-clusions can be reached by looking atTable 3. From the result of this table, GA-LDA of network size 5 consistently yields higher values of both specificity and sensitivity for cross-validation and test samples with respect to other network sizes.
On the other hand, we need to a powerful validation method when we deal with low number of individuals compared to the large number of variables[31]. Consequently, since we have a small data set (especial-ly in Leukemia), the obtained models also have been subjected to new and efficient validation method recently proposed by Varmuza et al.
[32], which is called repeated double cross-validation (rdCV). The rdCV gives a more realistic estimation of the prediction performance than do simple strategies with only a single split into calibration and test sets. Because the algorithms repeated—typically 100—of the data into calibration and test sets, chance performance results are avoided. In each repetition for estimation of the prediction performance of obtained model, each model is validated with an independent test set. Obviously depending on the number of repetitions, rdCV yields a large Table 3
Sensitivity (Sn)aand specificity (Sp)bachieved by different cluster size for proposed algorithm.
(2 × 2) (3 × 3) (4 × 4) (5 × 5) (6 × 6) (7 × 7) (8 × 8)
CVc
Test CV Test CV Test CV Test CV Test CV Test CV Test
Specificity 0.82 0.75 0.82 0.79 0.91 0.83 1.0 0.93 1.0 0.86 0.90 0.84 0.81 0.78
Sensitivity 0.93 0.89 1 0.90 1.0 0.90 1.0 0.95 1.0 0.88 0.83 0.78 0.80 0.75
a
Class sensitivity (Sn) describes the model ability to correctly recognize samples belonging to thegth class, i.e. if all the samples belonging togare correctly assigned,Snis equal to 1. b
Class specificity (Sp) describes the model ability to reject samples of all the other classes from classgth, i.e. if samples not belonging togare never assigned tog,Spis equal to 1. c
Cross-validation.
Table 4
Biological meaning gene selected using GA-LDA based SOM from Leukemia data set.
Code ID Gene description
IOTA X59417 Proteasome iota chain
CCND3 M92287 Cyclin D3
ACADM M91432 Acyl-coenzyme A hSNF2b U29175 Transcriptional activator MCM3 D38073 Minichromosome maintenance
Op18 M31303 Oncoprotein
FAH M55150 Fumarylacetoacetate
LYN M16038 Yamaguchi sarcoma viral related oncogene homolog
CD11-c M81695 Integrin alpha
Epb72 X85116 Gene exon
LEPR Y12670 Leptin receptor
AARS D32050 Alanyl-tRNA synthetase IGB M89957 Immunoglobulin-associated NM23 Y07604 Nucleoside-diphosphate kinase
VIL2 X51521 Villin
MACMARCKS HG1612 Macmarcks DAGK1 X62535 Diacylglycerol kinase ESP-2; HED-2 X95735 Zyxin
PKM2 X56494 Pyruvate kinase
CD53 M37033 Antigen
SAT M24485_s Spermidine/spermine N1-acetyltransferase
HMG-I L17131_rna1 High mobility group AT-hook 1 Fig. 2.Classification using GA-LDA based on dimension reduction technique on acute Leukemia data set. The markers are the same as described inFig. 1.
number of residuals from‘independent’test sets, which are the basis for measuring the prediction performance. The Leukemia data set was split into training and external validation sets. Approximately 30% of the samples was selected by the random sampling algorithm to be the external validation set. Consequently, each test set consisted of 22 sam-ples, whereas each calibration set comprised 50 samples. The statistical parameters (NERcal,rdCV, NERval,rdCVand NERpre,rdCV) obtained from dif-ferent GA-LDA based SOM models have been shown in the last three columns ofTable 2. The obtained results from rdCV procedure verify the same trend in comparison with our previous result in leave many out CV. Thus, the network sizeq= 5 has been selected as the best one for both calibration and prediction ability.
The selected PCs are representative of the gene values that appeared in these clusters. These genes values have information that is more correlated with class information of our samples. In order to know which subset of genes is more useful for classification of the Leukemia, the corresponding loadings of the selected PCs have been searched for variables (genes) of the highest loading values and those detected are shown inTable 4for Leukemia data set.
Finally, the discriminant function plot of Kohonen network sizeq= 5 is given inFig. 2. As it is evident, a clear separation between samples from the LDA plot of this cluster size is observed. In other words, the large difference between calibration and test set samples is related to the efficiency of selected genes which are reported inTable 4for Leukemia data set.
The problem of small sample size with respect to the number of gene values can be solved by generalized LDA[33]. In the generalized LDA, pseudo linear function is used. To investigate the potential of the pro-posed method, the LDA model has been built using the full set of the original variables, and misclassification rates are 84.0% and 70.0% for the cross-validation and external test sets, respectively. The comparison between LDA classification results with and without feature selection (Table 5) confirms the superiority of our proposed algorithm. Finally,
Table 6summarizes the statistical results (mean classification accuracy) of the proposed model with those of previously reported models for Leukemia data set. As it can be seen inTable 6, GA-LDA based on dimension reduction can provide models with prediction abilities better thank-nearest neighboring (k-NN) and conventional classification and regression tree (CART) model. As discussed by Du et al.[34], using irrel-evant or redundant genes variables byk-NN and CART, increase the risk of over-fitting of the classification model. Thus, variable selection based
on ranking the ratio of between classes sum of squares to within class sum of squares (BSS/WSS) has been employed to select the relevant variables in the Leukemia data set. As a consequence, a good calibration model has been obtained, but the prediction of the model is very poor. This subject indicates that the ability of BSS/WSS for identifying signification genes is restricted. Finally, the proposed GA-LDA based dimension reduction method produces prediction accuracy similar (somehow better than in calibration) to that of the novel variable selection-multivariate calibration method (unimodal transform of vari-ables selected by interval segmentation purity; UTISP-based CART)[34]
method; however the latter produces a more accurate prediction in test set. Nevertheless, the mathematical description of UTISP-based CART is complex with respect to GA-LDA based dimension reduction.
4.2.2. Data set 2 (small, round blue-cell tumors data, SRBCT)
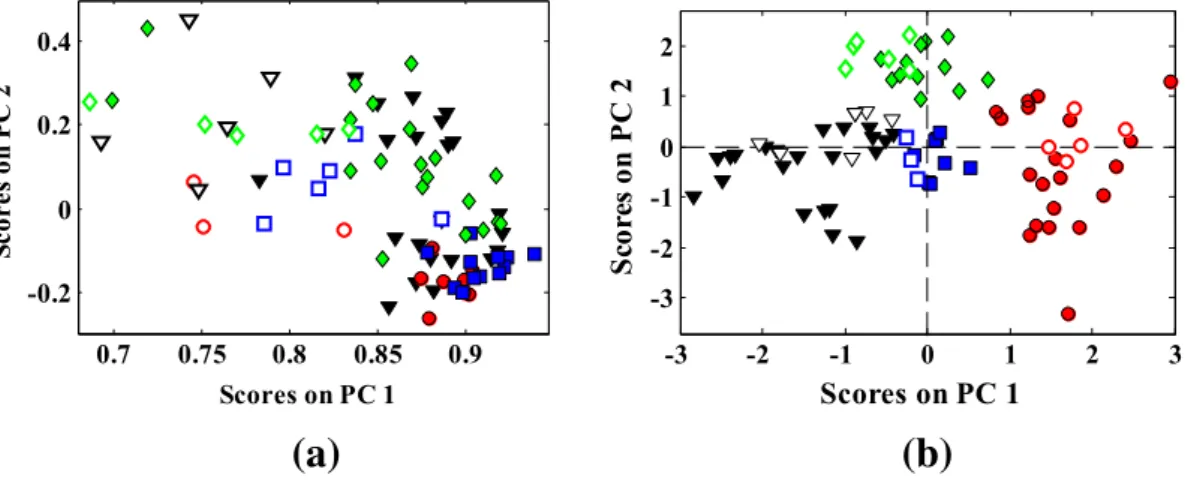
The results of PCA application in the SRBCT samples are given in Table S3. The PCA has been applied on whole region of microarray gene expression data matrix and the results are presented for thefirst 5 principal components (PCs). The eigenvalue (EV) of each PC, the percent of variances in the data explained by each PC (PV) and the cu-mulative percent of variances (CPV) are reported. Table S3 reveals that thefirst three principal components explain about 82.97% of the total gene expression variations. In the other words by projecting 2308-gene value spectra into three-dimensional factor space, about 82.97% of information is retained. In accordance withFig. 3a, a severe overlapping among four classes is observed. Because PCA is an unsuper-vised method the extracted PCs are calculated only from the data matrix (X), subsequently, they might be not necessarily the components rele-vant for discrimination. Nevertheless, better separation of SRBCT classes has been achieved by application of clustering of variable concept. As it is shown inFig. 3b, by applying the PCA on the PCs, which arose from network sizeq= 2, one can see some degrees of improvement in the scatter plot of PCs.
4.2.3. GA-LDA based on dimension reduction
As we mentioned about chemical rank in Leukemia data set, the same assumption can be considered for SRBCT data set. In this case, the chemical rank is four subtypes of SRBCT (BL, NB, RMS and EWS) cancer. Thus, GA-LDA based SOM has been applied instead of GA. Similar to the Leukemia data set, the gene values have been clustered using Kohonen SOM according to the similarity in the gene expression information. The Kohonen nodes of 2 to 8 have been examined. The GA-LDA models based on dimension reduction resulting from the differ-ent cluster size are summarized inTable 7. It is noted that the GA-LDA model of 2-node Kohonen network leads to the best NER of calibration, cross-validation and prediction results. It has the NER of calibration, cross-validation and prediction of 1.0, 0.930 and 0.970 respectively. The same trend has been obtained based on repeated double cross-validation analysis. The statistical parameters are found in the last three columns ofTable 7. This subject suggests that by dividing the linear discriminant of the conventional LDA model (columns in the T matrix) into the sub-score (T1–Tqsub-matrices), it becomes possible Table 5
Performance of classifier algorithms obtained with GA-LDA based dimension reduction and without feature selection (Leukemia: two class problem).
LDA without feature selection
CLoVA-GA-LDA in optimum SOM network size Cross-validation Test set Cross-validation Test set
Success rate 0.84 0.70 1.0 0.94
Specificity 0.76 0.75 1.0 0.93
Sensitivity 0.81 0.66 1.0 0.95
Table 6
Classification results of Leukemia and SRBCT data sets using a GA-LDA based dimension reduction compared with those previously reported.
Data set Leukemia SRBCT [Ref]
No. of genes Prediction accuracy No. of genes Prediction accuracy
Training set Test set Training set Test set
Method k-NN 3571 NRa 0.8529 2308 NRa 0.7780 [34] CART 3571 0.9737 0.8529 2308 0.9422 0.7954 [34] BSS/WSS-based CART 160 0.9737 0.8235 160 0.9759 0.8443 [34]
UTISP based CART 21 0.9737 0.9706 8 0.9459 0.9159 [34]
GA-LDA based on dimension reduction 22 1.000 0.9421 55 1.000 0.9500 Our study
a
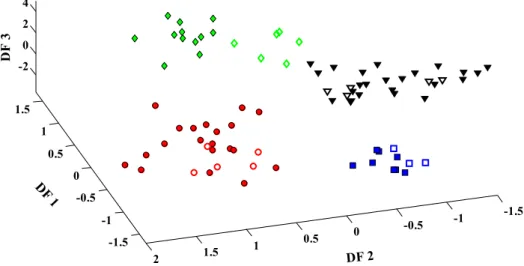
to select the informative parts of the PCs and thus to obtain more stable and predictive models. Furthermore, the three dimension of discrimi-nant function plot of (LDA) is depicted in (Fig. 4). It shows a good dis-crimination among four classes of samples from the canonical plot of network sizeq= 2. Also, the statistical parameters in Table S4 confirm the efficiency of proposed algorithm in predicting class variables of SRBCT data set. However, the reported data inTable 4explain that in spite of significant improvement in classification accuracy achieved by our proposed algorithm, the suggested model is associated with small misclassification errors due to the complexity of the investigated data set. The comparison between the GA-LDA based on dimension reduc-tion model for classifying different kinds of small, round blue-cell tumors (SRBCTs) and the previously presented model is reported in
Table 6. The prediction accuracy provided by the proposed method is higher than those ofk-NN, CART, BSS/WSS based CART and even UTISP based CART[34]. Among these methods,k-NN and CART uses the information of all genes variable and the redundant parts of the data lead to lower the prediction accuracy of these model. However Qin Yu et al.[34], increased the prediction power of CART by its combi-nation with novel variable selection, which has been named unimodal transform of variables selected by interval segmentation purity; UTISP. As it is shown inTable 6, this method could not produce prediction ac-curacy higher than GA-LDA based on dimension reduction because the latter method not only use the information from all cluster of variables but also use the included information in the genes that are correlated with these selected genes variable.
5. Biological significance of selected gene
As was mentioned the selected important genes of Leukemia data set are listed inTable 4. To evaluate the performance of these selected genes in cancer classification, we compared them with the most impor-tant genes reported by Golub et al.[28]. This comparison indicates that there is a good consistency with experimental evidences of gene expres-sions for Leukemia data set. Although out of 23 genes selected by our method, 12 genes were also selected by Golub et al.[28], the remaining genes have also relevance to this cancer. The role of several biologically significant genes can be explained because some of them code for proteins which play important roles in Leukemia such as Macmarcks gene, where tumor necrosis factor-alpha rapidly stimulates Macmarcks gene transcription in human promyelocytic Leukemia cells[35]. The ZYX gene: Zyxin encodes a LIM domain protein localized at focal contacts in adherent erythroleukemia cells[36]. The CCND3 gene: A 51-bp deletion was detected in CCND3 in a patient with normal karyo-type acute myeloid Leukemia[37].
On the other hand, those genes which were not presented by Golub
[28]such as NM23 have been reported by other researchers[38]. Many researchers have postulated that the NM23 gene family is related to Leukemia such as NM23-H1[39–41]. It sounds that the other selected genes by our method also present significant role in cancer, like PKM2 gene which is generally expressed in tumor cells and its presence in plasma can be used as a diagnostic marker. Its role in tumor cells may contribute to the Warburg effect in cancer, where cells up regulate
(a)
(b)
Fig. 3.Distribution pattern of the SRBCT samples in the 2-dimensional PCA-based factor space of their gene expression microarray data. (a) Whole microarray gene expression variables of SRBCT data. (b) Selected PCs used in the LDA for network size (q= 2). (○,●) RMS, (□,■) BL, (◊,♦) NB and (∇,▼) EWS: Filled and open markers denote calibration and prediction samples, respectively.
Table 7
Statistical parameters of the GA-LDA based dimension reduction models obtained from different clusters (nodes of the Kohonen network): SRBCT data set. Number of segments (Kohonen nodes) NSPCa NERcalb NERvalc NERpred NERrdCV,cale NERrdCV,valf NERrdCV,preg 4 (2 × 2) 6 1.0 0.93 0.97 1.0 0.95 0.98 9 (3 × 3) 6 1.0 0.93 0.88 0.98 0.95 0.91 16 (4 × 4) 5 1.0 0.98 0.85 0.99 0.98 0.89 25 (5 × 5) 6 0.99 0.97 0.83 0.98 0.95 0.85 36 (6 × 6) 6 1.0 0.97 0.77 0.97 0.94 0.80 49 (7 × 7) 6 1.0 0.97 0.75 0.97 0.91 0.77 64 (8 × 8) 5 0.98 0.96 0.75 0.97 0.91 0.72 a Number of selected PCs. b
Not error rate for calibration set. c Not error rate for validation. d Not error rate for prediction set. e
Not error rate based on repeated double cross-validation for calibration set. f
Not error rate based on repeated double cross-validation for validation set. g
glycolysis and lactate production while decreasing oxygen consumption
[42]. In addition, Leukocyte surface antigen CD53 is another selected gene. CD53 is a member of the tetraspanin family of hydrophobic membrane-spanning proteins. High levels of CD53 expression is found on different cancers, such as B-cell Leukemia and lymphomas, suggest-ing it may contribute to increased survival of the tumor cells[43]. HMG-I acts as an oncogene and it is suggested that it contributes to the pathogenesis of Leukemia and other cancers with elevated HMG-I expression[44]. Finally, SAT gene associates with white blood cell count in myeloid Leukemia[45]. Important issue that should be mentioned in the case of Leukemia data[28], is that less useful informa-tion can be obtained. This is probably due to the fact that, not possible to construct a perfect prediction based on using the training data. On the other hand, test data set of Leukemia seems to be very different from the data set used to model development part[46].
Similarly, the samefinding has been obtained for SRBCT. The select-ed genes are reportselect-ed in Supplementary Table S5. In this case, there is a high consensus between our selected genes and that reported by Khan
[29]and all 55 selected genes have been also presented by the method of Khan[29]. In accordance with the report of Khan[29], all these iden-tified genes are related to tumor histogenesis or associated with a single cancer type. For example MIC2, is currently used to diagnose EWS. In addition, IGF2 and FGFR4 are two genes which are highly expressed only in RMS and related to myogenesis.
6. Conclusion
In the present study, clustering of variable concept has been used in gene expression data analysis for cancer detection. In this algorithm, the entire variable is divided into different clusters using unsupervised pattern recognition. The local useful PCs extracted from each cluster of the original variable can be collected in a matrix and this can provide a significant reduction in the complexity of collinear high-dimensional data. Finally reduced data set can be treated with the proposed variable selection methods. The obtained results, demonstrate that it is possible to split the information in the linear discriminant into informative and redundant ones. The performance of this method has been validated by analysis of the two public gene expression data sets (Leukemia and SRBCT). The results indicate that, for such high-dimensional data, the data reduction plays a more significant role for variable selection and classification method in achieving reasonable results.
Conflicts of interest
The authors declare that there are no conflicts of interest.
Appendix A. Supplementary data
Supplementary data to this article can be found online athttp://dx. doi.org/10.1016/j.chemolab.2014.09.003.
References
[1] O.P. Whelehan, M.E. Earll, E. Johansson, M. Toft, L. Eriksson, Detection of ovarian cancer using chemometric analysis of proteomic profiles, Chemometr. Intell. Lab. 84 (2006) 82–87.
[2] S. Ramaswamy, P. Tamayo, R. Rifkin, S. Mukherjee, C.-H. Yeang, M. Angelo, C. Ladd, M. Reich, E. Latulippe, J.P. Mesirov, Multiclass cancer diagnosis using tumor gene expression signatures, Proc. Natl. Acad. Sci. 98 (2001) 15149–15154.
[3] A. Berns, Cancer: Gene expression in diagnosis, Nature 403 (2000) 491–492. [4] S.R. Lakhani, A. Ashworth, Microarray and histopathological analysis of tumours: the
future and the past? Nat. Rev. Cancer 1 (2001) 151–157.
[5] Y. Lu, J. Han, Cancer classification using gene expression data, Inf. Syst. 28 (2003) 243–268.
[6] M. Schena, D. Shalon, R.W. Davis, P.O. Brown, Quantitative monitoring of gene expression patterns with a complementary DNA microarray, Science 270 (1995) 467–470.
[7] A. Sharma, K.K. Paliwal, Cancer classification by gradient LDA technique using microarray gene expression data, Data Knowl. Eng. 66 (2008) 338–347. [8] J. Liang, S. Kachalo, Computational analysis of microarray gene expression profiles:
clustering, classification, and beyond, Chemometr. Intell. Lab. 62 (2002) 199–216. [9] L. Kanal, B. Chandrasekaran, On dimensionality and sample size in statistical pattern
classification, Pattern Recogn. 3 (1971) 225–234.
[10] Y. Cui, C.-H. Zheng, J. Yang, Sparse maximum margin discriminant analysis for feature extraction and gene selection on gene expression data, Comput. Biol. Med. 43 (2013) 933–941.
[11] R. Diaz-Uriarte, S.A. De Andres, Gene selection and classification of microarray data using random forest, BMC Bioinforma. 7 (2006) 3–10.
[12] S. Dudoit, J. Fridlyand, .P. Speed, Comparison of discrimination methods for the classification of tumors using gene expression data, J. Am. Stat. Assoc. 97 (2002) 77–87.
[13]A. Gusnanto, A. Ploner, F. Shuweihdi, Y. Pawitan, Partial least squares and logistic regression random-effects estimates for gene selection in supervised classification of gene expression data, J. Biomed. Inform. 46 (2013) 697–709.
[14]H.-D. Li, Q.-S. Xu, Y.-Z. Liang, Random frog: An efficient reversible jump Markov Chain Monte Carlo-like approach for variable selection with applications to gene selection and disease classification, Anal. Chim. Acta. 740 (2012) 20–26. [15]I. Guyon, J. Weston, S. Barnhill, V. Vapnik, Gene selection for cancer classification
using support vector machines, Mach. Learn. 46 (2002) 389–422.
[16] B. Hemmateenejad, M. Elyasi, A segmented principal component analysis regression approach to quantitative structure activity relationship modeling, Anal. Chim. Acta. 646 (2009) 30–38.
[17] B. Hemmateenejad, S. Karimi, Construction of stable multivariate calibration models using unsupervised segmented principal component regression, J. Chemometr. 25 (2011) 139–150.
[18] G. McLachlan, Discriminant analysis and statistical pattern recognition, Wiley.com, 2004.
[19]I.E. Frank, R. Todeschini, The data analysis handbook, Access Online via Elsevier, 1994.
[20] S.S. Fong, V. Sagi-Kiss, R.G. Brereton, Self-Organizing Maps and Support Vector Regression as aids to coupled chromatography: Illustrated by predicting spoilage in apples using volatile organic compounds, Talanta 83 (2011) 1269–1278. Fig. 4.3-Dimensional discriminant function (DF) plot (DF1 × DF2 × DF3) using GA-LDA based on dimension reduction technique on SRBCT data set. The markers are the same as described inFig. 3.
[21] D. Ballabio, T. Skov, R. Leardi, R. Bro, Classification of GC–MS measurements of wines by combining data dimension reduction and variable selection techniques, J. Chemometr. 22 (2008) 457–463.
[22]S. Wold, K. Esbensen, P. Geladi, Principal component analysis, Chemometr. Intell. Lab. 2 (1987) 37–52.
[23]W. Wu, Y. Mallet, B. Walczak, W. Penninckx, D.L. Massart, S. Heuerding, F. Erni, Comparison of regularized discriminant analysis linear discriminant analysis and quadratic discriminant analysis applied to NIR data, Anal. Chim. Acta. 329 (1996) 257–265.
[24]B. Hemmateenejad, S. Karimi, N. Mobaraki, Clustering of variables in regression analysis: a comparative study between different algorithms, J. Chemometr. 27 (2013) 306–317.
[25] R. Leardi, Genetic algorithms in chemometrics and chemistry: a review, J. Chemom. 15 (2001) 559–569.
[26]R. Leardi, A. Lupiz Gonzalez, Genetic algorithms applied to feature selection in PLS regression: how and when to use them, Chemometr. Intell. Lab. 41 (1998) 195–207.
[27] H. Yoshida, R. Leardi, K. Funatsu, K. Varmuza, Feature selection by genetic algorithms for mass spectral classifiers, Anal. Chim. Acta. 446 (2001) 483–492.
[28] T.R. Golub, D.K. Slonim, P. Tamayo, C. Huard, M. Gaasenbeek, J.P. Mesirov, H. Coller, M.L. Loh, J.R. Downing, M.A. Caligiuri, Molecular classification of cancer: class discov-ery and class prediction by gene expression monitoring, Science 286 (1999) 531–537.
[29]J. Khan, J.S. Wei, M. Ringner, L.H. Saal, M. Ladanyi, F. Westermann, F. Berthold, M. Schwab, C.R. Antonescu, C. Peterson, Classification and diagnostic prediction of cancers using gene expression profiling and artificial neural networks, Nat. Med. 7 (2001) 673–679.
[30] J.G. Topliss, R.P. Edwards, Chance factors in studies of quantitative structure–activity relationships, J. Med. Chem. 22 (1979) 1238–1244.
[31] J.A. Westerhuis, H.C.J. Hoefsloot, S. Smit, D.J. Vis, A.K. Smilde, E.J.J. van Velzen, J.P.M. van Duijnhoven, F.A. van Dorsten, Assessment of PLSDA cross validation, Metabolo-mics 4 (2008) 81–89.
[32] P. Filzmoser, B. Liebmann, K. Varmuza, Repeated double cross validation, J. Chemom. 23 (2009) 160–171.
[33] S. Ji, J. Ye, Generalized linear discriminant analysis: a unified framework and efficient model selection, Neural Netw. IEEE Trans. 19 (2008) 1768–1782. [34] W. Du, T. Gu, L.-J. Tang, J.-H. Jiang, H.-L. Wu, G.-L. Shen, R.-Q. Yu, Unimodal transform
of variables selected by interval segmentation purity for classification tree modeling of high-dimensional microarray data, Talanta 85 (2011) 1689–1694.
[35] D.M. Harlan, J.M. Graff, D.J. Stumpo, R.L. Eddy, T.B. Shows, J.M. Boyle, P.J. Blackshear, The human myristoylated alanine-rich C kinase substrate (MARCKS) gene (MACS). Analysis of its gene product, promoter, and chromosomal localization, J. Biol. Chem. 266 (1991) 14399–14405.
[36] T. Macalma, J. Otte, M.E. Hensler, S.M. Bockholt, H.A. Louis, M. Kalff-Suske, K. Heinz-Grzeschik, D. von der Ahe, C. Beckerle, Molecular characterization of human zyxin, J. Biol. Chem. 271 (1996) 31470–31478.
[37] M.L. Smith, R. Arch, L.L. Smith, N. Bainton, M. Neat, C. Taylor, D. Bonnet, J.D. Cavenagh, T. Andrew Lister, J. Fitzgibbon, Development of a human acute myeloid leukaemia screening panel and consequent identification of novel gene mutation in FLT3 and CCND3, Br. J. Haematol. 128 (2005) 318–323.
[38] J.H. Cho, D. Lee, J.H. Park, K. Kim, I.B. Lee, Optimal approach for classification of acute leukemia subtypes based on gene expression data, Biotechnol. Prog. 18 (2002) 847–854.
[39]E. Magyarosy, A. Sebestyen, J. Timar, Expression of metastasis associated proteins, CD44v6 and NM23-H1, in pediatric acute lymphoblastic leukemia, Anticancer Res. 21 (2000) 819–823.
[40]N. Niitsu, J. Okabe-Kado, M. Nakayama, N. Wakimoto, A. Sakashita, N. Maseki, K. Motoyoshi, M. Umeda, Y. Honma, Plasma levels of the differentiation inhibitory fac-tor nm23-H1 protein and their clinical implications in acute myelogenous leukemia, Blood 96 (2000) 1080–1086.
[41]J. Okabe-Kado, T. Kasukabe, Y. Honma, Differentiation inhibitory factor Nm23 as a prognostic factor for acute myeloid leukemia, Leuk. Lymphoma 32 (1998) 19–28. [42]R.A. Gatenby, R.J. Gillies, Why do cancers have high aerobic glycolysis? Nat. Rev.
Cancer 4 (2004) 891–899.
[43] A.A. Alizadeh, M.B. Eisen, R.E. Davis, C. Ma, I.S. Lossos, A. Rosenwald, J.C. Boldrick, H. Sabet, T. Tran, X. Yu, Distinct types of diffuse large B-cell lymphoma identified by gene expression profiling, Nature 403 (2000) 503–511.
[44] Y. Xu, T.F. Sumter, R. Bhattacharya, A. Tesfaye, E.J. Fuchs, L.J. Wood, D.L. Huso, L.M.S. Resar, The HMG-I oncogene causes highly penetrant, aggressive lymphoid malig-nancy in transgenic mice and is overexpressed in human leukemia, Cancer Res. 64 (2004) 3371–3375.
[45] S. Pirnes-Karhu, E. Jantunen, P. Mantymaa, S. Mustjoki, L. Alhonen, A. Uimari, Spermidine/spermine N(1)-acetyltransferase activity associates with white blood cell count in myeloid leukemias, Exp. Hematol. 42 (2014) 574–580.
[46] J.M. Deutsch, Algorithm forfinding optimal gene sets in microarray prediction, arXiv preprint physics/0108011, 2001.