NOWCASTING AND FORECASTING THUNDERSTORMS FOR AIR TRAFFIC WITH AN INTEGRATED FORECAST SYSTEM BASED ON OBSERVATIONS AND MODEL DATA NOWCASTING AND FORECASTING THUNDERSTORMS FOR AIR TRAFFIC WITH AN INTEGRATED FORECAST SYSTEM BASED ON OBSERVATIONS AND MODEL DATA
Caroline Forster* and Arnold Tafferner* Caroline Forster* and Arnold Tafferner*
*Deutsches Zentrum für Luft- und Raumfahrt (DLR), Institut für Physik der Atmosphäre (IPA), Oberpfaffenhofen, D-82234 Wessling, Germany
*Deutsches Zentrum für Luft- und Raumfahrt (DLR), Institut für Physik der Atmosphäre (IPA), Oberpfaffenhofen, D-82234 Wessling, Germany
Abstract: This study presents the concept and first results of the Weather Forecast User Oriented System Including Object Nowcasting (WxFUSION), an integrated system using observations and numerical model data to nowcast and forecast weather hazards for air traffic. WxFUSION is currently under development within the project “Wetter und Fliegen” (“Weather and Flying”) under the lead of the Institute of Atmospheric Physics (IPA) at DLR. The paper gives an overview on the concept of WxFUSION and on-going work.
Abstract: This study presents the concept and first results of the Weather Forecast User Oriented System Including Object Nowcasting (WxFUSION), an integrated system using observations and numerical model data to nowcast and forecast weather hazards for air traffic. WxFUSION is currently under development within the project “Wetter und Fliegen” (“Weather and Flying”) under the lead of the Institute of Atmospheric Physics (IPA) at DLR. The paper gives an overview on the concept of WxFUSION and on-going work.
1 THE “WETTER UND FLIEGEN” PROJECT
In Germany, a new project has started in 2008 under the leadership of the Institute of Atmospheric Physics (IPA) at the German Aerospace Center (DLR) in Oberpfaffenhofen, named “Wetter und Fliegen” (“Weather and Flying”). This DLR project aims at increasing safety and efficiency of air traffic and to secure the competitiveness of German and European aviation industry. In order to reach this high level goal two main systems are being constructed:
• Integrated airport weather systems for the airports Frankfurt and Munich comprising the components “wake vortices”, “thunderstorms” and “winter weather”
• On board systems for steering and monitoring as well as ground based information systems in order to improve flying characteristics in case of turbulence, wake vortices and thunderstorms.
In this paper, we present the central element of weather systems part with regard to thunderstorms by introducing the Weather Forecast User Oriented System Including Object Nowcasting for thunderstorms (WxFUSION-Cb).
2 WXFUSION-CB CONCEPT
Thunderstorms are complex phenomena in space and time which appear in various sizes, from small single convective cells to mesoscale convective complexes and thunderstorm lines with corresponding life times from a few minutes to several hours. Remote sensing with satellite, radar and lightning enables to detect detailed information about these features. Nowcasting tools enable short-range forecasts of these features, and high resolution numerical models provide forecasts on the time range up to several hours. WxFUSION-Cb aims at combining these different data sources accordingly in order to detect, track, nowcast (0-1 hrs) and forecast (1-6 hrs) thunderstorms. The combination has the benefit that the assertions of the individual tools, e.g. with regard to the exact location of a particular weather system, its intensity and movement, can be processed and contrasted. Thus, the system provides a more reliable interpretation of the future state of a weather system than only one data source or forecasting tool could give [Tafferner et al., 2008a].
In WxFUSION-Cb, thunderstroms are represented as target weather objects (TWO) which can be selected by the user and are simplified pictures of a thunderstorm encompassing hazard areas
for air traffic. A TWO consists of a Cb top volume representing the turbulent anvil area and a Cb bottom volume representing areas of heavy rain, hail, and turbulence (Figure 1). Note that the horizontal shape of the top and bottom volumes in Figure 1 is rendered elliptically for simplicity, but is polygon shaped in real applications.
Figure 1: A thunderstorm rendered as an idealized target weather object (TWO) with top and bottom volume (redrawn from Tafferner et al. 2008b).
The Cb top volumes are detected from space by using the cloud tracker Cb-TRAM, an algorithm for the detection and nowcasting of convection using Meteosat SEVIRI (Spinning Enhanced Visible and Infra-Red Imager) data [Zinner et al. 2008]. The broad-band high-resolution visible (HRV), water vapour (WV), and two different infra-red (IR) channels are combined to identify three different stages of thunderstorm development: convection initiation, rapid vertical development, and mature thunderstorm cells reaching or even overshooting the tropopause. During daytime the HRV is used to detect the most active convective updraft regions by exploring the gradients in reflectivity in the HRV satellite image. The tracking of the cells is based on the geographical overlap between current detections and first guess patterns of cells detected in preceding time steps. The first guess patterns are retrieved by using displacement vectors provided by a so-called pyramidal image-matching algorithm [Zinner et al., 2008] which extracts the general transformation vector field from two consecutive satellite images thereby describing the cloud motion and local cloud developments.
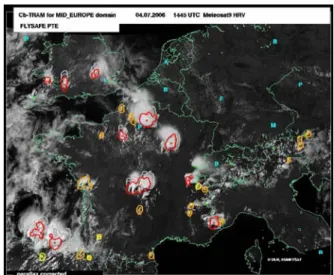
Figure 2: METEOSAT 9 HRV image and Cb top volumes detected with Cb-TRAM on 4 July 2006 at 14:45 UTC. Yellow contours indicate convective initiation, orange contours indicate rapid vertical development and red contours indicate mature thunderstorms. The 15 and 30 minutes nowcasts are marked by grey contours.
Similar to the first guess patterns, nowcasts up to 60 minutes are generated by extrapolation using these transformation vector fields. Figure 2 shows an example of Cb top volumes including their 15 and 30 minutes nowcasts over middle Europe. Note that Cb-TRAM does not encircle the whole anvil area of the thunderstorms, but is able to find the most turbulent areas within the anvil.
Figure 3: European radar composite from the DWD with Cb bottom volumes (black contours) detected by Rad-TRAM on 17 August 2008 at 17:00 UTC. The grey contours indicate the 30 minutes nowcast. The black lines are the tracks of the individual cells.
The Cb bottom volumes of TWOs are detected by using the Rad-TRAM algorithm [Kober and Tafferner, 2009] which detects and nowcasts heavy rain from the European radar composite of the German Weather Service (DWD). A reflectivity threshold of 37 dBZ is used to identify cells of heavy rain. The tracking and nowcasting up to 60
minutes is based on the same pyramidal image matcher as in Cb-TRAM [Zinner et al., 2008] and therefore allows to describe both the motion of the precipitation cells and changes in size. Figure 3 shows an example of Rad-TRAM including 30 minutes nowcasts.
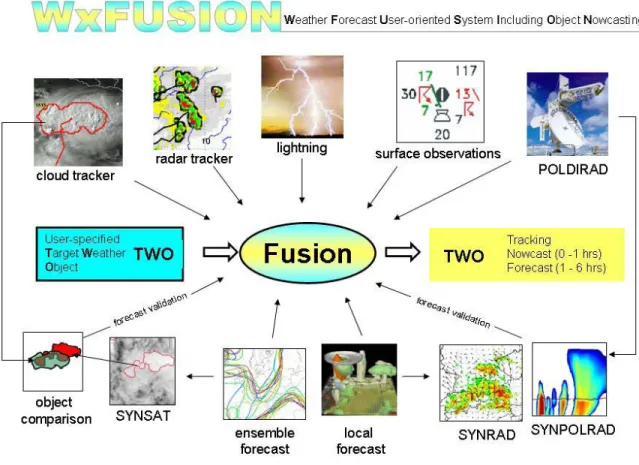
Figure 4: Schematic diagram of the WxFUSION concept. User specified target weather objects (TWO) are characterized by appropriate information through a fusion of selected nowcast information (upper half) and forecast products (lower half) (from Forster and Tafferner, 2008).
The basic concept of WxFUSION-Cb is outlined in Figure 4 (Forster and Tafferner, 2008). The upper half in Fig. 4 represents data sources from observations and nowcasting tools which are used to nowcast TWOs up to one hour, while the lower half represents data sources from numerical model simulations for forecasting TWO beyond 1 hour. In addition to the cloud tracker Cb-TRAM and the radar tracker Rad-TRAM, lightning data from the LINET system [Betz et al., 2004] are used in
WxFUSION-Cb. Surface weather observations together with TEMP and AMDAR data are intended to be used for winter weather TWOs primarily, whereas the DLR polarization diversity Doppler radar (POLDIRAD) [Schroth et al., 1988] serves both thunderstorm and winter weather objects with hydrometeor information. The numerical model simulations for both local high resolution and regional-scale ensemble forecasts are provided operationally by the COSMO-DE and COSMO-EU models, respectively, from the DWD [Steppeler et
al., 2003; Saunders et al., 1999]. Both models also generate synthetic satellite imagery and synthetic radar reflectivity indicated as the tools named SYNSAT and SYNRAD, respectively, in Fig. 4. The ability of numerical models to reproduce the formation and interactions of hydrometeors can be assessed with the synthetic polarimetric radar forward operator (SYNPOLRAD) [Pfeifer et al., 2008.] which can be compared with POLDIRAD observations.
The use of these numerical model forecasts for the time range one to several hours will be controlled by a method called “forecast validation” (Fig. 4), where forecasted TWOs derived by SYNSAT are compared against observations of TWOs detected from METEOSAT (described in more detail in section 4). Another possibility to assess the forecast quality is to apply the forecast quality measure (FQM) developed at DLR [Keil and Craig, 2007]. Thereby the pyramidal image matching algorithm applied to observed and synthetic images is used in combination with the local squared difference field to calculate the FQM measure. Both methods, the forecast validation by object comparison and the FQM can be used to select the best forecast available, e.g. out of an ensemble, which can then be used for extending the forecast horizon beyond one hour. In this case the future state of a TWO will be described probabilistically and not deterministically,
The WxFUSION-Cb core element “FUSION” on the one hand applies graphical methods to overlay data from the different sources and extract relevant information about the TWO in place, and on the other hand uses fuzzy logic to characterize the intensity of a TWO (described in more detail in section 3). Future extensions will also estimate the probability of occurrence of a particular weather hazard of pre-defined intensity, related to user requirements within a specified region. In summary, the core element “FUSION” returns the nowcast (0-1 hour) and the probabilistic forecast (up to several hours) of a TWO and extracts
specific attributes and weather elements of the TWO describing its history, current state and future. Attributes for nowcast objects are e.g. moving speed, moving direction, developing stage (growing/decaying), and severity level (moderate/severe). Weather elements are e.g. heavy rain, hail, lightning. For the probabilistic time range, risk areas of heavy precipitation, hail, turbulence, and wind will be output from the system. The final information for the user is then tailored in a short, clear, and precise manner in order to enable quick decision making. 3 USING FUZZY LOGIC TO DETERMINE CB INTENSITY
Fuzzy logic is generally used in the fields of systems control, electronics, and traffic engineering. It generates solutions to problems based on vague, ambiguos, qualitative, and incomplete or imprecise information (Murtha, 1995; Viot, 1993). Meanwhile, fuzzy logic has been used for a variety of applications in meteorology (e.g. Müller et al., 2003; Kessinger et al., 2001; Sharman et al., 2000). It allows to account for imprecise observations and forecasts and also to deal with parameter ranges instead of fixed thresholds. The binary true-false decision is eliminated, instead a gradual transition from true to false is possible. For instance, a temperature of 18°C can partly be classified as a warm temperature and partly be classified as a cool temperature.
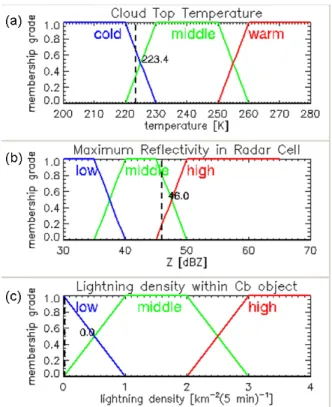
In WxFUSION-Cb we developed and implemented a fuzzy logic algorithm that uses mathematical functions based on conceptual models and expert knowledge in combination in order to characterize a TWO with regard to its intensity. TWO attributes derived from three different data sources are used for this purpose: the minimum cloud top temperature within the TWO (from Cb-TRAM), the maximum reflectivity within the TWO (from Rad-TRAM), and the lightning density within the TWO (from LINET data). In a first step, input fuzzy sets composed of membership functions for different categories are created for each of the three attributes (Figure 5). Please note that these
fuzzy sets are derived solely from experience and can be adjusted by experimenting with multiple data sets. The membership functions are simple triangles or trapezoids overlapping each other. In the example in Fig. 5, the TWO had a minimum cloud top temperature of 223.4 K, a maximum reflectivity of 46 dBZ, and a very low lightning density of near 0 km-2(5 min)-1. The cloud top temperature in this example is classified partly as cold (65%) and partly as middle cold (35%), the reflectivity is classified as 85% middle and 15% high, the lightning density is classified 100% as low.
Figure 5: Fuzzy input sets with membership functions for the three attributes minimum cloud top temperature (a), maximum reflectivity (b) and lightning density (c).
Employing an if-then rule base combines the membership grades with five thunderstorm intensity classes: very weak, weak, average, strong and very strong. Using the centre of gravity method the grades are then de-fuzzyfied into a Cb intensity value (Figure 6). For instance, if the cloud top temperature falls within cold, the maximum reflectivity and the lightning density are classified as high, then the Cb intensity would be very strong and would get a high intensity value. The
example values from Fig. 5 in combination achieve a Cb intensity value of 6.2, resulting from input membership grades grades 65% for the category strong and to 35% for the category average.
Figure 6: Fuzzy output sets for Cb intensity.
Currently, the fuzzy logic algorithm to determine Cb intensity is checked and tuned by applying it in several case studies. For combining nowcasts of TWOs with forecast data from the best model available fuzzy logic will be employed as well. Necessarily, additional input fuzzy sets will have to be set up for parameters provided by the forecast models, as e.g. humidy, convective potential, lift, and others.
4 FORECAST VALIDATION BY OBJECT COMPARISON
Traditional approaches for the verification of convective forecasts are based on simple grid overlays in which the forecast field is matched to an observation field or a set of observation points (Brown et al., 2004). Contingency tables are compiled which can then be used to compute verification measures and skill scores, such as the Probability of Detection (POD), False Alarm Ratio (FAR), and Critical Success Index (CSI). For details on the scores see e.g. Wilks 1995 and Doswell et al. 1990.
The skill scores, however, pose a variety of problems which are illustrated in Figure 7. Five examples of forecast/observation pairs are shown, with the forecasts and observations represented as objects, which could be e.g. TWOs from WxFUSION. From a visual inspection, case (a) appears to be a fairly good forecast, just offset somewhat to the right. (b) is a poorer forecast since the location error is much
larger than for (a). In (c) forecast area is much too large and is offset to the right. (d) shows a situation where the forecast is both offset and has the wrong shape. (e) shows some overlap of forecast and observation, but the forecast is much too large and has the wrong shape. Of the given examples, it appears that case (a) renders the "best” forecast. However, from an assesment with traditional skill scores all of the first four examples (a-d) have identical verification statistics with POD=0, FAR=1, and CSI=0, indicating no skill. Thus, the verification approach is insensitive to differences in location and shape errors. Similar insensitivity could be shown to be associated with timing errors. Moreover, example (e), which seems to be the worst forecast of all examples, actually has some skill (POD, CSI >0), suggesting it is a better forecast than the one in example (a).
Figure 7: Schematic example of various forecast (F) and observation (O) combinations (from Brown et al., 2004).
From the examples in Fig.7 we learn that traditional skill scores are not useful to asses the quality of a forecast of a TWO. Therefore, we develop a verfication method based on an object-oriented approach. Several object-oriented approaches have been designed by e.g. Ebert and McBride (2000), Davis et al., (2006a,b), Nachamkin (2004) or Marzban and Sandgathe (2006). Here, we propose a method that compares TWOs from a numerical forecast to observed TWOs by comparing their specific attributes
and weather elements. If there is reasonable agreement between the attributes and weather elements of the observed and forecasted TWOs, the forecasted TWO as well as forecast fields like CAPE and triggering temperatures will be used in the “FUSION” module of WxFUSION-Cb to predict the observed TWOs beyond the nowcasting horizon. The object comparison is illustrated for Cb top volumes with a case study in the following.
In order to obtain Cb top volumes from a numerical model forecast, Cb-TRAM has been adapted to detect Cb top volumes in synthetic satellite images, e.g. as forecasted by the COSMO-DE model [Steppeler et al., 2003]. This version of CB-TRAM is called Cb-TRAMCOSMO in the following. The COSMO-DE model provides WV and IR brightness temperatures derived with the aid of the radiative transfer model RTTOV-7 [Saunders et al., 1999]. Unfortunately, HRV information is not available from this algorithm. Therefore, updraft regions cannot be isolated with Cb-TRAMCOSMO, and the diagnosed Cb top volumes might be somewhat larger than with the usual detection procedure which uses also the visible channel. In order to enable a fair comparison of the synthetic top volumes detected by Cb-TRAMCOSMO with the observed Cb top volumes, the observed Cb top volumes are detected by Cb-TRAM without using the HRV in the following.
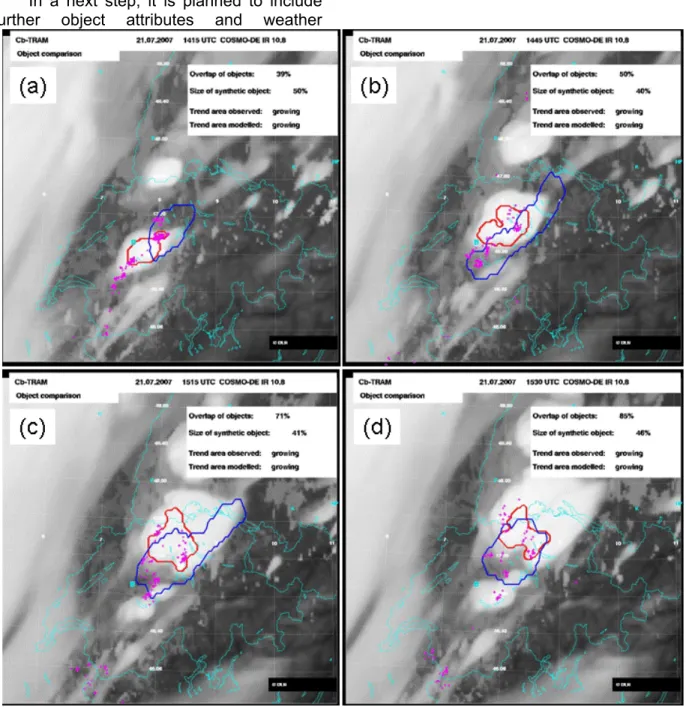
Fig. 8 shows a comparison of forecasted synthetic top volumes with observed top volumes for thunderstorms over Switzerland on 21 July 2007. The Cb top contours are superimposed on the IR brightness temperatures forecasted by the 00 UTC COSMO-DE model run.
Cb-TRAMCOSMO could successfully be applied to
the synthetic data. The comparison of the synthetic with the observed objects is quite good keeping in mind the long forecast times. At all times in Fig. 8, the shapes of the synthetic and the observed objects are different and the size of the synthetic object is about half of the size of the observed one, but the positions of the object pairs are similar. Between 39% (Fig. 8a) and 85%
(Fig. 8d) of the area of the synthetic top volume overlaps with the observed one. The forecast indicates a growing top volume moving in a north-eastern direction in good agreement with the observation. From the comparison of all these attributes, it is concluded in this case that the forecast is good enough to be used in the FUSION module for further predictions of the evolution of the thunderstorm.
In a next step, it is planned to include further object attributes and weather
elements into the comparison, and to find an appropriate criterion to classify a forecast as “good”. Then the method will be applied to ensemble forecasts in order to select the best forecast available. If the algorithm does not identify any of the forecasts as a “good” one, the numerical model results are not used to further predict the TWOs evolution. In this case, only nowcasting results and observations will be applied.
Figure 8: Comparison of forecasted synthetic top volumes (red contours) with observed top volumes (blue contours) of mature thunderstorms detected by Cb-TRAMCOSMO and Cb-TRAM, respectively, over Switzerland at (a) 14:15 UTC and (b) 14:45 UTC, (c)
15:15 UTC and (d) 15:30 UTC on 21 July 2007. The background is the IR 10.8 μm synthetic satellite image forecasted by the 00 UTC COSMO-DE model run.
5 SUMMARY AND PERSPECTIVE
This paper presented on-going work with regard to the integrated thunderstorm forecast system for air traffic, WxFUSION-Cb, which is currently under development within the project “Wetter und Fliegen” (“Weather and Flying”) at the Institute of Atmospheric Physics at the German Aerospace Center (DLR). The system combines different data sources from observations, nowcasting tools and numerical forecasts in order to detect, nowcast (0-1 hour) and forecast (up to several hours) thunderstorms. The latter are represented as target weather objects encompassing hazard areas for air traffic. The combination of the data sources is done by different techniques like fuzzy logic, object-based forecast verification, and probabilistic nowcasting. On-going work regarding the fuzzy logic algorithm and the object based comparison of forecasted and observed TWOs has been presented.
In 2010, WxFUSION-Cb will be operated in real-time at the airports in Munich and Frankfurt, Germany, in order to test its nowcasting and forecasting skills and demonstrate the benefits for the user (e.g. weather providers for air traffic management and pilots). After the testing phase, it is envisaged to install it operationally for use at these airports in close collaboration with the German Weather Service (DWD).
REFERENCES
Betz, H.-D., Schmidt, K., Oettinger, W. P., and Wirz, M.:Lightning detection with 3D-discrimination of intracloud and cloud-to-ground discharges, Geophys. Res. Lett., 31, L11108, doi:10.1029/2004GL019821, 2004.
Brown, B., R. R. Bullock, C. A. Davis, J. H. Gotway, M. B. Chapman, A. Takacs, E. Gilleland, K. Manning, New verfication approaches for convective weather forecasts. Preprints, 11th Conf. on Aviation, Range, and Aerospace, Hyannis, MA, Amer. Meteor. Soc., 9.4.
[Available online at
http://ams.confex.com/ams/pdfpapers/8 2068.pdf.], 2004
Davis C, Brown B, Bullock R., Object-based verification of precipitation forecasts. Part I: methodology and application to Mesoscale Rain Areas. Monthly Weather Review 134: 1772–1784, 2006a.
Davis C, Brown B, Bullock R., Object-based verification of precipitation forecasts. Part II: application to convective rain systems. Monthly Weather Review 134: 1785–1795, 2006b
Doswell, C.A., R. Davies-Jones, and D.L. Keller, On summary measures of skill in rare event forecasting based on contingency tables. Weather and Forecasting, 5, 576-585, 1990
Ebert EE, McBride JL, Verification of precipitation in weather systems: Determination of systematic errors. Journal of Hydrology 239: 179–202, 2000
Forster, C., and A. Tafferner, An integrated user-oriented weather forecast system for air traffic using real-time observations and model data, 26th International Congress of the Aeronautical Sciences (ICAS), Anchorage, Alaska, 14 -19 September 2008, International Council of the Aeronautical Sciences Conf. Proc. (8.6.2), Optimage Ltd., Edinburgh, UK, ISBN 0-9533991-9-2, 2008.
Keil, C., and G. Craig, A displacement-based error measure applied in a regional ensemble forecasting system, Monthly Weather Review, 135, 3248-3259, DOI:10.1175/MWR3457.1, 2007.
Kessinger, C., S. Ellis, J. Van Andel, NEXRAD data quality: The AP clutter mitigation scheme. Preprints, 30th Conference on Radar Meteorology, Munich, Germany, Amer. Meteor. Soc., 707-709, 2001.
Kober, K., A. Tafferner, Tracking and Nowcasting of convective cells using remote sensing data from radar and
satellite, Meteorologische Zeitschrift, Vol. 1, No. 18, 075-084, 2009.
Marzban C, Sandgathe S., Cluster analysis for verification of precipitation fields. Weather and Forecasting 21: 824–838, 2006.
Mueller, C., et al. NCAR Auto-Nowcast System, Weather and Forecasting, Vol. 18, 545-561, 2003.
Murtha, J., Applications of fuzzy logic in operational meteorology, Scientific Services and Professional Development Newsletter, Canadian Forces Weather Service, 42-54, 1995.
Nachamkin JE., Mesoscale verification using meteorological composites. Monthly Weather Review 132, 941–955, 2004 Pfeifer, M., Craig, G., Hagen, M., Keil, C., A
polarimetric radar forward operator for model evaluation. J. Appl. Meteorology and Climatology, in press, 2008.
Tafferner, A., C. Forster, M. Hagen, C. Keil, T. Zinner, H. Volkert: Development and Propagation of Severe Thunderstorms in the Upper Danube Catchment Area: Towards an Integrated Nowcasting and Forecasting System using Real-time Data and High-resolution Simulations, Meteorol Atmos Phys, DOI 10.1007/s00703-008-0322-7, 2008a
Tafferner, A., C. Forster , S. Senesi, Y. Guillou, P. Laroche, A. Delannoy, B. Lunnon, D. Turb, T. Hauf, D. Markovic: Nowcasting thunderstorm hazards for flight operations: the Cb WIMS approach in FLYSAFE, 26th International Congress of the Aeronautical Sciences (ICAS), Anchorage, Alaska, 14 -19 September 2008, International Council of the Aeronautical Sciences Conf. Proc. (8.6.2), Optimage Ltd., Edinburgh, UK, S. 1 - 10, ISBN 0-9533991-9-2, 2008b. Saunders, R., M. Matricardi, P. Brunel, An
improved radiative transfer model for assimilation of satellite radiance observations, Quart. J. Roy. Meteor. Soc., 125, 1407-1425, 1999.
Schroth, A.C., M.S. Chandra and P.F. Meischner, A C band coherent polarimetric radar for propagation and
cloud physics research. J. Atmos. Ocean. Techn., 5, 803-822, 1988.
Sharman, R., B. G. Brown, S. Dettling, Preliminary results of the NCAR Integrated Turbulence Forecating Algorithm (IFTA) to forecast CAT. Preprints, Ninth Conference on Aviation, Range, and Aerospace Meteorology, Orlando, FL, Mer. Meteor. Soc., 460 – 465, 2000.
Steppeler, J., G. Doms, U. Schättler, H. W. Bitzer, A. Gassmann, U. Damrath, and G. Gregoric, Meso-gamma scale forecasts using the nonhydrostatic model LM, Meteorol. Atmos. Phys., 82, 75–96, DOI 10.1007/s00703-001-0592-9, 2003.
Viot, G., Fuzzy logic in C, Dr. Dobb’s Journal, February 1993.
Wilks, D.S., Statistical Methods in the Atmospheric Sciences. Academic Press, 467 pp., 1995
Zinner, T., H. Mannstein, A. Tafferner, Cb-TRAM: Tracking and monitoring severe convection from onset over rapid development to mature phase using multi-channel Meteosat-8 SEVIRI data, Meteorol Atmos Phys, DOI 10.1007/s00703-008-0290-y, 2008.