Lawrence Berkeley National Laboratory
Recent Work
Title
Cooking shapes the structure and function of the gut microbiome
Permalink
https://escholarship.org/uc/item/4233t8j8Journal
Nature Microbiology, 4(12)ISSN
2058-5276Author
Turnbaugh, PeterPublication Date
2019-12-01DOI
10.1038/s41564-019-0569-4 Peer reviewedCooking shapes the structure and function of the gut
microbiome
Rachel N. Carmody1,2,3,*, Jordan E. Bisanz1, Benjamin P. Bowen4,5, Corinne F. Maurice2,6, Svetlana Lyalina7, Katherine B. Louie4,5, Daniel Treen4,5, Katia S. Chadaideh3, Vayu Maini Rekdal8, Elizabeth N. Bess1, Peter Spanogiannopoulos1, Qi Yan Ang1, Kylynda C. Bauer2, Thomas W. Balon9, Katherine S. Pollard7, Trent R. Northen4,5, Peter J. Turnbaugh1,2,10,* 1Department of Microbiology & Immunology, University of California San Francisco, 513 Parnassus Avenue, San Francisco, CA 94143, USA
2Center for Systems Biology, Harvard University, 52 Oxford Street, Cambridge, MA 02138, USA 3Department of Human Evolutionary Biology, Harvard University, 11 Divinity Avenue, Cambridge, MA 02138, USA
4Environmental Genomics and Systems Biology Division, Lawrence Berkeley National Laboratory, 1 Cyclotron Road, Berkeley, CA 94720, USA
5DOE Joint Genome Institute, 2800 Mitchell Drive, Walnut Creek, CA 94598, USA
6Department of Microbiology & Immunology, Microbiome and Disease Tolerance Centre, McGill University, Montreal, QC, Canada
7Gladstone Institutes, University of California San Francisco, 1650 Owens Street, San Francisco, CA 94158, USA
8Department of Chemistry and Chemical Biology, Harvard University, 12 Oxford Street, Cambridge, MA 02138, USA
9Department of Medicine, Metabolic Phenotyping Core and In Vivo Imaging System Core, Boston University, 670 Albany Street, Boston, MA 02118, USA
10Chan Zuckerberg Biohub, San Francisco, CA 94158, USA.
Users may view, print, copy, and download text and data-mine the content in such documents, for the purposes of academic research, subject always to the full Conditions of use:http://www.nature.com/authors/editorial_policies/license.html#terms
*Correspondence and requests for materials should be addressed to: Peter J. Turnbaugh, Associate Professor, Department of Microbiology & Immunology, University of California, San Francisco, 513 Parnassus Avenue HSW 1529, San Francisco, CA 94143, [email protected], (415) 502-3237, Rachel N. Carmody, Assistant Professor, Department of Human Evolutionary Biology, Harvard University, 11 Divinity Avenue, 5th Floor, Cambridge, MA 02138, [email protected], (617) 495-0846.
Author contributions
R.N.C. and P.J.T. designed the study. R.N.C. and K.S.C. performed the animal experiments. R.N.C., K.S.C. and V.M.R. performed the human experiments. R.N.C., J.E.B., K.S.C. and P.J.T. performed 16S rDNA sequencing and/or associated data analysis. R.N.C. and J.E.B. performed qPCR and associated data analysis. R.N.C., J.E.B., S.L., K.S.P. and P.J.T. performed microbial RNA sequencing and/or associated data analysis. Q.Y.A. performed bomb calorimetry. J.E.B., B.P.B., K.B.L., D.T., E.N.B., T.R.N. and P.J.T. performed metabolomics assays and/or associated data analysis. C.F.M. and K.C.B. performed microbial physiology assays and associated data analysis. P.S. performed in vitro growth experiments and associated data analysis. T.W.B. validated and performed measurements of body composition in mice. R.N.C., J.E.B. and P.J.T. wrote the manuscript with input from all co-authors.
HHS Public Access
Author manuscript
Nat Microbiol
. Author manuscript; available in PMC 2020 March 30.Published in final edited form as:
Nat Microbiol. 2019 December ; 4(12): 2052–2063. doi:10.1038/s41564-019-0569-4.
A
uthor Man
uscr
ipt
A
uthor Man
uscr
ipt
A
uthor Man
uscr
ipt
A
uthor Man
uscr
ipt
Diet is a critical determinant of variation in gut microbial structure and function,
outweighing even host genetics1–3. Numerous microbiome studies have compared diets with divergent ingredients1–5, but the everyday practice of cooking remains unclear. Here, we show that a plant diet served raw versus cooked reshapes the murine gut microbiome, with effects attributable to improvements in starch digestibility and degradation of plant-derived compounds. Shifts in the gut microbiota modulated host energy status, applied across multiple starch-rich plants, and were detectable in humans. Thus, diet-driven host-microbial interactions depend on the food as well as its form. Since cooking is human-specific, ubiquitous and ancient6,7, our results prompt the hypothesis that humans and our microbiomes co-evolved under unique cooking-related pressures.
Heat alters the physicochemical properties of foods in ways that could impact the gut microbiome. Cooking increases the ileal digestibility of carbohydrates by gelatinizing starch6,8, reducing the quantity reaching the colon, where the most numerous microbial community resides, and potentially affecting the fermentation capability of amylolytic gut bacteria9. Cooking can also denature antimicrobial compounds present naturally in food or introduced through agriculture10,11, thus limiting their bioactivity. Here, we interrogate the impact of cooking on the gut microbiome, as well as downstream impacts on host energy status.
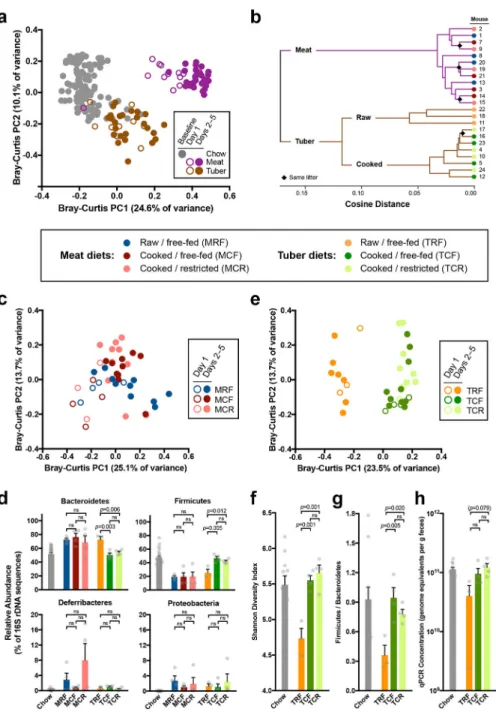
To gauge the overall influence of cooking, we conducted 16S rDNA sequencing and shotgun sequencing of microbial RNA in distal gut samples collected from conventional mice reared for 5 days on organic lean beef or organic sweet potato served raw or cooked
(Supplementary Fig. 1a, Supplementary Table 1a). These foods were chosen for their importance in past and present human diets12, diverse macronutrient profiles, and prior evidence of cooking influencing nutrient bioavailability6, antimicrobial properties13, and host energy balance12. Among mice fed cooked meals, half were free-fed, and half received a restricted ration calibrated to produce ~1g weight loss, allowing us to investigate the effects of cooking separately from those of changes in host energy gain associated with cooking. Ration restriction led to predictable reductions in caloric intake and body mass (Supplementary Fig. 1b–c). Among free-fed tuber diets, cooked diets were associated with lower caloric intakes but higher body mass outcomes, confirming that cooking increases net energy gain from this substrate12. We observed rapid and reproducible changes in gut microbial structure and function among mice fed meat versus tuber (Fig. 1a–b,
Supplementary Fig. 1d–h, Supplementary Table 2a–c, Supplementary Notes), with effects paralleling those observed in an earlier study of humans consuming animal-based versus plant-based diets5.
Cooking impacted the gut microbiome differently on meat versus tuber diets. The gut microbiomes of mice fed raw and cooked meat were similar in composition and
transcriptional profile (Fig. 1b–d, Supplementary Fig. 1d–e), although we were still able to detect 12 modules and 68 orthologous groups with significant differences in expression (Supplementary Table 3a–b). By contrast, the gut microbiomes of mice fed raw and cooked tuber were fundamentally distinct. Microbial community structure in tuber-fed mice was explained primarily by processing, a pattern evident within 24h of diet initiation (R=0.624, p<0.05, ANOSIMDay1samples;Fig. 1e). Consuming raw versus cooked tuber led to lower α
-A
uthor Man
uscr
ipt
A
uthor Man
uscr
ipt
A
uthor Man
uscr
ipt
A
uthor Man
uscr
ipt
diversity, marginally lower bacterial abundance, and a rise in the relative proportion of Bacteroidetes, a phylum with broad capabilities for glycan degradation14,15 (Fig. 1d,f–h. Supplementary Table 4a). By contrast, gut microbial community structure on the cooked tuber diet resembled that at baseline, when mice were consuming a chow composed primarily of cooked plants. Because raw-fed mice lost more weight than cooked-fed mice (Supplementary Fig. 1c), we tested and confirmed that the effects of processing dominated those of experimental factors related to energy status, such as ration restriction and changes in body mass over various timescales (Supplementary Table 4b), a pattern also apparent in RNAseq-based analysis of host tissues7. Community-wide gene expression profiles clustered by processing for tuber diets (Fig. 1b, Supplementary Fig. 1d), representing significant differences in 174 modules and 1,419 orthologous groups (Supplementary Table 4c–d). The microbial communities of raw-fed hosts showed higher expression of genes for the
metabolism of starch and sugar (ko00051, ko00500) and xenobiotic compounds (ko00980, ko00982) (Supplementary Table 4c), consistent with our expectations of lower digestibility and higher xenobiotic load in raw sweet potato. In addition, when compared against the Carbohydrate Active Enzymes (CAZy) database, β-amylase (GH14/EC3.2.1.2) emerged as one of two enzyme families distinguishing raw versus cooked tuber samples (FDR<0.05), the other being a broad glycosyltransferase family (GT2).
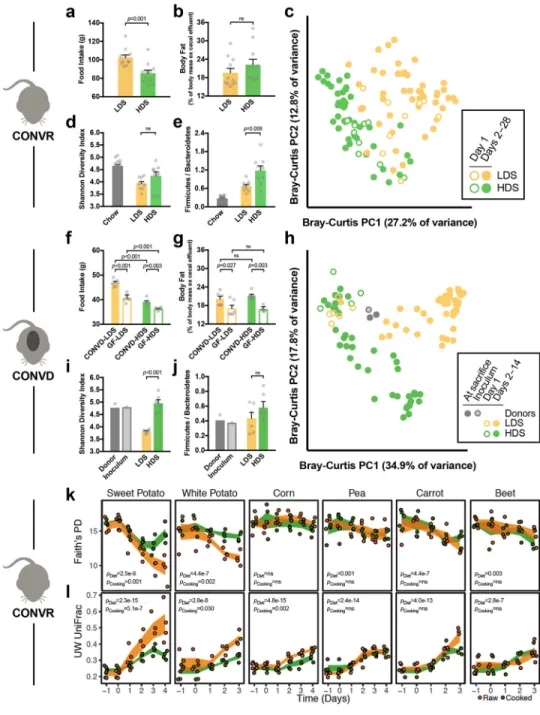
Apart from water, raw sweet potato tubers are composed principally of starch (44% of dry mass; Supplementary Table 1a). Cooking transforms this starch through gelatinization, whereby native semi-crystalline granules of amylopectin and amylose are degraded into amorphous structures susceptible to amylase digestion, increasing their absorption in the small intestine6,8,16. We reasoned that microbial communities could be sensitive to the reduced fraction of cooked starch reaching the colon, and its altered structure17, and therefore tested whether we could recapitulate the effects of raw versus cooked tuber diets on the gut microbiome by manipulating starch digestibility. We reared conventional mice for 28 days on macronutrient-matched chows differing only in the ileal digestibility of their starch fraction (50% w/w) (Supplementary Fig. 2a, Supplementary Table 1b). Despite lesser chow and starch consumption (Fig. 2a, Supplementary Fig. 2b), mice consuming high-digestibility starch (HDS) had body masses and fat levels similar to those of mice consuming low-digestibility starch (LDS) (Fig. 2b, Supplementary Fig. 2c), a result reflecting the higher energetic returns to the host of starch digested in the small intestine versus colon18. Mirroring patterns observed on the raw tuber diet, LDS- versus HDS-feeding led to microbial community divergence (R=0.840, p<0.01, ANOSIMDay28samples; Fig. 2c),
with the LDS diet resulting in lower bacterial abundance, lower proportions of Firmicutes versus Bacteroidetes, and a trend towards lower α-diversity (Fig. 2d–e, Supplementary Fig. 2d, Supplementary Table 5). We replicated this experiment in germ-free mice colonized with a common inoculum, confirming higher fecal energy loss in LDS-fed versus HDS-fed animals, and observing changes in community structure, α-diversity, and Firmicutes/ Bacteroidetes relative abundance that paralleled those observed in conventional animals (Fig. 2f–j, Supplementary Fig. 2e–h, Supplementary Table 5). Thus, gut microbial responses to altered starch digestibility recapitulated key patterns observed in mice fed raw versus cooked tuber.
A
uthor Man
uscr
ipt
A
uthor Man
uscr
ipt
A
uthor Man
uscr
ipt
A
uthor Man
uscr
ipt
If starch digestibility is a key factor shaping the gut microbiota, we should expect to see stronger effects of cooking in rich foods versus low-starch foods, and among starch-rich foods, greater effects of cooking where the ileal digestibility of the raw starch is lower. To test these ideas, we conducted an expanded set of experiments in sweet potato and five other common plant foods: white potato, corn, pea, carrot, and beet. These foods were chosen to include a mix of starch-rich (sweet potato, white potato, corn, pea) and low-starch (carrot, beet) items, and starches with lower (sweet potato, white potato) and higher (corn, pea) digestibility when raw (Supplementary Fig. 3a–d, Supplementary Tables 1c,6). These experiments support the importance of starch digestibility as a driver of microbial changes with cooking; however, we cannot exclude some contribution of diet-induced changes to host physiology. For both α-diversity and β-diversity, we found evidence of divergent microbial signatures for sweet potato and white potato, the foods with a high quantity of low-digestibility starch (Fig. 2k–l). In contrast, there were no consistent microbial effects of cooking for low-starch foods (beet, carrot) or foods with a high quantity of high-digestibility starch (corn, pea), despite all foods showing detectable intervention effects (Fig. 2k–l, Supplementary Fig. 3e–g).
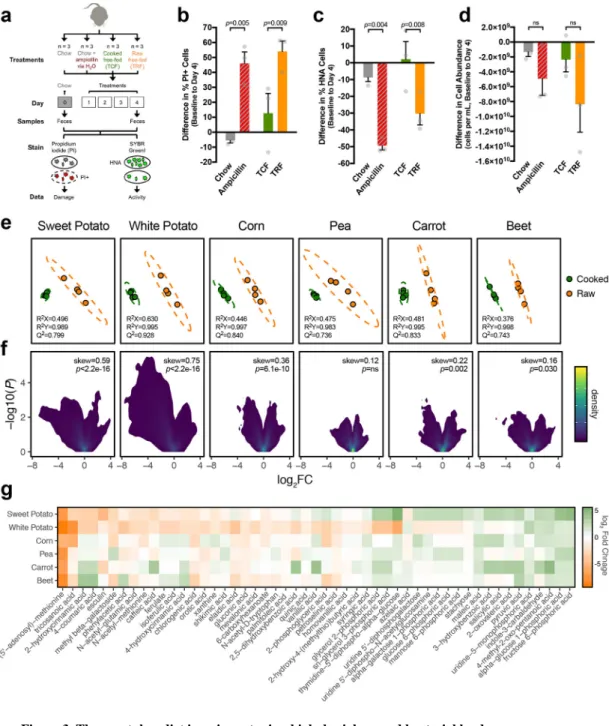
Heat can also affect non-starch plant components, including defense compounds10. To gauge the potential impact of heat-sensitive plant-derived antimicrobial compounds on the gut microbiome, we used fluorescent cell staining19,20 to examine gut microbial physiology in mice consuming diets of raw or cooked tuber, chow, or chow plus the broad-spectrum antibiotic ampicillin as a positive control (Fig. 3a). Using flow cytometry, we quantified microbial cells in fresh fecal pellets that exhibited membrane damage (propidium iodide [PI] stain) and/or high nucleic acid content [HNA] indicating cellular activity19 (SYBRGreenI stain). Prior to diet treatment, all mice displayed low levels of microbial cell damage (proportion of PI+ cells: 6.6±1.6%), high levels of activity (proportion of HNA cells: 50.3±8.4%), and dense bacterial abundances (cells per mL suspension: 4.8×10⁹±1.4×10⁹). Relative to baseline values, the raw tuber and ampicillin-treated groups exhibited increases in gut microbial cell damage and decreases in cell activity and bacterial load that were not observed in the cooked tuber or standard chow groups (Fig. 3b–d).
Metabolomics was used to identify putative antimicrobial factors. While each of the six plant foods studied had a distinct composition, we found a consistent signature of cooking in each substrate (Fig. 3e, Supplementary Fig. 4a). Global analysis of metabolite features revealed that cooking caused compositional changes in all plant foods, with sweet potato and white potato exhibiting the greatest shifts and skew towards reduced metabolite complexity (Fig. 3f, Supplementary Fig. 4b). Using targeted analysis, a total of 246 total compounds were identified, 185 of which were high-confidence unambiguous assignments, and 51 of which were significantly different (FDR<0.1 and |log2FC|>1) in raw versus cooked sweet
potato and/or white potato (Fig. 3g, Supplementary Fig. 4c, Supplementary Table 7). We prioritized candidates with prior evidence of antimicrobial activity and sensitivity to heat-induced degradation (Supplementary Table 8). Chlorogenic acid and its downstream metabolite caffeic acid emerged as promising candidates; however, in vitro, ex vivo and in vivo assays failed to confirm antimicrobial effects in these isolated compounds
(Supplementary Fig. 5a–i, Supplementary Table 9). Multiple additional compounds with known antibacterial effects were significantly decreased in cooked tubers, including
4-A
uthor Man
uscr
ipt
A
uthor Man
uscr
ipt
A
uthor Man
uscr
ipt
A
uthor Man
uscr
ipt
hydroxycinnamic acid, ferulate, and vanillic acid21–23; these and others may act in concert to impact gut bacterial physiology. Together, these results are consistent with our observation that raw tubers upregulate microbial pathways for xenobiotic metabolism (Supplementary Table 4c) and the broader hypothesis that plant-derived compounds with heat-sensitive antimicrobial properties impair gut microbial physiology. However, it remains possible that gut microbial physiology is sensitive to additional cooking-related factors acting in concert, such altered physical access to nutrients, changes in microbe-microbe interactions, and host-driven changes in the luminal environment.
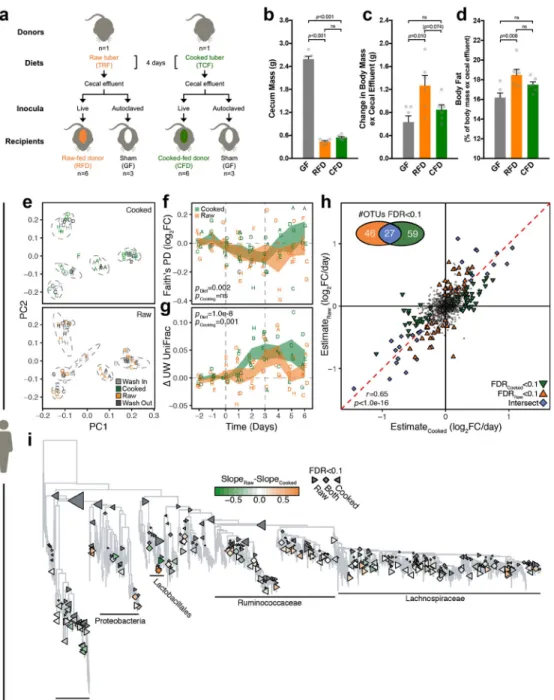
Next, we sought to determine the consequences of cooking-induced shifts in the gut microbiota for host energy balance. Reduced starch digestibility in the small intestine might select for colonic bacteria capable of fermenting starch or shape other host-microbial interactions affecting energy balance. Increased antimicrobial activity arising from higher xenobiotic load may also confer anabolic effects akin to those observed with low-dose antibiotic administration24,25. To assess effects on host energy balance, we transplanted gut microbiotas conditioned on raw versus cooked tuber diets into germ-free mice fed chow (Fig. 4a). The gut microbial communities of donors and recipients clustered together (Supplementary Fig. 6a), with donor diet explaining the majority of variation observed in recipient communities at all timepoints following the first transitional 24h post-gavage. As expected, controlling for routine colonization-associated decreases in cecal effluent, inoculation had positive effects on body mass and adiposity (Fig. 4b–d). The recipients of the raw-fed gut microbiota exhibited increased body mass and adiposity relative to cooked-fed recipients (Fig. 4c–d) despite producing feces with higher energy content compared with the cooked-fed donor group (Supplementary Fig. 6b). This seeming contradiction could be explained by increased caloric intake in the raw-fed microbiota recipients (Supplementary Fig. 6c), highlighting the importance of host-microbial interactions for satiety26,27. To evaluate the relevance of these effects in humans, we fed healthy participants matched raw and cooked plant-based diets over two three-day diet interventions, in counterbalanced order (Supplementary Fig. 7a, Supplementary Table 1d–e). We observed no consistent differences in body mass, caloric or macronutrient intake between diets (Supplementary Fig. 7b–g, Supplementary Table 10). Gut microbial communities clustered strongly by
participant (Fig. 4e), explaining >60% of variance regardless of the distance metric used (Supplementary Table 11). Analyses of α-diversity and β-diversity that controlled for participant, the order of diet presentation, and time on diet revealed a significant effect of the dietary intervention (Fig. 4f–g). Surprisingly, α-diversity decreased on our plant-based diets, potentially in response to the limited ingredients used and menu repetition across days. Treatment responses differed by participant, but across the cohort there was a significant effect of cooking on gut microbial β-diversity (Fig. 4g, Supplementary Fig. 8a–c). On cooked diets, changes in the gut microbiota were detectable within 48h (p=0.019, linear mixed effect model with TukeyHSD) and persisted until Day 5 (p=0.019) (Fig. 4g).
However, the raw diet generated a later response, becoming significant at 72h (p=0.038) and lingering for only 24h post-intervention (p=0.044). Most diet-responsive OTUs were uniquely enriched on either raw or cooked diets, spanning multiple taxonomic groups (Fig. 4h–i).
A
uthor Man
uscr
ipt
A
uthor Man
uscr
ipt
A
uthor Man
uscr
ipt
A
uthor Man
uscr
ipt
Taken together, our results show that cooking plants rich in low-digestibility starch, a routine part of daily life, can have profound impacts on the gut microbiome, consistent with recent in vitro data28. Accordingly, future microbiome studies should control for or at minimum report food preparation alongside caloric and macronutrient content. The observation that everyday foods disrupt gut bacterial physiology when consumed raw raises opportunities for mining the human diet for therapeutics and prompts a polypharmacological view of the interactions between the gut microbiome and dietary small molecules29. Finally, these results emphasize that humans and our microbiomes were both affected by the adoption of habitual cooking, perhaps helping to explain accelerated gut microbial change in the human lineage30 and encouraging steps toward a microbiome-informed understanding of human evolution.
Methods
Methods summary
Experiments were performed under the guidance of the Animal Care and Use Committee and Committee on the Use of Human Subjects at Harvard University, and the Harvard Medical Area Standing Committee on Animals. To interrogate the impact of a cooked diet on the gut microbiome, we collected distal gut samples from conventional or gnotobiotic mice or human volunteers fed whole-food diets of plant items or meat served raw or cooked, or custom chows differing in starch digestibility or xenobiotic load. We used 16S rDNA sequencing with barcoded V4 primers (515F-806R) to assess gut microbial community structure, qPCR with these same primers or flow cytometry with fluorescent bead standards to assess community abundance, microbial RNAseq to assess gene transcription, gas chromatography to assess short-chain fatty acid production, and fluorescent cell staining with propidium iodide (PI) and SYBRGreenI to assess microbial physiology. 16S rDNA sequence data were processed using the Quantitative Insights into Microbial Ecology (QIIME) software package version 1.8.031, with microbial biomarker discovery performed using LEfSe32 and/or linear mixed effects models33 where appropriate. Microbial RNAseq data were analyzed for differential expression using limma34 with voom35, with gene set enrichment analysis conducted via ROAST36. Fluorescence and scatter profiles were analyzed in FlowJo following published protocols19 to deliver proportions of bacterial cells with membrane damage (PI+) and distinct activity based on nucleic acid content, as measured with SYBRGreenI. To probe food-derived compounds contributing to these effects, we profiled raw and cooked plant food extracts by mass spectrometry37, using standards to confirm the identity of metabolites rendered differentially abundant by cooking.
Animal and human experiments
Approvals.—Conventional mouse experiments were conducted in the Biological Research Infrastructure (BRI) barrier facility at Harvard University under the supervision of the Harvard University Animal Care and Use Committee (Protocol #17-06-306 and #12–06). Gnotobiotic mouse experiments were conducted in the Gnotobiotics Core at Brigham & Women’s Hospital under the supervision of the Harvard Medical Area Standing Committee on Animals (Protocol #04805). Sample sizes for early animal experiments were determined based on prior findings of substantial diet-induced differences in hepatic gene expression7;
A
uthor Man
uscr
ipt
A
uthor Man
uscr
ipt
A
uthor Man
uscr
ipt
A
uthor Man
uscr
ipt
sample sizes for follow-up studies were selected in reference to these initial experiments. Human experiments were conducted with informed written consent under the supervision of the Harvard University Committee on the Use of Human Subjects (Protocol #IRB17–1016). Although blinding was not practical, Core staff blind to the study hypotheses were
responsible for the randomized assignment of conventional and gnotobiotic mice to cage, isolator, and treatment groups. Our human experiments were performed based on a crossover design, with treatment order determined by computer-based randomization.
Gut microbial community structure and function in mice fed whole-food meat or tuber (WF) diets.
We fed mice diets of meat or tuber served raw or cooked to (a) investigate the gut microbial impacts of consuming a whole-food diet in raw versus cooked form (Supplementary Fig. 1a), and (b) validate that the murine gut microbial community responds rapidly and reproducibly to shifts in whole-food diets (Supplementary Notes). Animal models: Male BALB/c mice (n=24, 4 sets of 6 littermates) were acquired from Charles River Laboratories at 21 days of age and co-housed with littermates under standard BRI conditions (ventilated cages including cob bedding and enrichment (no running wheels); ad libitum chow and water; 12 h light/dark cycle beginning at 0600). At 8 weeks of age, mice were housed individually in cages fitted with a wire mesh floor to minimize coprophagy. To prevent contamination and loss of diet beneath the mesh floor, diets were administered in Pyrex Petri dishes with weighted tops bearing four symmetrical feeding holes. Mice acclimated to this experimental setup for 3 days before the start of diet manipulations. Sample sizes for this initial study were based on prior findings of substantial diet-induced differences in hepatic gene expression in these same animals7; sample sizes for follow-up studies targeting underlying mechanisms were selected in reference to this initial study. Experimental diets: Diets consisted of organic lean beef eye round roast (Bos taurus) or organic orange-fleshed sweet potato tubers (Ipomoea batatas L. ‘Beauregard’) sourced fresh daily and served either raw, cooked, or cooked but in a restricted ration that allowed us to evaluate the effects of a cooked diet given negative energy status. Full details of the food preparation procedure have been published elsewhere7. Briefly, for raw treatments, meat and tubers were sliced into standard cuboids and weighed into unlimited rations (MRF [meat/raw/free-fed]: 20.0±0.3 g; TRF [tuber/raw/free-fed]: 40.0±0.5 g). For cooked meat treatments, raw cuboids were weighed into rations (MCF [meat/cooked/free-fed]: 20.0±0.3 g; MCR [meat/cooked/ restricted]: 10.0±0.3 g) and roasted in covered Pyrex Petri dishes at 200°C for 12 min, resulting in internal temperatures of 65–70°C. For cooked tuber treatments, raw cuboids were weighed into rations (TCF [tuber/cooked/free-fed]: 40.0±0.5 g, TCR [tuber/cooked/ restricted]: 20.0±0.3 g) and roasted in foil packets at 204°C for 25 min, a protocol confirmed by polarized light microscopy to gelatinize starch, then transferred into Pyrex Petri feeding dishes. Once cooled, diets were sealed with parafilm and fed within 3 h of preparation. Technical replicates prepared from the same starting materials were analyzed for energy and macronutrient content using standard biochemical assays (Supplementary Table 1a). Sample
collection: Mice were reared for 5 days on MRF, MCF, MCR, TRF, TCF, or TCR diets (n=4
per diet), with littermates randomized symmetrically across diet groups. Diets were
presented at the same time each day to give a standardized data collection cycle. During this daily intervention, mice were weighed during a period of inactivity and duplicate fresh fecal
A
uthor Man
uscr
ipt
A
uthor Man
uscr
ipt
A
uthor Man
uscr
ipt
A
uthor Man
uscr
ipt
samples were collected and flash-frozen in liquid nitrogen. Food refusals from the past 24 h were collected, weighed to monitor fresh weight intake, and later freeze-dried to determine dry weight intake. At the end of the feeding trial, mice were fasted overnight (12 h) to promote consumption of food on demand. Two hours before sacrifice, mice were presented with their assigned diets and in all cases began eating immediately. Body mass was taken immediately prior to euthanization via CO2 inhalation. Duplicate ~200 mg samples of cecal
effluent were collected within 3 min of death using sterile, RNase-free instruments and flash-frozen in liquid nitrogen. Fecal and cecal samples were stored at -80°C until analysis. One mouse in the TRF group was euthanized after 4 days due to >20% weight loss, in accordance with our IACUC protocol; samples from this animal were excluded from all analyses.
Gut microbiota in mice fed chows differing in digestibility (DG) or xenobiotic (XB) load.—We fed mice custom chows differing in starch digestibility (Supplementary Fig. 2a) or chlorogenic acid content (Supplementary Fig. 5f) to evaluate digestibility and xenobiotic load as potential mechanisms underlying the microbial changes observed on raw versus cooked tuber diets. Animal models: C57BL/6J mice aged 6–12 weeks (n=46) were bred in-house and co-housed in groups of 3–5 under standard BRI conditions (see above) until their recruitment into a study. A total of 22 mice (12 male, 10 female) and 24 mice (12 male, 12 female) were used in the comparisons of starch digestibility or chlorogenic acid content, respectively. Prior to the study, mice were individually housed in standard ventilated cages with multiple forms of enrichment (nestlet, shack, and cylinder; no running wheels) and allowed 3 days to acclimate to this set-up before the start of diet manipulations.
Experimental diets: We used custom semi-purified or grain-based chows manufactured by
Envigo/Teklad (Supplementary Table 1b). DG chows were semi-purified and were matched in all ingredients except for the source of the starch fraction (50% w/w), which was known to be either highly resistant to mammalian amylases (low-digestibility starch [LDS] diet, based on high-amylose resistant starch; TD.140475) or highly susceptible (high-digestibility starch [HDS] diet, based on high-amylopectin waxy maize starch; TD.140474). XB chows represented the inclusion or exclusion of 1% w/w chlorogenic acid ([CGA], C3878, Sigma-Aldrich) in both grain-based low-fat and semi-purified high-fat diet conditions (LF: TD. 96338; LF+CGA: TD.140472; HF: TD.08811; HF+CGA: TD.140473). All diets were irradiated by the manufacturer and stored in their original vacuum-sealed pouches until feeding. Sample collection: Mice were reared for 28 days on LDS, HDS, LF, LF+CGA, HF, or HF+CGA diets (n=6–11 per diet), with littermates randomized symmetrically across groups in either the digestibility or xenobiotic trials. Just prior to the start of diet
administration (Day 0) and on Days 1–3, 7, 14, and 28, mice were weighed during a period of inactivity, food weights were recorded to establish intake, and duplicate fresh fecal samples were collected and flash-frozen in liquid nitrogen. Fecal samples were stored at -80°C until analysis. At the end of the feeding trial, mice were sacrificed by cervical
dislocation under isoflurane anesthesia. We weighed the cecum both full and empty to assess the mass of cecal contents, and returned the empty cecum to the body cavity before storage at -80°C. Analysis of body composition was performed on thawed carcasses at 37°C via MRI scan (EchoMRI-700), after validating that this protocol closely replicated
measurements obtained in vivo (Supplementary Notes).
A
uthor Man
uscr
ipt
A
uthor Man
uscr
ipt
A
uthor Man
uscr
ipt
A
uthor Man
uscr
ipt
Gut microbiota in mice fed six plant food (PF) diets.—To confirm starch
digestibility as a key mechanism shaping the gut microbial response to cooking, we fed mice raw or cooked versions of six common plant foods varying in starch content and degree of starch digestibility (Supplementary Fig. 3a). Animal models: Female 6-week old C57BL/6J mice (n=48, 4 sets of 12 cagemates) were sourced from Jackson Laboratories. Mice were acclimated upon arrival to the BRI, during which they were cohoused under standard BRI conditions (see above). At the start of the experimental treatment, mice were individually housed in standard cages with bedding and enrichment (no running wheels) for the duration of the study. Diets were administered in plastic Petri dishes magnetically bound to the bottom of the cage. Cages were changed daily, and old cage bedding was saved to collect and weigh food refusals. Experimental diets: Diets consisted of organic orange-fleshed sweet potato tubers (Ipomoea batatas L. ‘Beauregard’), organic russet potato tubers
(Solanum tuberosum ’Russet Burbank’), organic pre-frozen raw green peas (Pisum sativum), organic pre-frozen raw whole kernel sweet corn (Zea mays convar. Saccharata var. rugosa), organic carrot (Daucus carota subsp. sativus), and organic beetroot (Beta vulgaris). Fresh vegetables were diced into standard cuboids (see above), and pre-frozen vegetables were thawed to room temperature. Diets were prepared fresh daily and served either raw or cooked. For raw treatments, all vegetables were weighed into unlimited rations [30.0±0.9 g]. For cooked treatments, all vegetables were weighed into unlimited rations [30.0±0.9 g] then roasted in individual foil packets for 25 min at 204°C. Technical replicates were prepared for each dietary condition, sourced from the starting materials on each day of food preparation.
Sample collection: Mice were randomized symmetrically across diet treatments and reared
for a minimum of 3 days on one of 12 diets: raw or cooked sweet potato, raw or cooked white potato, raw or cooked corn, raw or cooked peas, raw or cooked carrot, or raw or cooked beet (n=4 animals per treatment). Diets were administered at the same time each day to allow for a standardized data collection schedule. During this time, mice were weighed, and duplicate fresh fecal samples were collected and flash-frozen in liquid nitrogen. Food refusals left in the Petri dish from the prior 24 h were collected and weighed, cages were changed, and old bedding was sifted for residual food refusals. Fecal samples were stored at -80°C until analysis. We terminated the dietary intervention for the white potato, carrot, and beet diet groups after 3 days due to >20% weight loss, in accordance with our IACUC protocol.
Microbial physiology.—We used a validated flow cytometry assay19 to evaluate the physiological consequences for the gut microbiota of raw versus cooked tuber diets (Fig. 3a) and two hypothetical candidates for the antimicrobial impact of raw tuber, chlorogenic acid and caffeic acid (Supplementary Fig. 5b). Animal models: Female C57BL/6J mice aged 6– 12 weeks (3 sets of 4 littermates for the tuber experiment, 3 sets of 3 littermates for the antimicrobial candidate experiment) were bred in-house and co-housed in their litter groups under standard BRI conditions (see above). Prior to each study, mice were individually housed and allowed 24 h to acclimate to this set-up before the start of treatments. Within each study, littermates were randomized symmetrically across treatments. Sample
collection: For the tuber experiment, mice were reared for 4 days on TRF, TCF, ad libitum chow, or ad libitum chow plus 0.1% w/w pharmaceutical-grade ampicillin administered via water supply using light-shielded bottles. For the compound experiment, mice were reared
A
uthor Man
uscr
ipt
A
uthor Man
uscr
ipt
A
uthor Man
uscr
ipt
A
uthor Man
uscr
ipt
for 4 days on ad libitum chow with a light-shielded water supply containing either 1% chlorogenic acid, 1% caffeic acid, or no additive. Diets were presented at the same time each day to give a standardized data collection cycle, with compounds in water refreshed after 2 days. During this daily intervention, mice were weighed during a period of inactivity, and fresh fecal samples were collected into tubes flushed with CO2 and transferred into an
anaerobic chamber (Coy Laboratory Products) containing 5% H2 / 10% CO2 / 85% N2 for
immediate processing. All samples were processed within 10 min of production.
Gnotobiotic experiments.—To establish the microbial consequences of diets under conditions in which the gut microbiota was tightly controlled, we conducted experiments with germ-free mice. Our experiments tested, respectively, the impacts on host net energy gain following inoculation with microbes pre-conditioned on raw versus cooked tuber diets (GB1; Fig. 4a), and microbial response to LDS versus HDS diets in gnotobiotic mice conventionalized with a shared gut microbiota (GB2; Supplementary Fig. 2e). Animal
models: In each experiment, donor animals were 8-week-old conventionally raised
C57BL/6J littermates that were bred and maintained under standard BRI conditions (GB1: females, n=2; GB2: males, n=2). Prior to their recruitment into the study, donors were individually housed and allowed 3 days to acclimate to this set-up before the start of diet manipulations (GB1) or sacrifice (GB2). In each experiment, recipient animals were male 8-week-old germ-free C57BL/6 mice that were bred and maintained under standard
Gnotobiotics Core conditions (positive-pressure flexible film isolator with open top cages containing cob bedding; no running wheels; ad libitum autoclaved chow and water; 12 h light/dark cycle beginning at 0700) until their recruitment into studies at 8 weeks of age (GB1: n=18; GB2: n=24). Mice sharing the same inoculation status were housed together in the same isolator and mice fed the same diet within an isolator were co-housed in groups of 3. Sample collection: In GB1, donors were reared for 4 days on TRF (n=1) or TCF (n=1) diets, defined and prepared as described above. Each day, donors were weighed during a period of inactivity, food refusals from the past 24 h were collected and weighed to verify consumption, and duplicate fresh fecal samples were collected and flash-frozen in liquid nitrogen. In GB2, donors remained chow-fed until sacrifice. On the transplant day, donors were transported in their closed cages to the Gnotobiotics Core facility and sacrificed via cervical dislocation under isoflurane anesthesia. To minimize oxygen reaching the gut microbiota during preparation of the cecal-based inocula, hemostats were used to clamp just proximal and distal to ceca before their excision. Clamped ceca were immediately
transferred into an anaerobic chamber (Coy Laboratory Products) containing 5% H2 / 10%
CO2 / 85% N2 and the inocula were prepared by diluting cecal contents 1:20 in reduced
phosphate-buffered saline, vortexing to mix, spinning down, and taking the supernatant. In GB1, within each group of germ-free mice receiving raw-conditioned or cooked-conditioned inocula, 6 recipients were gavaged with 200 μl of the live inoculum and 3 were gavaged with 200 μl of autoclaved inoculum (negative control) that was verified as inactive by culture. GB1 recipients were then maintained for 14 days on a standard gnotobiotic diet of
autoclaved chow. In GB2, 12 germ-free recipients received 200 μl of live inoculum (pooled from 2 donor animals to ensure sufficient volume), 6 received 200 μl of autoclaved
inoculum, and 6 were not gavaged. Half of the recipients in each of these three colonization groups were maintained for 14 days on the LDS diet and the other half on the HDS diet. In
A
uthor Man
uscr
ipt
A
uthor Man
uscr
ipt
A
uthor Man
uscr
ipt
A
uthor Man
uscr
ipt
both experiments, just prior to gavage (Day 0) and on Days 1–5, 8, 11, and 14, recipients were weighed, food intake was measured by subtraction from the prior hopper weight, and duplicate fresh fecal samples were collected and flash-frozen in liquid nitrogen. Fecal samples were stored at -80°C until analysis. On Day 14, mice were removed from their isolators and sacrificed by cervical dislocation under isoflurane anesthesia. We assessed the mass of cecal contents, and retained the carcass (ex cecal effluent) for analysis of body composition by MRI.
Gut microbiota in humans fed raw and cooked plant-based diets (HC).—To assess whether cooking alters the gut microbiota in humans, we fed volunteers matched plant-based meals served in raw and cooked forms, based on a counterbalanced crossover study design (Supplementary Fig. 7a). Participants: After obtaining written informed consent, we enrolled 8 healthy adults (3 men, 5 women) from within the Harvard University community. Participants were non-smokers with no history of gastrointestinal disease, allergy to diet ingredients, or antibiotic use within 60 days of enrollment. Each participant completed two 9-day intervention arms, one involving raw foods and one involving cooked foods, with a 1-month period between arms. The order of diet treatments was
counterbalanced across participants and was determined by computer randomization at the time of study enrollment. Experimental diets: We enlisted a professional chef to design a nutritionally adequate menu of plant-based (vegan, organic, gluten-free) meals and snacks that could be served in exclusively raw or exclusively cooked forms, with raw and cooked menus containing identical ingredients in identical proportions (Supplementary Fig. 7a, Supplementary Table 1d–e). We achieved dietary equivalence between raw and cooked menus (Supplementary Fig. 7d–g) by preparing mastermixes of all raw meal and snack components, reserving half of each mastermix for the raw treatment, and preparing the other half by roasting (lunch, dinner, nuts) or boiling (breakfast, smoothie, carrots) for the cooked treatment. All menu items were fed ad libitum, with food consumption determined by weighing refusals of all menu items separately. Sample collection: For each of two
intervention arms, participants were asked to provide fecal samples on 9 consecutive days: 3 prior to the start of the dietary intervention (wash-in period; Days -2, 1, 0), when participants were consuming their habitual foods and beverages; 3 during the dietary intervention, when participants consumed only study-provided meals and snacks, plus water and up to one cup of black coffee or black tea per day; and 3 following the dietary intervention (wash-out period: Days 4, 5, 6), when participants returned to their habitual feeding and drinking patterns (Supplementary Fig. 8a). Participants kept detailed logs of food and beverage consumption for each 9-day intervention arm, and were weighed on each day of the dietary intervention, and these logs suggested strong compliance with the study protocol. Fecal samples were stored for up to 24 hours in a home freezer before being transferred to the lab for storage at -80°C until analysis.
16S rDNA sequencing and analysis
Microbial DNA was isolated using the PowerSoil bacterial DNA extraction kit (MoBio) and PCR-amplified using barcoded universal bacterial primers targeting the V4 region of the 16S rRNA gene (515F and 806R). The following thermocycler protocol was used: 94°C for 3 min, 35 cycles of 94°C for 45 sec, 50°C for 30 s, and 72°C for 90 s, with a final extension at
A
uthor Man
uscr
ipt
A
uthor Man
uscr
ipt
A
uthor Man
uscr
ipt
A
uthor Man
uscr
ipt
72°C for 10 min38,39. Triplicate reactions for each sample were pooled and amplification was confirmed by 1.5% gel electrophoresis. 16S rDNA amplicons were cleaned with AmpureXP beads (Agencourt), quantified using the Quant-iT Picogreen dsDNA Assay Kit (Invitrogen), and pooled evenly by DNA content. Pools were sequenced using the Illumina HiSeq (conventional mouse and human experiments) or MiSeq (gnotobiotic experiments) platforms, generating 2×100 bp (WF), 1×150 bp (DG, XB, PF, HC) or 250/150 bp (GB1, GB2) sequences (Supplementary Table 12). Sequences were analyzed on the Harvard Odyssey and UCSF QB3 computational clusters using the QIIME (Quantitative Insights into Microbial Ecology) software package version 1.8.031. Operational taxonomic units (OTUs) were picked at 97% similarity against the Greengenes database40, which we trimmed to span only the 16S rDNA region flanked by our sequencing primers (positions 521–773). We characterized a large number of reads per sample [WF: 174,582±3,193; DG: 92,049±1,864; XB: 86,774±1,505; GB1: 29,733±1,190; GB2: 33,159±1,300; PF: 143,960±4082; HC: 42,772±894]. All sequences were used for the comparison of the relative abundance of bacterial taxonomic groups. To ensure unbiased generation of diversity metrics sensitive to sampling depth, each dataset was randomly subsampled at a depth that retained nearly all of the individual samples [WF: 50,000; DG, XB: 30,000; GB1, GB2: 15,000; PF: 40,924; HC: 19,339]. Alpha diversity metrics were generated using either alpha_diversity.py (QIIME) or Vegan v2.5–241 and Picante v1.742 (R). Microbial biomarker discovery, as identified in text, was performed on the subsampled datasets using the LEfSe algorithm32 after filtering out species-level OTUs with <100 sequences or present in only 1 sample and treating |LDA|≥2 as the threshold for significance. Permutation-based analyses of microbial community distances (ANOSIM, ADONIS, and PERMANOVA) were performed using
compare_categories.py (QIIME) or the Adonis function of Vegan v2.5–2 (R), with 999 permutations per test. To avoid pseudoreplication in these tests, datasets were either trimmed to a single sample per subject, as specified in the text, or the participant/mouse identifiers were used as strata for permutation. In all cases, ANOSIM and PERMANOVA tests supported the same conclusions, therefore we report only ANOSIM results everywhere except the Supplementary Tables. For the PF experiment, longitudinal data was analyzed using linear mixed effects models with the package lmerTest33 and the formula:
y~Cooked*TimeOnDiet + (1|MouseID) where y represents the metric being tested. For the HC experiment, a similar formula was applied: y~Cooked*TimeOnDiet + Phase + (1| ParticipantID). In both experiments, the interaction between cooking and time on diet was taken to represent a significant difference between cooked and raw food consumption. Multiple testing correction was carried out by a false discovery rate correction (Benjamini-Hochberg). In both the PF and HC experiments: OTU-level abundance analysis was carried out using centered log2-transformation with count zero multiplicative replacement43 before
testing using linear mixed effects models. Phylogenetic node testing was carried out using the phylogenetic isometric log ratio transformation of PhILR version 1.6.044 after removal of OTUs not present in at least 3 samples with a total of 10 reads.
Microbial RNAseq
We conducted a metatranscriptomic analysis of microbial community-wide gene expression in cecal samples harvested from mice fed whole-food diets of meat or tuber served raw or cooked. Cecal effluent was collected and flash-frozen in liquid nitrogen within 3 min of host
A
uthor Man
uscr
ipt
A
uthor Man
uscr
ipt
A
uthor Man
uscr
ipt
A
uthor Man
uscr
ipt
death. Microbial cells were lysed by bead-beater (BioSpec Products) and total RNA was extracted with phenol:chloroform:isoamyl alcohol (pH 4.5, 125:24:1, Ambion 9720). Total RNA was purified using the Ambion MEGAClear Kit (Life Technologies) and rRNA was depleted via Ambion MICROBExpress subtractive hybridization (Life Technologies) and custom depletion oligonucleotides. The absence of genomic DNA contamination was confirmed by PCR with universal 16S primers (8F and 1391R). cDNA was synthesized using SuperScript II and random hexamers (Life Technologies), followed by second-strand synthesis with RNaseH and E. coli DNA polymerase (New England Biolabs). Samples were fragmented enzymatically (E6040L and M0348S, New England Biolabs) and Illumina sequencing libraries were prepared on an Apollo 324 instrument using the PrepX mRNA Library Preparation Kit (WaferGen Biosystems). Libraries were quantified by quantitative PCR (qPCR) on a Stratagene MX3000P qPCR System (Agilent) using ABsolute qPCR SYBR Green ROX Mix (Thermo Scientific). The size distribution of each library was quantified by Agilent Bioanalyzer using an HS-DNA chip, and sample libraries were pooled evenly. The fully multiplexed pool was sequenced in 3 separate runs of an Illumina HiSeq (Supplementary Table 13), with strong reproducibility across runs (Supplementary Fig. 1d). To analyze the metatranscriptomic data, we quality controlled the FASTQ files with fastq-mcf45 and removed rRNA reads using the database provided by SortMeRNA46. We removed host-originating reads by discarding sequences mapped by kallisto47 to the mouse
transcriptome (GRCm38.rel79). To obtain counts of KEGG48 orthologs, we used translated search with DIAMOND49 and retained results with an E-value<0.01. Our analyses were based on KEGG release 58.1. As a final cleaning step, matches to animal versions of KOs were excluded, as were KOs associated with <1 read on average. Having obtained a set of KO counts for each sample, we then used the limma34 package in R along with its voom35 extension to evaluate differential expression while controlling for differences in sequencing depth and batch effects. The abundance metric used by limma is log counts per million, obtained by dividing the count of classified reads for each KEGG ortholog by the total number of reads submitted to DIAMOND for classification. Per-observation weights were generated by the voom procedure. To find higher level patterns among the top genes, we ran gene set analyses with ROAST36. To visualize the dissimilarities between the
metatranscriptomes, Ward.D2 hierarchical clustering was performed using a matrix of cosine distances and the hclust function in R. Prior to computing the distance matrix, batch effects resulting from sequencing replicates were removed with the limma package.
Quantitative PCR (qPCR) analysis
To quantify absolute bacterial abundance, we conducted qPCR using the same V4 primers employed in 16S rDNA sequencing (515F and 806R). For each reaction, template DNA at ~5 ng/μL was diluted 1:100, and 2 μL was combined with 12.5 μL ABsolute qPCR SYBR Green ROX Mix (Thermo Scientific), 6 μL nuclease-free H2O, and 2.25 μL of each primer
(450 nM final concentration). The following program was run on a Stratagene MX3000P qPCR System (Agilent): 95°C for 15 min, followed by 40 cycles of 95°C for 15 s, 50°C for 40 s, and 72°C for 30 s. A melting curve was performed after amplification to distinguish targeted and non-targeted PCR products. All reactions were performed in duplicate, with the mean value used for statistical analyses. Reaction concentrations were quantified against a standard curve created using serial two-fold dilutions of pure culture Akkermansia
A
uthor Man
uscr
ipt
A
uthor Man
uscr
ipt
A
uthor Man
uscr
ipt
A
uthor Man
uscr
ipt
muciniphila (DSM 22959) genomic DNA of known concentration plus a non-template control (all standard curves, r2≥0.99). Bacterial DNA per gram of feces was determined by adjusting for the dilutions performed during DNA isolation (1:50), normalization to ~5 ng/ μL (various), and qPCR set-up (1:100), and dividing this gross concentration by the grams of feces utilized for the original DNA isolation (various). We report absolute bacterial
community abundance in genome equivalents, where the murine gut microbiota was assigned a multiplier of 2.03×10⁵ based on a mean genome size of 4.50 Mbp.
Short-chain fatty acid (SCFA) analysis
We used an established gas chromatography protocol5 to measure the concentration of acetic, butyric and propionic acids in flash-frozen cecal samples collected from mice fed whole-food diets of meat or tuber. Briefly, samples of cecal effluent stored at -80°C since harvest were thawed, weighed and resuspended in 400 μL of HPLC-grade water. Samples were homogenized and adjusted to pH 2–3 with 50% sulfuric acid. The acidified samples were incubated at room temperature for 5 min, with intermittent vortexing, then centrifuged for 10 min at 5,000 g. 300 μL of the clear supernatant was transferred into an Eppendorf tube, 50 μL of the internal standard (1% 2-methylpentanoic acid solution) and 300 μL of anhydrous ethyl ether were added. The samples were vortexed for 30 s and centrifuged at 5,000 g for 10 min. 1 μL of the upper ether layer was used for analysis. Acids were identified and quantified in comparison to a reference mix of volatile acids, containing 10 mM concentrations of acetic, butyric, and propionic acids (Matreya). The reference mix was validated against acid-specific standard curves to ensure quantification in the linear range. Results were expressed as mM concentrations per gram of sample, with the mean value across duplicate runs used for statistical analyses.
Bomb calorimetry analysis
Fecal pellets were collected from individual mice and lyophilized for 24h prior to determination of energy content via bomb calorimetry. After completion of the drying process, 100–200 mg of dried stool was pressed into a pellet using a pellet press, and dried masses of the pressed pellets were recorded. Gross energy content was measured using an isoperibol oxygen bomb calorimeter with a semimicro oxygen bomb (Models 6200 and 1109, respectively, Parr Instrument Co.). The calorimeter energy equivalent factor was determined using benzoic acid standards.
Microbial physiology analysis
Fresh fecal pellets were placed into an anaerobic chamber (Coy Laboratory Products) containing 5% H2 / 10% CO2 / 85% N2 within 10 minutes of production. Bacterial
physiology was assessed under anaerobic conditions according to validated protocols19,20 using 2 fluorescent nucleic acid stains, propidium iodide (Sigma-Aldrich) and SYBRGreenI (Invitrogen) (Supplementary Notes). Propidium iodide (PI) is excluded from bacterial cells with intact membranes due to its size and hydrophilicity, and therefore PI is commonly used to assess bacterial membrane damage50. SYBRGreenI is used for total bacterial cell counts by flow cytometry, as it enters all bacteria irrespective of membrane status. Extensive data show that SYBRGreenI-stained cells can be grouped into two clusters, low nucleic acid-containing (LNA) and high nucleic acid-acid-containing (HNA) bacteria, according to their
A
uthor Man
uscr
ipt
A
uthor Man
uscr
ipt
A
uthor Man
uscr
ipt
A
uthor Man
uscr
ipt
relative fluorescence and scatter characteristics20,51. Both groups have discernible biomass and activity levels, and within a given community HNA cells are considered to be more active than LNA cells20,52,53. Fresh fecal samples were stained for 10 min with PI at 0.04 mg/mL final concentration (Sigma-Aldrich) or 15 min with SYBRGreenI at 1X final concentration (Invitrogen). Fluorescent beads (3.4 μm, Spherotech) were added as an internal standard to determine cell abundance, and their density was determined for every flow cytometry analysis with Countbright beads (Invitrogen). All cytometric measurements were made using a LSRFortessa flow cytometer (Becton Dickinson) equipped with solid-state Coherent Sapphire 100 mW 488 nm and 50 mW 561 nm lasers, and standard filter setup. Data were analyzed with FlowJo software version 7.6.3 (Tree Star).
In vitro bacterial growth assays
We selected for screening 15 gut bacterial isolates with high prevalence and abundance across 1,267 publicly available human fecal metagenomes54, and representing the five major phyla from the human gut (Bacteroidetes, Firmicutes, Actinobacteria, Proteobacteria, and Verrucomicrobia). Strains were grown and assayed in brain-heart infusion (BHI) medium supplemented with L-cysteine hydrochloride (0.05% w/v), hemin (5 μg/mL), vitamin K (1 μg/mL) and resazurin (0.0001% w/v). Arginine-dependent Eggerthella lenta was grown and assayed in supplemented BHI plus arginine (1% w/v). Chlorogenic acid (Sigma-Aldrich) and caffeic acid (Sigma-Aldrich) were dissolved directly in BHI medium, while our positive control myricetin (TCI America) was dissolved in DMSO present at a final concentration of 1%. Minimum inhibitory concentration (MIC) assays were performed using the broth microdilution method outlined by the Clinical Laboratory Standards Institute55, with some changes. Briefly, assays were performed in triplicate in round-bottom 96-well plates
(Corning, Costar) in a final volume of 100 μL. Plates were prepared in an anaerobic chamber (Coy Laboratory Products) containing 5% H2 / 10% CO2 / 85% N2 and were allowed to
equilibrate for 3 h before bacteria were added. Inoculated plates were incubated at 37°C for 24 h, with plates containing slow-growing Akkermansia muciniphila and E. lenta grown for 48 h. Absorbance values were measured at a wavelength of 600 nm (A600 nm) using a plate
reader (Tecan). Relative growth was calculated by subtracting A600 nm values from sterile
controls and normalized to a growth control (BHI only or BHI plus 1% DMSO). MICs were defined as growth conditions that yielded a relative growth <0.1.
Metabolomics assays
Two different chromatography approaches were used to characterize the plant metabolites. Reverse phase chromatography was used for the non-polar metabolites, and this approach was complimented by normal phase chromatography with hydrophilic interaction liquid chromatography (HILIC) for polar metabolites and to characterize compounds either not retained or subject to matrix effects on the reverse phase column56–60. Raw and cooked samples of the six plant foods fed to mice in the PF study were reserved at the time of diet preparation and stored at -80°C for metabolomics analysis. Raw and cooked foods were lyophilized to dryness and then powdered using a mortar and pestle. In a 2 mL screw-top tube, the powdered tissue was suspended in 80% MeOH/20% H2O (0.2 g tissue per 1 mL of
solvent). This suspension was vortexed for 30 s and then placed in an ultrasonicating bath at room temperature, sonicating for 30 min. Then, the tube was vortexed for 30 s, after which it
A
uthor Man
uscr
ipt
A
uthor Man
uscr
ipt
A
uthor Man
uscr
ipt
A
uthor Man
uscr
ipt
was centrifuged at 2000 rpm for 10 min. The supernatant was aspirated and stored at -20°C until analysis. Extraction controls, containing only the extraction solvent, were also
prepared. Prior to LC-MS analysis, extracts were centrifuge-filtered (0.22 μm, UFC40GV0S, Millipore), transferred to glass vials, then methanol containing internal standards was added to each vial. For non-polar metabolite analysis, 2-Amino-3-bromo-5-methylbenzoic acid (ABMBA) was added to a final concentration of 1 μg/mL, and for polar metabolite analysis, 13C-15N labeled amino acids (767964, Sigma) were added to a final concentration of 15 μM. All chromatography was performed using an Agilent 1290 LC stack, with MS and MS/MS fragmentation data collected in both positive and negative ion mode using a Thermo QExactive (for HILIC) or Thermo QExactive HF (for C18) mass spectrometer
(ThermoFisher Scientific, San Jose, CA). For each 2 μL sample injection, full MS spectra was acquired between m/z 80–1200 at 60,000 resolution for C18, and between m/z 70–1050 at 70,000 resolution for HILIC, with fragmentation data acquired using stepped collision energies of 10, 20 and 40 eV at 17,500 resolution. Sample injection order was randomized and an injection blank of only methanol run between each sample. To detect non-polar metabolites, samples were chromatographically separated using a C18 column (Agilent ZORBAX Eclipse Plus C18, #959757, 50x2.1 mm 1.8 μm) warmed to 60°C with a flow rate of 0.4 mL/min equilibrated with 100% buffer A (100% LC-MS water w/ 0.1% formic acid) for 1 minute, followed by a linear gradient to 100% buffer B (100% acetonitrile w/ 0.1% formic acid) at 8 minutes, and then isocratically held at 100% B for 1.5 minutes. To detect polar metabolites, samples were chromatographically separated using a HILIC column (Agilent InfinityLab Poroshell 120 HILIC-Z, #673775–924, 150x2.1mm, 2.7 μm) warmed to 40°C with a flow rate of 0.45 mL/min equilibrated with 100% buffer B (95:5
acetonitrile:water w/ 5 mM ammonium acetate) for 1 minute, followed by a linear gradient diluting buffer B down to 89% with buffer A (100% water w/ 5 mM ammonium acetate and 5 μM methylene-di-phosphonic acid) over 10 minutes, then down to 70% B over 4.75 minutes, then down to 20% B over 0.5 minutes, and then isocratically held at 20% B for 2.25 minutes. The raw metabolomics data are available for download at https://opengut.ucsf.edu/ CookingData.tar.gz.
Metabolomics analysis
Features, high intensity signals narrowly contained at a given retention time and m/z, were detected using the MZMine software v 2.2461. Parameters for processing are contained in the original XML files used by MZMine (Supplementary Data 1 and Supplementary Data 2 for negative and positive acquisition mode, respectively). Additional Python scripts were used to identify minimum and maximum retention time bounds for each peak, filter peaks that were not at least 3 times higher in a sample compared to all injection blanks, and filter peaks that did not have at least one MS/MS spectrum. Metabolite tables are provided in Supplementary Data 3 and Supplementary Data 4.
Metabolite identification
Chemical standards were used for identifications based on matching m/z better than 5 parts per million (ppm), retention time difference <0.2 minutes for C18 and ≤0.5 for HILIC, and/or matching fragmentation patterns with a score >0.5 as calculated by the Stein & Scott “composite” algorithm37 with modifications. Here the mass weight term is set to 0, the
A
uthor Man
uscr
ipt
A
uthor Man
uscr
ipt
A
uthor Man
uscr
ipt
A
uthor Man
uscr
ipt
intensity weight term is inversely proportional to the log of the number of aligned m/z values plus one, and the dot product and ratio of peak pair terms are averaged using the geometric mean. For each identification, peaks were integrated from a minimum to a maximum retention time and 5 ppm about a theoretical m/z. To complement the final identifications and processed data in Supplementary Table 7, we also provide the unfiltered initial compound identifications and raw peak heights (intensity) in Supplementary Data 5 (C18) and Supplementary Data 6 (HILIC). Compounds with a detected retention time <1 min were excluded from subsequent analysis. For compounds detected by multiple chromatography methods or ionization modes we selected a single representative dataset based on intensity and prioritizing HILIC. When two or more chemical standards co-eluted, shared the same m/z value, or were not distinguished by their fragmentation patterns, the ambiguity of the assigned identity was captured in the column “unresolvable compounds” of Supplementary Table 7. For each identified compound, a measure of confidence is provided in
Supplementary Table 7: (i) absolute value of the difference in retention time from the standard; (ii) mass error (ppm) of detected m/z versus theoretical m/z; and (iii) MS/MS score comparing experimental MS/MS fragmentation pattern to standard. As defined by the Metabolomics Standards Initiative62, any two of these orthogonal measures supports a Level 1 identification for these non-novel metabolites. A total of 215 Level 1 compounds were identified. 185 exceeded Level 1 (high confidence assignments by all 3 measures) and an additional 30 were categorized as “unresolvable compounds” due to structural isomers. The identified compounds were added to Metabolite Atlas63 to generate extracted ion
chromatograms for each sample, shown together with matches between the experimental MS/MS spectra to the MS/MS spectrum of the chemical standard in Supplementary Data 7.
Differential metabolite analysis
A prior of 966.67 was added to all peak heights (2/3 of the lowest non-zero abundance) before a log2 transformation. Then, FDR-corrected Welch’s t-tests were carried out with a
FDR<0.1 and an absolute log2 fold change>1 considered to be significant. FDR was carried
out within each analysis mode and plant food type. Ordination of metabolomics data was carried out using the ropls package64. The density heat maps were created using the stat_density_2d function of ggplot265 with 100 bins.
Statistical analysis
Statistical analyses and data visualization were performed in Prism 7 (GraphPad Software) and/or R version 3.5.0. Unless otherwise stated, to evaluate treatment effects where subjects were not explicitly matched across time points, we used unpaired t-tests, ANOVA, or two-way ANOVA with Holm-Sidak correction for multiple comparisons. To compare across time points for the same individual, we used paired t-tests or repeated measures ANOVA with Holm-Sidak correction for multiple comparisons. All pairwise postdoc comparisons were evaluated unless otherwise indicated. Non-parametric tests were employed when data violated the underlying assumption of normal distribution. Significance was set at p<0.05 or FDR<0.05 unless otherwise noted.
A
uthor Man
uscr
ipt
A
uthor Man
uscr
ipt
A
uthor Man
uscr
ipt
A
uthor Man
uscr
ipt
Data Availability
16S rDNA and RNA sequencing data have been deposited in the NCBI Sequence Read Archive under accession PRJNA504908. Metabolomics raw data are available for download at https://opengut.ucsf.edu/CookingData.tar.gz. Figure source data and additional study data are available by request ([email protected] or [email protected]).
Supplementary Material
Refer to Web version on PubMed Central for supplementary material.
Acknowledgements
We are indebted to Rachel Dutton and Richard Wrangham for pivotal discussions; to Tina Herfel, Barbara Mickelson, Nikhil Pai, and Christine Pelkman for help with diet development; to Lynn Bry, Annamarie Bustion, Meghan Correa, Christian Daly, Mary Delaney, Luxue Deng, Onur Erbilgin, Adam Freedman, Emily Groopman, Suzanne Kosina, Francesco Pontiggia, Claire Reardon, Jane Thomas, and Vladimir Yeliseyev for technical assistance; and to Emily Balskus, Lawrence David, Richard Losick, and Renuka Nayak for comments on the manuscript. This work was supported by the National Institutes of Health (P.J.T., R01HL122593; R.N.C., F32DK101154), Boston Nutrition Obesity Research Center, Leakey Foundation, G.W. Hooper Foundation, Harvard Dean’s Competitive Fund for Promising Scholarship, William F. Milton Fund, the Defense Advanced Research Projects Agency (T.R.N., HR0011516183) and the UCSF Department of Microbiology and Immunology. J.E.B. was the recipient of a Natural Sciences and Engineering Research Council of Canada Postdoctoral Fellowship. P.J.T. is a Chan Zuckerberg Biohub investigator and a Nadia’s Gift Foundation Innovator supported, in part, by the Damon Runyon Cancer Research Foundation (DRR-42–16) and the Searle Scholars Program (SSP-2016–1352).
References
1. Carmody RN, Gerber GK, Luevano JM Jr et al. Diet dominates host genotype in shaping the murine gut microbiota. Cell Host Microbe 17, 72–84 (2015). [PubMed: 25532804]
2. Muegge BD, Kuczynski J, Knights D et al. Diet drives convergence in gut microbiome functions across mammalian phylogeny and within humans. Science 332, 970–974 (2011). [PubMed: 21596990]
3. Smits SA, Leach J, Sonnenburg ED et al. Seasonal cycling in the gut microbiome of the Hadza hunter-gatherers of Tanzania. Science 357, 802 (2017). [PubMed: 28839072]
4. Turnbaugh PJ, Ridaura VK, Faith JJ et al. The effect of diet on the human gut microbiome: a metagenomic analysis in humanized gnotobiotic mice. Sci. Transl. Med 1, 1–10 (2009). 5. David LA, Maurice CF, Carmody RN et al. Diet rapidly and reproducibly alters the human gut
microbiome. Nature 505, 559–563 (2014). [PubMed: 24336217]
6. Carmody RN & Wrangham RW The energetic significance of cooking. J. Hum. Evol 57, 379–391 (2009). [PubMed: 19732938]
7. Carmody RN, Dannemann M, Briggs AW et al. Genetic evidence of human adaptation to a cooked diet. Genome Biol. Evol 8, 1091–1103 (2016). [PubMed: 26979798]
8. Snow P & O’Dea K Factors affecting the rate of hydrolysis of starch in food. Am. J. Clin. Nutr 34, 2721–2727 (1981). [PubMed: 6172034]
9. Ze X, Duncan SH, Louis P & Flint HJ Ruminococcus bromii is a keystone species for the degradation of resistant starch in the human colon. The ISME Journal 6, 1535 (2012). [PubMed: 22343308]
10. Cowan MM Plant products as antimicrobial agents. Clin. Microbiol. Rev 12, 564–582 (1999). [PubMed: 10515903]
11. Witte W Medical consequences of antibiotic use in agriculture. Science 279, 996–997 (1998). [PubMed: 9490487]
12. Carmody RN, Weintraub GS & Wrangham RW Energetic consequences of thermal and nonthermal food processing. Proc. Natl Acad. Sci. USA 108, 19199–19203 (2011). [PubMed: 22065771]
A
uthor Man
uscr
ipt
A
uthor Man
uscr
ipt
A
uthor Man
uscr
ipt
A
uthor Man
uscr
ipt
13. Guan Y, Wu T, Lin M & Ye J Determination of pharmacologically active ingredients in sweet potato (Ipomoea batatas L.) by capillary electrophoresis with electrochemical detection. J. Agric. Food Chem. 54, 24–28 (2006). [PubMed: 16390172]
14. Salyers AA, Vercellotti JR, West SE & Wilkins TD Fermentation of mucin and plant
polysaccharides by strains of Bacteroides from the human colon. Appl. Environ. Microbiol 33, 319–322 (1977). [PubMed: 848954]
15. Martens EC, Lowe EC, Chiang H et al. Recognition and degradation of plant cell wall polysaccharides by two human gut symbionts. PLoS Biol. 9, e1001221 (2011). [PubMed: 22205877]
16. Sun T, Laerke HN, Jorgenson H & Knudsen KEB The effect of extrusion cooking of different starch sources on the in vitro and in vivo digestibility in growing pigs. Anim. Feed Sci. Technol 131, 66–85 (2006).
17. Warren FJ, Fukuma NM, Mikkelsen D et al. Food starch structure impacts gut microbiome composition. mSphere 3, e00086–00018 (2018). [PubMed: 29769378]
18. Livesey G The impact of complex carbohydrates on energy balance. Eur. J. Clin. Nutr 49, 89S–96S (1995).
19. Maurice CF, Haiser HJ & Turnbaugh PJ Xenobiotics shape the physiology and gene expression of the active human gut microbiome. Cell 152, 39–50 (2013). [PubMed: 23332745]
20. Maurice CF & Turnbaugh PJ Quantifying and identifying the active and damaged subsets of indigenous microbial communities. Methods Enzymol. 531, 91–107 (2013). [PubMed: 24060117] 21. Borges A, Ferreira C, Saavedra MJ & Simoes M Antibacterial activity and mode of action of
ferulic and gallic acids against pathogenic bacteria. Microb. Drug Resist. 19, 256–265 (2013). [PubMed: 23480526]
22. Lou Z, Wang H, Rao S et al. p-Coumaric acid kills bacteria through dual damage mechanisms. Food Control 25, 550–554 (2012).
23. Alves MJ, Ferreira ICFR, Froufe HJC et al. Antimicrobial activity of phenolic compounds identified in wild mushrooms, SAR analysis and docking studies. J. Appl. Microbiol 115, 346–357 (2013). [PubMed: 23510516]
24. Cho I, Yamanishi S, Cox L et al. Antibiotics in early life alter the murine colonic microbiome and adiposity. Nature 488, 621–626 (2012). [PubMed: 22914093]
25. Butaye P, Devriese LA & Haesebrouck F Antimicrobial growth promoters used in animal feed: effects of less well known antibiotics on gram-positive bacteria. Clin. Microbiol. Rev 16, 175–188 (2003). [PubMed: 12692092]
26. Vijay-Kumar M, Aitken JD, Carvalho FA et al. Metabolic syndrome and altered gut microbiota in mice lacking toll-like receptor 5. Science 328, 228 (2010). [PubMed: 20203013]
27. Breton J, Tennoune N, Lucas N et al. Gut commensal E. coli proteins activate host satiety pathways following nutrient-induced bacterial growth. Cell Metab. 23, 324–334 (2016). [PubMed:
26621107]
28. Perez-Burillo S, Pastoriza S, Jimenez-Hernandez N et al. Effect of food thermal processing on the composition of the gut microbiota. J. Agric. Food Chem. 66, 11500–11509 (2018). [PubMed: 30346155]
29. Koppel N, Maini Rekdal V & Balskus EP Chemical transformation of xenobiotics by the human gut microbiota. Science 356, eaag2770 (2017). [PubMed: 28642381]
30. Moeller AH, Li Y, Mpoudi Ngole E et al. Rapid changes in the gut microbiome during human evolution. Proc. Natl Acad. Sci. USA 111, 16431–16435 (2014). [PubMed: 25368157] 31. Caporaso JG, Kuczynski J, Stombaugh J et al. QIIME allows analysis of high-throughput
community sequencing data. Nat. Methods 7, 335–336 (2010). [PubMed: 20383131]
32. Segata N, Izard J, Waldron L et al. Metagenomic biomarker discovery and explanation. Genome Biol. 12, 1–18 (2011).
33. Kuznetsova A, Brockhoff PB & Christensen RHB lmerTest package: tests in linear mixed effects models. J. Stat. Softw 82, 1–26 (2017).
34. Ritchie ME, Phipson B, Wu D et al. limma powers differential expression analyses for RNA-sequencing and microarray studies. Nucleic Acids Res. 43, e47 (2015). [PubMed: 25605792]