classification with high-dimensional expression
data
Andreas Leha
∗, Klaus Jung, and Tim Beißbarth
Department of Medical Statistics University Medical Center Göttingen Humboldtallee 32, D-37073 Göttingen
Abstract
Molecular diagnosis or prediction of clinical treatment outcome based on high-throughput ge-nomics data is a modern application of machine learning techniques for clinical problems. In practice, clinical parameters, such as patient health status or toxic reaction to therapy, are often measured on an ordinal scale (e.g.good,fair,poor).
Commonly, the prediction of ordinal end-points is treated as a multi-class classification problem, disregarding the ordering information contained in the response. This may result in a loss of pre-diction accuracy. Classical approaches to model ordinal response directly, including for instance the cumulative logit model, are typically not applicable to high-dimensional data.
We presenthierarchical twoing (hi2), a novel algorithm for classification of high-dimensional data into ordered categories. hi2 combines the power of well-understood binary classification with or-dinal response prediction.
A comparison of several approaches for ordinal classification on real world data as well as simu-lated data shows that classification algorithms especially designed to handle ordered categories fail to improve upon state-of-the-art non-ordinal classification algorithms. In general, the classific-ation performance of an algorithm is dominated by its ability to deal with the high-dimensionality of the data. Onlyhi2 outperforms its competitors in the case of moderate effects.
1998 ACM Subject Classification I.5.2 Design Methodology
Keywords and phrases Classification, High-Dimensional Data, Ordinal Response, Expression Data
Digital Object Identifier 10.4230/OASIcs.GCB.2013.90
1
Introduction
In the pursuit of personalized medicine there is increasing demand to classify patients individually based on molecular features. Therefore, classification methods which are capable to handle high-dimensional data from high-throughput omics data are needed. In clinical problems it is oftentimes desired to classify patients into ordered categories, because many clinically relevant parameters, such as patient health status or toxic reaction, are measured on ordinal scales. Examples include theTNM-status[30] or theAcute Toxicity Grades [11, 32]. Standard classification methods for high-throughput data can only handle categorical responses [13]. In practice these methods are typically applied after dichotomization of an ordinal therapy response parameter [18, 20]. Not to use the ordered structure, however,
∗ corresponding author
© Andreas Leha, Klaus Jung, and Tim Beißbarth; licensed under Creative Commons License CC-BY German Conference on Bioinformatics 2013 (GCB’13).
Editors: T. Beißbarth, M. Kollmar, A. Leha, B. Morgenstern, A.-K. Schultz, S. Waack, E. Wingender; pp. 90–100 OpenAccess Series in Informatics
can lead to sub-optimal classification results, as exploiting the information contained in the ordering can improve the classification performance [2, 16].
Another approach to address the classification into ordered categories is regression. In this approach, the levels of the response (e.g. good, fair, poor) are mapped to numerical numbers (e.g. 1, 0, -1) and a regression model is fitted. While mapping the levels to numbers preserves the order, this approach imposes additional structure, that might not be actually present, as it restricts the distances between the levels. However, if the number of levels gets large (e.g. the CMTNS with 37 levels [28]), this bias is comparably small.
Several ordinal classification algorithms have been proposed, e.g. the cumulative logit model or the continuation ratio model [1], which are typically not suited for high-dimensional problems.
The set of ordinal classification methods that are suitable for high-dimensional data is small. It includes rpartOrdinal [2] and its variant rpartScore [17], which both extend classification trees by several methods to split the nodes to favour classification preserving the ordinality. Archer and Williams [3] propose a second method based on continuation ratio models and L1 penalization. Ordinal extensions exist for the k-nearest neighbours classification [19] as well as for support vector machines [10].
In this regard we proposehierarchical twoing (hi2), a classification scheme for ordinal classification, that takes the idea of twoing from Breiman et al. [5] which is also used by Frank and Hall [16]. Twoing is the idea to take all possible ways of splitting the data into two sets and of constructing the overall classifier out of binary classifiers based on these splits. Hereby, hi2 extends the method of Frank and Hall to a forest of hierarchical configurations. hi2 is a classification scheme, s.t. the choice of the dichotomous classification algorithm used internally is free and can be adapted to best suit the data at hand.
This paper is organized as follows: Section 2 details the proposed hi2 method and describes the alternatives. Different methods to evaluate the performance of classifiers with ordinal response are discussed as well. After that, in section 3 we present a comparative evaluation of different ordinal classification methods, in a simulated setting as well as applied to real data. Following a discussion on the results in section 4 the paper concludes with section 5.
2
Methods
In the following the response variable is denoted asCand can take one ofpordered values C1< C2<· · ·< Cp. If the response variable of a sample takes the valueCj we also speak
of the sample beingin classj or in classCj.
2.1
Related Work
Our comparison contains a nullmodel for comparison. This nullmodel does not use any information from the features for classification, but only relies on the relative group frequencies in the training set. If, for example, 50% of all samples in the training set are in class 1, the nullmodel will classify an unseen sample into class 1 with a probability of 50%. The nullmodel is calledrelfreq in the remainder of this paper.
As a second ‘benchmark’ we trained standard support vector machines, which are known to handle high-dimensional data well [4]. SVMs fit a hyperplane in the feature space which best separates the samples from two groups. By means of a kernel function (the radial basis function kernel was used in this paper) the data are mapped into a higher-dimensional space to enhance the linear separability. In order to accommodate more than two classes a
all binary subclass comparisons are performed and a voting mechanism decides the overall classification result.
A third method, which will be called limma+lda throughout this paper, first does a feature selection to reduce the dimensionality of the data. To that end it performs an ANOVA per feature where internally the residual mean squares are moderated between the features [29]. The resulting p-values reflect an overall relation between a feature’s expression profile and the response and are used to filter the features. The number of features to use is a crucial parameter in this algorithm and an inner cross validation tunes that number. The retained features are then used as predictors in a linear discriminant analysis (lda) [31]. The lda projects the data onto linear subspaces in a way that maximises the separation of the projected means of the classes while normalizing for the inner-class variance, such that the ratio of inter- and intra-variance is maximized
Also shown are results from ordinal classification trees, implemented in the R-package rpartOrdinal [2]. Classification trees select the splitting features during the tree construction, thus, a explicit feature selection is not necessary. Several splitting functions are proposed in that package. We present results based on the ordered twoing approach, which – although being computationally the most demanding one – performed best in our experiments. To accommodate for overfitting rpartOrdinal proposes a bagging approach where several classi-fication trees are grown on bootstrapped samples and the majority vote of these trees is used as the overall classification result.
Frank and Hall [16] present a classification framework, that extends binary classification to the ordinal case. In the remainder of this paper we will refer to their method as Frank&Hall. In short, given ap-class problem, Frank&Hall trainsp−1 binary classifiers and uses them to assign a class probability to each of thepordinal classes C1, . . . , Cp when an unseen sample
is classified. The class with the highest probability is used as classification result. The probability of the first class (C1) is simply 1−P r(sample> C1) and depends only on a single
binary classifier that distinguishesC1 from the other values. Analogously, the probability of
Cp is also computed using a single binary classifier asP r(sample> Cp−1). The probability
of the remaining classesCj isP r(sample> Cj−1)−P r(sample> Cj), j= 2, . . . , p−1 and
therefore dependent on two binary classifiers. Thus, Frank&Hall present a classification framework and the user can plug in any binary classifier suitable for the data.
2.2
Hierarchical Twoing (hi2)
We propose hi2 as an extension of Frank&Hall. The classification result in Frank&Hall is dependent on maximally 2 classifiers and information from more distant classes is not considered directly. We propose to apply a hierarchical tree-like classification scheme, that recursively partitions the data into two-class problems, so that in hi2 the information from distant classes has a more direct impact on the local binary classification.
hi2 has two main modes: theall datamode and thesplit data mode.
2.2.1
All Data Mode
In the all data mode, hi2 trains the same classifiers as Frank&Hall but does the prediction in a hierarchical way: hi2 chooses one of thep−1 trained classifiers as the root classifier, e.g. it might choose the first classifier that separates class 1 from the rest. In the ordinal setting each binary classifier can only separate lower classes from higher classes, which we call theleft sideandright sideof the classifier, respectively. The hierarchical scheme of hi2 now works recursively on both sides of the chosen classifier. In our example the left side
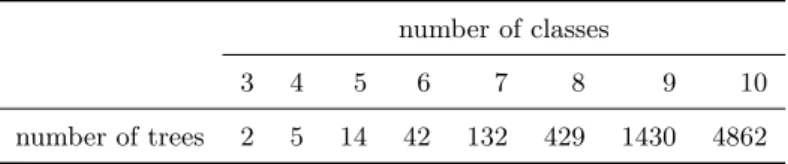
Table 1The number of classification trees in hi2 grows with the number of ordinal classes in the
classification problem following theCatalan Numbers. The table shows the number of trees that hi2
has to construct for classification problems up to size 10. While it is still feasible to apply hi2 for 10 class problems, computing time constrains the applicability to problems with more classes. That does not represent a real constraint, though, as with a growing number of classes, classification into ordinal classes approximates a regression problem.
number of classes
3 4 5 6 7 8 9 10
number of trees 2 5 14 42 132 429 1430 4862
consists only of one class – class 1 – so the classifier is done here. The right side consists of thep−2 remaining classes, and hi2 again chooses one classifier. This is recursively repeated until all classifiers have been chosen. That way a classification tree is built. Dependent on which classifier are chosen after each other, that classification tree will have a different topology. hi2 builds all possible classification trees and takes a weighted majority vote as final classification result.
The weight of each tree is the classification performance of that tree on the training data measured by Kendall’sτ (see 2.3 below).
As hi2 generates all possible classification trees and the number of classification trees is dependent on the number of classes, hi2 is not suited for problems with many (>10) classes (Table 1). We consider that to be not a strong limitation, as when the number of classes gets large, regression methods usually yield good results. The number of classes is given by the
Catalan Numbers: Cq = 2q q q+ 1 = (2q)! q!(q+ 1)!, (1)
whereq=p−1 : number of binary classifiers
2.2.2
Split Mode
In split mode, the training phase of hi2 also follows the hierarchical scheme. That means that also the training set is split into samples that are classified into the left side of a classifier and samples that are classified into the right side. The recursive training is then carried out on the reduced training set in both sides. This approach poses an additional computational burden, as many more binary classifiers have to be trained compared to the all data mode. We found that computational burden to be acceptable. But furthermore, the reduction of the training set in each recursion might lead to an increase situations, where training of a classifier is not possible any more. The minimum number of necessary samples is dependent on the chosen binary classification method. The more unbalanced the group sizes are, the more frequent is that situation. So, we regard this mode suitable for classification problems with many samples and close-to balanced group sizes only. Therefore, the results presented below are from the all data mode.
2.3
Methods of Evaluation
In order to compare different classification methods we need a measure to compare their performance. The most common measure to evaluate a classifier is the accuracy, i.e. the
fraction of the number of correctly classified samples by the number of available samples. An equivalent measure is themisclassification error rate (MER)where MER = 1−accuracy. These measures are not suitable for the ordinal case, as they do not have a notion of different levels of mis-classification, but treat a classification result as either correct or wrong. In the ordinal setting there are different levels of mis-classification, as classifying a sample into a neighbouring class should be considered a better result than classifying it into a distant class.
Therefore, different measures to evaluate a classifier have been proposed. One proposal is to look at all pairwise comparisons and to refrain from an overall measure [22]. It is, however, inconvenient to not have one overall measure. Most alternative performance measures that do an overall evaluation are based on the non-parametric notion of concordant and discordant pairs [12]. Here, the classification result of a pair of samples is calledconcordantif the relative order of their class values is the same in the classification compared to the true values. If the relative order is reverse to the true values, the pair is calleddiscordant. Kendall’s correlation coefficientτb [21] is the most common evaluation method of these rank based methods. τb is
defined as τb:= nc−nd q nc+nd−n (r) t q nc+nd−n (t) t , (2)
where nc :number of concordant pairs,
nd :number of discordant pairs,
n(tr) :number of ties in the classification result only, n(tt) :number of ties in the true values only
Pairs which have ties in both the classification result as well as the true value are ignored by Kendall’sτb. It is possible to calculate confidence intervals for Kendall’s τb [23, p. 78]
which is the main reason why we usedτb as performance measure in the remainder of this
paper.
As τb works on pairs of samples, it can not be used to compare different classifiers
using one sample only. Alternative measures, include theminimum/maximum mean average error [12] which works on the absolute distance of classes, where all classes are mapped to integers or theordinal classification index[8] which has both, a rank-based component and a distance-based component.
3
Results
In all settings the (not ordinal) limma+lda showed a very strong performance. Thus, we used limma+lda as the binary plug-in classifier in Frank&Hall as well as in hi2.
All analysis were implemented and performed in the statistical programming framework R [25]. Org mode [27] was used as environment for reproducible research.
3.1
Simulation
A simulation study was conducted to assess the influence of different data characteristics on the classification performance.
We simulated gene expression data for 1000 genes from 90 patients – 60 patients in a training set and 30 patients in a test set. The expression data was simulated to follow a multivariate normal distribution with expectation vectorµ=0and a block-structured covariance matrix Σ: 20 blocks containing 50 genes each are placed along the diagonal. Each
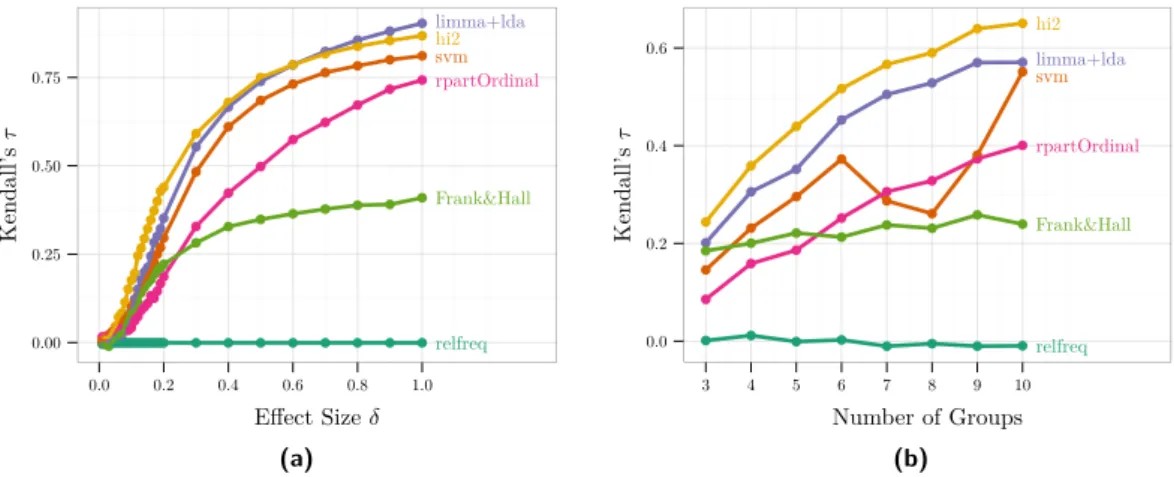
relfreq Frank&Hall rpartOrdinal svm hi2 limma+lda 0.00 0.25 0.50 0.75 0.0 0.2 0.4 0.6 0.8 1.0 Effect Sizeδ Kendall’s τ (a) relfreq Frank&Hall rpartOrdinal svm limma+lda hi2 0.0 0.2 0.4 0.6 3 4 5 6 7 8 9 10 Number of Groups Kendall’s τ (b)
Figure 1This Figure presents the results from a simulation study. Gene expression of 1000 genes was simulated for 90 patients belonging to 5 ordinal classes. 60 patients were used to train
the classifiers and the remaining 30 patients formed the test set. Shown is Kendall’sτ comparing
the classification result (the predicted class) with the true value. Kendall’sτ takes values between
-1 (perfect negative correlation) and 1 (perfect correlation). The left panel (a) shows the results
for different effect sizesδ. 50 genes cave been simulated to be differentially expressed across the 5
ordinal classes andδis the level of differential expression. The right panel (b) shows results for a
fixed effectδ= 0.2 but different number of groups.
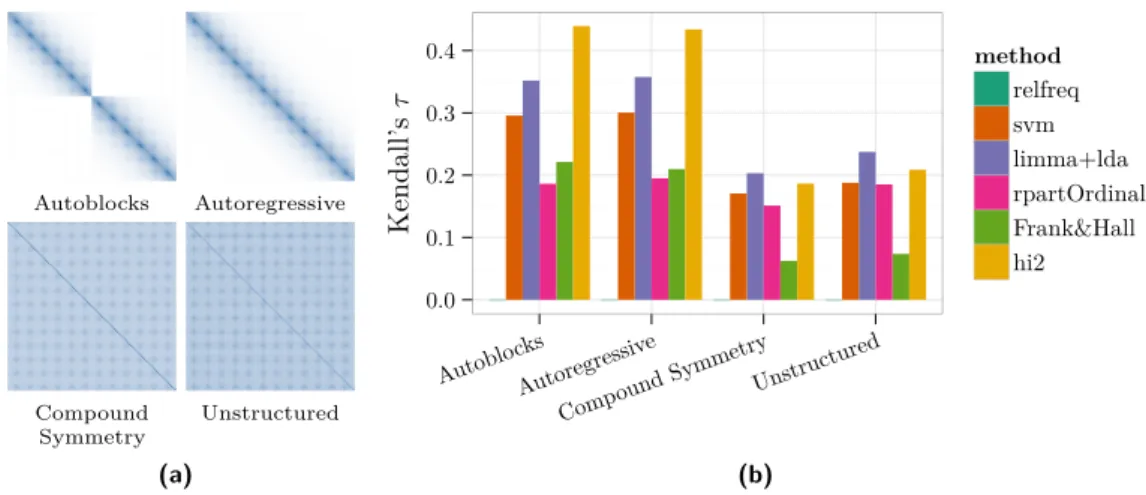
block has an autoregressive structure with parameterρ= 0.9, i.e. the value isρd wheredis the unit distance to the diagonal. See the ’Autoblocks’ panel in Figure 2a for a visualization.
In both groups, the training set and the test set, we simulated five ordinal groups of equal size. 50 randomly chosen genes were set to be differentially expressed following a linear trend pattern across the ordered groups with an effect sizeδ= 0.2, i.e. the expectation of the expression for these 50 genes is (j−1)∗δ for groupj, j= 1, . . . , p. All simulations were repeated 100 times.
In a first experiment the effect size δ was varied from 0 (no differentially expressed genes) to 1 (highly differentially expressed genes). Results are presented in Figure 1a. As expected all classification methods improve their performance with increasing effect size except the nullmodel which does not take the gene expression data into account. In the caseδ= 0 the performance of all classifiers is not better than guessing. Interestingly, the classification framework by Frank and Hall shows a much lower performance compared to the other methods and levels off at a moderately high effect size so that higher effect sizes do not lead to further improvements. The performance of rpartOrdinal, the second ordinal method under consideration, also does not match the other classifiers. Even the purely nominal methods svm and limma+lda perform better, where limma+lda again is the better choice. For small and moderate effect sizes, hi2 is the best classifier. Only for very large effect sizes, limma+lda again outperform hi2.
In a second experiment the effect size was fixed at δ= 0.2 and the group size was varied between 3 (the smallest ordinal case) and 9. The aim of this experiment is to evaluate whether methods that exploit the ordinality of the response gain from more groups, as more groups can carry more ordinal information. We can observe, that the method Frank&Hall does not seem to gain from the presence of more groups. Also rpartOrdinal gains less from the increasing group number compared to hi2 or limma+lda. svm shows mixed results, as it takes advantage of more groups up until 6. For more groups, the performance shows a drop. But over all group numbers hi2 keeps the best performance.
Autoblocks Autoregressive Compound Symmetry Unstructured (a) 0.0 0.1 0.2 0.3 0.4 Autoblo cks Autoregressiv e Compound SymmetryUnstructured Kendall’s τ method relfreq svm limma+lda rpartOrdinal Frank&Hall hi2 (b)
Figure 2 For the simulation study gene expression data of 1000 genes were simulated. We simulated the gene expression with different correlation structures. The left panel (a) shows the first 100 rows and columns of the used correlation matrices. The right panel (b) shows the behaviour of the classifiers under the different correlation structures. All classifiers have more difficulties in settings where all genes are correlated to each other. limma+lda and hi2 show the best performance across all settings.
The third experiment looks at different correlation structures. Besides the described block structure, a similar autoregressive structure without blocks, a compound symmetry with all values off the diagonal set to 0.5 and a random (unstructured) covariance have been simulated (see also Figure 2a). The settings with less correlation, namely autoblocks and autoregressive, are easier settings as all classifiers perform better in these two settings. Hi2 outperforms all other classifiers in these cases. Second best performs limma+lda followed by the svm. The ordinal method rpartScore and Frank&Hall perform similar, but are less potent compared to the others. In the settings with high correlation the difference between the methods is less pronounced. Limma+lda and hi2 change places and Frank&Hall has the most problem in these settings.
3.2
Analysis of a Data Examples
3.2.1
miRNA Expression in Breast Cancer
microRNAs have been shown to be important regulators of mRNA expression [9]. We analyzed a publicly available miRNA expression dataset [7] downloaded from the gene expression omnibus data base [14] (accession GSE22216). This data is part of a joint mRNA-miRNA analysis in 207 breast cancer patients. The annotation includes the tumor grade assigned following the modified method of Bloom and Richardson[15], which takes one of the values 1, 2, or 3. 42 patients have been assigned tumor grade 1, 87 and 65 have been assigned tumor grade 2 and 3, respectively. The annotation of the remaining patients was missing. The miRNA in that study had been measured using Illumina Human v1 MicroRNA expression beadchip which contains 735 miRNAs.
We present results from a 10-fold cross validation where the data was put into random order and split into 10 parts, each of which served in turn as test set, while the other 9 parts were used as training set.
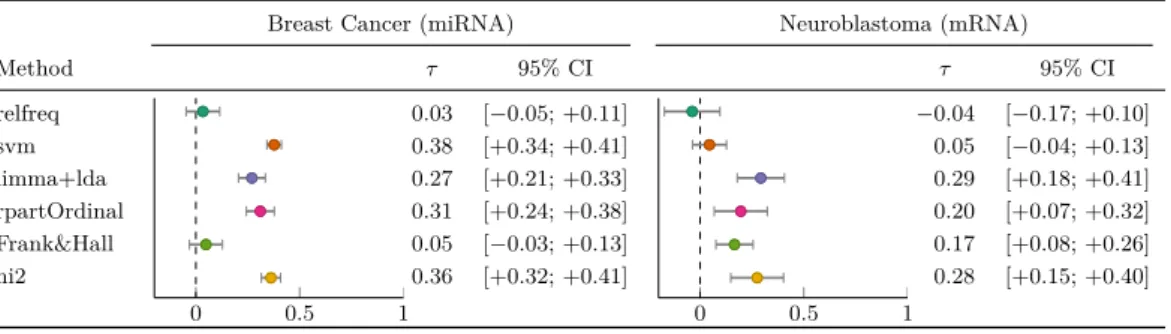
On that setting (Table 2) the rpartOrdinal performs very well, but is still outperformed by hi2. The best classification, however, is delivered by the non-ordinal svm, but the confidence
Table 2The classification algorithms under consideration have been applied to two publicly
available datasets. This table shows their performance measured by Kendall’sτ and includes the
95% confidence intervals. The dashed line in the visualizations marks the evaluation measure for a classification result that is completely uncorrelated to the truth. The left part of the table shows the results for miRNA expression data of 193 patients suffering from breast cancer split into 3 ordered groups. The right part shows results from mRNA data in 84 neuroblastoma patients of 5 ordered
groups. Thenullmodelrelfreq performs consistently bad on both datasets. In contrast hi2 performs
consistently strong on both datasets. The svm performs best on the miRNA data but surprisingly fails on the mRNA data.
Breast Cancer (miRNA) Neuroblastoma (mRNA)
Method τ 95% CI τ 95% CI relfreq 0 0.5 1 0.03 [−0.05; +0.11] 0 0.5 1 −0.04 [−0.17; +0.10] svm 0.38 [+0.34; +0.41] 0.05 [−0.04; +0.13] limma+lda 0.27 [+0.21; +0.33] 0.29 [+0.18; +0.41] rpartOrdinal 0.31 [+0.24; +0.38] 0.20 [+0.07; +0.32] Frank&Hall 0.05 [−0.03; +0.13] 0.17 [+0.08; +0.26] hi2 0.36 [+0.32; +0.41] 0.28 [+0.15; +0.40]
intervals of the estimated performances overlap.
3.2.2
mRNA Expression in Neuroblastoma
As a second dataset an mRNA expression dataset [24] was downloaded from ArrayExpress [26] (identifier: E-TABM-38) and analyzed, again using a 10-fold cross validation scheme. This dataset includes mRNA expression levels for 10155 mRNAs from 251 patients suffering from neuroblastoma. 84 patients have been classified according to the International Neuroblastoma Staging System in its revised version [6] into one of the 5 classes{1,2a,2b,3,4}. The results from this dataset are presented in Table 2. While the svm performed best on the previous dataset, here it hardly outperforms the nullmodel. hi2 performs very strong again, and is only outperformed by limma+lda.
4
Discussion
Across all settings, the simulated ones and the real world data, hi2 shows a consistently strong performance: It performs best or second best result in all settings. We therefore consider hi2 a both good and safe choice for high-dimensional classification problems with ordered responses.
This stands in contrast to svm, for example, that is strong in some settings but fails completely on the mRNA data and also has problems in the simulation with 7-9 groups. We expect that better fine tuning of svm’s parameters would help in these situations. But such fine tuning is not needed for hi2 with limma+lda as the used binary classifier. The main parameter of hi2 in this combination is the number of features to retain from limma and we propose to use an inner cross validation to determine that number.
limma+lda performs surprisingly strong even when it is applied on its own and not as part of the hi2 framework. When used on its own, the feature selection has information on all the groups and not only on a binarization of the grouping as in hi2. Thus, we take limma+lda’s
strength as an indication that in these high-dimensional problems feature selection is a crucial step.
That point is supported by the observation that limma+lda even outperforms hi2 when the effect sizeδbetween the groups is high. When the relevant features show a very strong effect, the task of selecting them gets easier and, thus, methods with a strong feature selection profit more than others. We also see a strong performance of limma+lda on the mRNA dataset which has many features. This again points to the importance of a good feature selection.
Another observation is that the performance of all classifiers drops considerably when we simulate features which are all strongly correlated. We take this as a hint that maybe other methods need to be used or developed that deal better with such highly correlated data. We target, however, data from mRNA or miRNA studies, where the correlation is expected to form blocks (e.g. higher correlation within pathways) where especially hi2 seems very well suited.
5
Conclusion
We presented a comparison of different classification methods applicable to high-dimensional data when the response lives on an ordinal scale. Both, simulated data and real data, have been used. The comparison includes the novel classification scheme hierarchical twoing (hi2), that performs consistently strong across all discussed settings, and seems especially strong in settings with small effects between the groups.
Acknowledgements This work was supported by the Deutsche Forschungsgemeinschaft (KFO 179) and by the German Federal Ministry of Education and Research (BMBF) within the NGFN network IG Prostate-Cancer(01GS0890) and within the Medical Systems Biology network BreastSys.
References
1 C V Ananth and D G Kleinbaum. Regression models for ordinal responses: a review of methods and applications. International Journal of Epidemiology, 26(6):1323–1333, 1997.
2 K J Archer. rpartordinal: An r package for deriving a classification tree for predicting an ordinal response. J Stat Softw, 34:7, Apr 2010.
3 K J Archer and A A A Williams. L 1 penalized continuation ratio models for ordinal response prediction using high-dimensional datasets. Statistics in Medicine, 2012.
4 Kristin P. Bennett and Colin Campbell. Support vector machines: hype or hallelujah?
SIGKDD Explor. Newsl., 2(2):1–13, December 2000.
5 L Breiman, J H Friedman, R A Olshen, and C J Stone. Classification and Regression Trees. Statistics/Probability Series. Wadsworth Publishing Company, Belmont, California,
U.S.A., 1984.
6 GM Brodeur, J Pritchard, F Berthold, NL Carlsen, V Castel, RP Castelberry, B De Bern-ardi, AE Evans, M Favrot, and F Hedborg. Revisions of the international criteria for neuroblastoma diagnosis, staging, and response to treatment.Journal of Clinical Oncology, 11(8):1466–1477, 1993.
7 F M Buffa, C Camps, L Winchester, C E Snell, H E Gee, H Sheldon, M Taylor, A L Har-ris, and J Ragoussis. microrna-associated progression pathways and potential therapeutic targets identified by integrated mrna and microrna expression profiling in breast cancer.
8 J S Cardoso and R Sousa. Measuring the performance of ordinal classification. Interna-tional Journal of Pattern Recognition and Artificial Intelligence, 25(08):1173–1195, Decem-ber 2011.
9 T-C Chang and J T Mendell. microRNAs in vertebrate physiology and human disease.
Annual Review of Genomics and Human Genetics, 8(1):215–239, 2007.
10 W Chu and S S Keerthi. Support vector ordinal regression. Neural Computation, 19(3): 792–815, Feb 2007.
11 J D Cox, J Stetz, and T F Pajak. Toxicity criteria of the radiation therapy oncology group (rtog) and the european organization for research and treatment of cancer (eortc). Inter-national Journal of Radiation Oncology*Biology*Physics, 31(5):1341 – 1346, 1995. Late Effects of Normal Tissues (LENT) Consensus Conference.
12 M Cruz-Ramirez, C Hervas-Martinez, J Sanchez-Monedero, and P A Gutierrez. A prelimin-ary study of ordinal metrics to guide a multi-objective evolutionprelimin-ary algorithm. In2011 11th International Conference on Intelligent Systems Design and Applications (ISDA), pages 1176–1181, 2011.
13 Sandrine Dudoit and Jane Fridlyand. Classification in microarray experiments. In Terry P. Speed, editor,Statistical analysis of gene expression microarray data, volume 1, pages 93– 158. Chapman & Hall / CRC, New York, 2003.
14 R Edgar, M Domrachev, and A E Lash. Gene expression omnibus: NCBI gene expression and hybridization array data repository. Nucleic Acids Research, 30(1):207–210, January 2002.
15 C W Elston and I O Ellis. Pathological prognostic factors in breast cancer. i. the value of histological grade in breast cancer: experience from a large study with long-term follow-up.
Histopathology, 19(5):403–410, November 1991.
16 E Frank and M Hall. A simple approach to ordinal classification. In In: Proc 12th Europ Conf on Machine Learning, pages 145–156. Springer, 2001.
17 G Galimberti, G Soffritti, and M Di Maso. Classification trees for ordinal responses in r: The rpartscore package. Journal of Statistical Software, 47(10), 5 2012.
18 B Michael Ghadimi, Marian Grade, Michael J Difilippantonio, Sudhir Varma, Richard Simon, Cristina Montagna, Laszlo Füzesi, Claus Langer, Heinz Becker, Torsten Liersch, and Thomas Ried. Effectiveness of gene expression profiling for response prediction of rectal adenocarcinomas to preoperative chemoradiotherapy. Journal of clinical oncology: official journal of the American Society of Clinical Oncology, 23(9):1826–1838, 2005.
19 K Hechenbichler and K Schliep. Weighted k-nearest-neighbor techniques and ordinal clas-sification. InDiscussion Paper 399, SFB 386, 2006.
20 Akihiro Ishizu, Utano Tomaru, Taichi Murai, Tomohiro Yamamoto, Tatsuya Atsumi, Takashi Yoshiki, Wako Yumura, Kunihiro Yamagata, Hidehiro Yamada, Shunichi Kumagai, Manae S. Kurokawa, Machi Suka, Hirofumi Makino, Shoichi Ozaki, and for JMAAV. Pre-diction of response to treatment by gene expression profiling of peripheral blood in patients with microscopic polyangiitis. PLoS ONE, 8(5), 2013.
21 M G Kendall. Rank correlation methods. Charles Griffin, London, London and High Wycombe, 1975. ISBN 0852641990.
22 S Natarajan, M McHenry, S Lipsitz, N Klar, and S Lipshultz. Agreement between two ratings with different ordinal scales. In N. Balakrishnan, Jean-Louis Auget, N. Balakrishnan, Mounir Mesbah, and Geert Molenberghs, editors, Advances in Statistical Methods for the Health Sciences, Statistics for Industry and Technology, pages 139–148. Birkhäuser Boston, 2007. ISBN 978-0-8176-4542-7.
23 G E Noether. Elements of nonparametric statistics. SIAM series in applied mathematics. Wiley, 1967.
24 A Oberthuer, F Berthold, P Warnat, B Hero, Y Kahlert, R Spitz, K Ernestus, R König, S Haas, R Eils, M Schwab, B Brors, F Westermann, and M Fischer. Customized oligonuc-leotide microarray gene expression-based classification of neuroblastoma patients outper-forms current clinical risk stratification. Journal of Clinical Oncology, 24(31):5070–5078, 2006.
25 R Core Team. R: A Language and Environment for Statistical Computing. R Foundation for Statistical Computing, Vienna, Austria, 2012. URLhttp://www.R-project.org.
26 G Rustici, N Kolesnikov, M Brandizi, T Burdett, M Dylag, I Emam, A Farne, E Hastings, J Ison, M Keays, N Kurbatova, J Malone, R Mani, A Mupo, R Pedro Pereira, E Pilicheva, J Rung, A Sharma, Y A Tang, T Ternent, A Tikhonov, D Welter, E Williams, A Brazma, H Parkinson, and U Sarkans. ArrayExpress update–trends in database growth and links to data analysis tools. Nucleic Acids Research, 41(D1):D987–D990, November 2012.
27 Eric Schulte, Dan Davison, Thomas Dye, and Carsten Dominik. A multi-language comput-ing environment for literate programmcomput-ing and reproducible research. Journal of Statistical Software, 46(3):1–24, 1 2012.
28 M E Shy, J Blake, K Krajewski, D R Fuerst, M Laura, A F Hahn, J Li, R A Lewis, and M Reilly. Reliability and validity of the cmt neuropathy score as a measure of disability.
Neurology, 64(7):1209–14, Apr 2005.
29 G K Smyth. Linear Models and Empirical Bayes Methods for Assessing Differential Ex-pression in Microarray Experiments. Statistical Applications in Genetics and Molecular Biology, 3 : Iss. 1(3), 2004.
30 L H Sobin, M K Gospodarowicz, Ch Wittekind, and International Union against Cancer.
TNM classification of malignant tumours. Wiley-Blackwell, Chichester, West Sussex, UK; Hoboken, NJ, 2010.
31 W N Venables and B D Ripley.Modern Applied Statistics with S. Statistics and Computing. Springer, 2002. ISBN 9780387954578.
32 H A Wolff, J Bosch, K Jung, T Overbeck, S Hennies, C Matthias, C F Hess, R M Roedel, and H Christiansen. High-grade acute organ toxicity as positive prognostic factor in primary radio(chemo)therapy for locally advanced, inoperable head and neck cancer. Strahlenther-apie und Onkologie, 186(5):262–268, April 2010.