ViBe (Virtual Berlin) - Immersive Interactive 3D Urban Data
Visualization
Immersive interactive 3D urban data visualization
Louna Al Bondakji
1, Anne-Liese Lammich
2, Liss C. Werner
3 1,2,3TU Berlin
1,2
{louna.albondakji|a.lammich}@campus.tu-berlin.de
3liss.c.werner@tu-berlin.
de
The project investigates the possibility of visualizing open source data in a 3D
interactive virtual environment. We propose a new tool, `ViBe'. We programmed
`ViBe' using Unity for its compatibility with HTC VIVE glasses for virtual reality
(VR). ViBe offers an abstract visualization of open source data in a 3D interactive
environment. The ViBe environment entails three main topics a) inhabitants, b)
environmental factors, and c) land-use; acting as representatives of parameters
for cities and urban design. Berlin serves as a case study. The data sets used are
divided according to Berlin's twelve administrative districts. The user immerses
into the virtual environment where they can choose, using the HTC Vive
controllers, which district (or Berlin as a whole) they want information for and
which topics they want to be visualized, and they can also teleport back and forth
between the different districts. The goal of this project is to represent different
urban parameters an abstract simulation where we correlate the corresponding
data sets. By experiencing the city through visualized data, ViBe aims to provide
the user with a clearer perspective onto the city and the relationship between its
urban parameters. ViBe is designed for adults and kids, urban planners,
politicians and real estate developers alike.
Keywords:
3D-Visualization, open source data, immersive virtual reality,
interactive , Unity
INTRODUCTION
We are living in a digital era, where all kind of data is constantly being collected; known as Big Data. Since a large amount of data is provided as open source, we have access to multiple datasets of information. We also live in an age, where ecological and economic sustainability is driving forces and are specifically
de-fined by the UN Conference on Environment and De-velopment [1] and the Kyoto Protocol in 1992 [3].
The paper is structured in four parts. In the first part (Context) we will describe the scientific (litera-ture review) and realistically relevant stakeholders. In the second part (Data and Berlin) we will talk about the data sources we used to get our data. In the third
part (Vibe in operation) we will talk about the visu-alization tool ViBe, hardware and software require-ments, and the virtual experience. In the fourth part (Outlook) we will talk about possibilities for further development of the ViBe.
CONTEXT
For a smarter and sustainable city planning, we see the possibility to use the already existent and avail-able urban data (Huang et al. 2018). Two fundamen-tal questions arise:
• a) what is the relevance of different data sets in the context of urban planning?
• b) how can we translate the complex, wide-ranged and various data sets, mentioned in a), in an understandable and clear way? • c) how can we include the behavior of many
stakeholders as possible?
In order to explore those questions, we developed the first MVP (minimal viable product), called ViBe. To define sustainability, the UN Conference on Environ-ment and DevelopEnviron-ment named three equal and fun-damental pillars: ecology, economy, and social affairs [1]. On the basis of these three pillars, ViBe focuses on three topics: environmental factors (ecology), land-use (economy), and inhabitants (social affairs). The
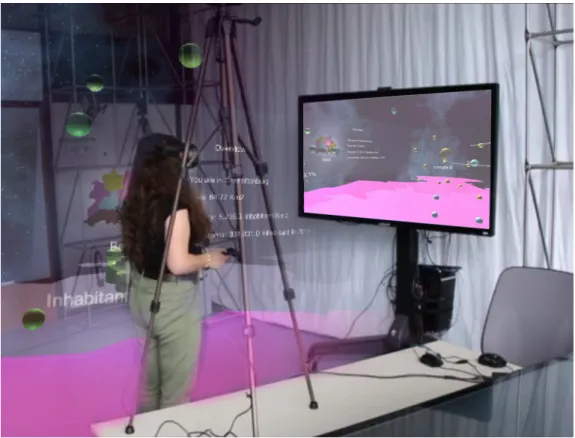
Figure 1 ViBe in action
data sets for these topics usually come in the shape of numbers in spreadsheets (Excel), graphical images or GIS, and normally each source gives just one type of information, which makes it hard for comparisons. To provide an overview for comparison and analysis of the multiple information, it is beneficial to corre-late relevant data sets, that are important to a cer-tain focus. To comprehend such large and complex data sets some form of visualization is useful (Mozza-fari et al. 2008, p.145). A 3D-environment generally allows us to visualize multiple data sets at the same time while staying distinguishable. The information the data sets carry is hard to understand, analyze and evaluate.
An immersive 3D-environment in specific - with the visualized data embedded - enables the user to experience the data with multiple senses, allows the user to focus better and therefore raises the ability to assimilate larger information (Donalek et al. 2015, p.610). Once the user wears a head-mounted display and is completely surrounded by the virtual environ-ment, the user experiences Immersive VR (Suh, and Lee 2005, p.673-675).
In a former project at Technical University Berlin (VR-visualization of High-dimensional Urban Data) the possibility of Visualizing Geodata using Rhino and Grasshopper in virtual reality was researched. The Oculus Rift was used as the virtual reality gear. The grasshopper algorithm visualizes data for the theme land-use. The virtual environment is a cube and each side of the cube shows information for one category of land-use. The data for Berlin is divided into 8 parts and the user can choose one part at a time to get visualized data for. (Al Bondakji et al.2018) The recent project “DXR: A Toolkit for Building Immersive Data Visualizations” developed by a col-laboration of Harvard Visual Computing Group, Har-vard Graduate School of Design, School of Informat-ics at Edinburgh University, Immersive AnalytInformat-ics Lab at Monash University and Ulsan National Institute of Science and Technology is taking on the challenge of how to make the medium of augmented and vir-tual reality easier for visualization, even for
develop-ers without programming skills, by providing a visu-alization toolkit for Unity that enables easy and quick edit within virtual reality. (Sicat et al.2019)
For individual analyzation and creation of argu-mentation, data has to be gathered by trustworthy neutral institutions and shared as open source. As there are multiple providers for different kinds of data sets, they all have their own format. To enable a de-liberate sustainable city development various stake-holder and their interests and concerns have to be in-volved and considered in the decision-making pro-cess. For urban planners to regard all the relevant factors, it’s necessary to enable access to the rele-vant data sets and provide an overview. The data has to be translated into an easily understandable and comparable format. The ViBe takes on this chal-lenge and therefore targets the various stakeholders involved in the decision-making process, especially municipal departments responsible for urban devel-opment, and urban planners, who have to consider all parties and find urban solutions, by gathering all relevant data sets in one comprehensive and clarified setting to improve analyzation and decision-making processes.
DATA AND BERLIN
The basic requirements for the ViBe to be applied to cities is:
• 1) collection of relevant data sets by trustwor-thy neutral sources, according to the three main topics (inhabitants, land-use, environ-mental factors);
• 2) access to the data sets as open source; • 3) comparable file format of the different data
sets.
Our biggest challenge was data obtaining since our goal was to use open source data, we needed to find the relevant data for our topics in a format that we can work with. The Berlin Senate is dedicated to lead the city towards a smarter and more digitized future. How to achieve this goal is described in the ‘Smart City Strategy Berlin’ passed by the Senate in 2015,
Figure 2 Workflow
which lists digitalization and freely available informa-tion as one of the most important aspects [2]. There-fore, the Senate continuously collects data on a wide range of topics and provides it as open source. The open source data used includes,
• a)“AfS StatIS-BBB - Das Statistische Informa-tionssystem Berlin Brandenburg” specialized in Berlin data that provides detailed statistical data sheets regarding urban, economic, eco-logical and more topics that gave us data for the inhabitants category,
• b) Fis-Broker [4] an online platform that pro-vides maps on all kinds of topics for Berlin, in-cluding the data sets we used for the environ-mental factors category,
• c) and Geofabrik [5] an online platform that provides GEO data extracted from open street maps. We used it to get land use data for Berlin.
The statistical data that we got from the AfS StatIS-BBB was mainly in the form of excel sheets and divided into the twelve districts of Berlin. The district is the smallest geographical scale available for the rel-evant inhabitants’ data. This is therefore reflected in how the ViBe is built. The Geodata (SHP and WFS files) was handled with QGIS, then exported as CSV and connected to unity. We filtered most of the data used manually, this means that at this moment au-tomatic actualization of the data is not possible. The
three main topics were covered for Berlin and the re-quirements for ViBe fulfilled. That is why Berlin was chosen as the case study for this project.
VIBE IN OPERATION
ViBe is an interactive immersive virtual reality envi-ronment, where open source data for Berlin is rep-resented in an abstract way. ViBe visualizes data in three main topics: inhabitants, land-use and environ-mental factors. It is programmed using Unity (a gam-ing engine). As Unity is a game engine it already pro-vides presets for interactivity within 3D environment and is compatible with the HTC VIVE 3D glasses. Each topic is characterized by an assigned icon and color scheme and divided into subtopics that reflect dif-ferent urban parameters. The environment is built mainly on three levels: the first level is Berlin, where data for the city as a whole is represented; the second level is the district, where the user can choose from the twelve administrative districts of Berlin and then gets the relevant data visualized; the third level is the overview of the chosen district, where the user gets the information as a visualized 3D-model, can hold it in hand and rotate it. The data is collected and then filtered, combined and connected to the Unity code. As the purpose is to communicate the urban data in an easy and understandable way, the values are con-verted into percentages and set in relations to one another. The data is visualized as floating spheres, whereas the heights symbolize the percentage share.
As set-up, a computer that is compatible with the HTC VIVE [6], the VIVE 3D glasses set, and a 2.5m X 2.5m free space for the user to move in while wearing the head-mounted display, are necessary.
After putting on the head-mounted display the user gets immersed in the virtual environment. In or-der to visualize data, the user interacts with his sur-rounding by selecting visualized objects with his con-trollers. Three 3D icons define the topics using color schemes as identification marks: inhabitants - green; land-use - blue; environmental factors - yellow. After choosing the icon, data spheres, representing the dif-ferent urban parameters related to the topic, would appear. The heights of the spheres symbolize the percentage share, by clicking on the data sphere the
user then gets more detailed information. In each level, there is also a screen that provides general data and helps the user with orientation and navigation by showing where they are and enable the user to switch districts by clicking on one of the districts on a map of Berlin.
OUTLOOK
A possible feature that could be added is to include more accurate location-based data, this way the in-formation provided by ViBe could be more precise, showing data in a defined radius, i.e. 1km, around a chosen plot of land or address. This could be used to support planning a city of short ways by depict-Figure 3
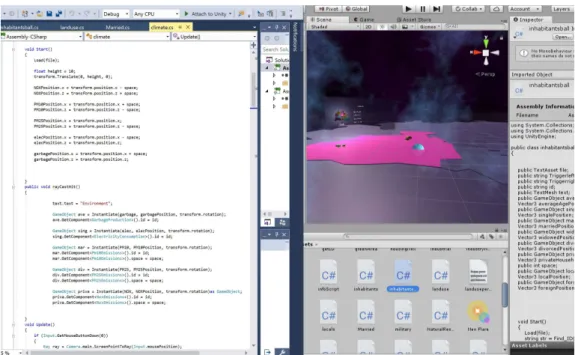
Figure 4 Coding
ing discrepancies accessible by foot. Another feature is adding a timestamp and timeline where the user could see the development in the past as well as the future prognosis of certain parameters, and thus can analyze, i.e., correlations between them. The user could also simulate optimal and worst-case scenar-ios, or long-term influence of certain parameters, by adding prognosed impacts of possible interventions or trends in cities. For now, ViBe only contains Berlin data, however, it could also be implemented in other cities, as long as those cities meet the basic require-ments mentioned above. We are also considering the accessibility and edit possibilities to customize ViBe according to the situation, i.e., by adding required data sets or simplify the application to other cities or communities, without the need to edit the code itself. We are planning to offer citizens access to ViBe. By doing so we envisage to enhance the development of their reasoning in the current urban development
discussions on one hand and to possibly better un-derstand the final decisions taken.
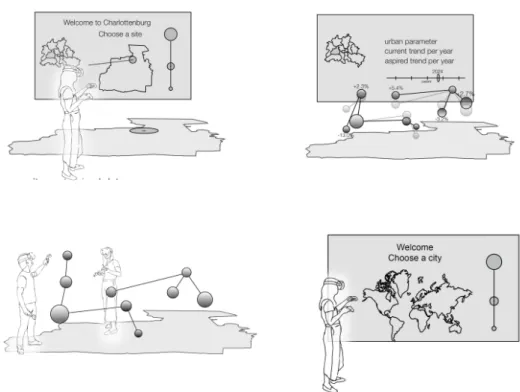
Figure 5
Virtual environment
CONCLUSION
ViBe wants to make data more accessible and -first and foremost- easier to understand by all parties and stakeholders involved and affected by
urban-planning-decisions. By visualizing the urban data in an interactive immersive VR environment, we aim to provide a framework for an interdisciplinary look into urban complexity and path the way for targeted dis-cussions. The intense immersive virtual reality and the possibilities of interaction implement a fun fac-tor, transmitting complex data in a fun and abstract but therefore comprehensive way, without visual dis-traction from outside. The goal of this project is to represent clearly the different urban parameters; en-vironmental factors (ecology), land-use (economy), and inhabitants (social affairs), in an abstract simula-tion. We started the first prototype using data from Berlin; in a next step, we are planning to insert data
from a different city with similar characteristics in or-der to test if we can use ViBe also for comparison and thus, create a new way of differentiating and evaluat-ing decisions that were taken in the past.
ACKNOWLEDGMENT
We wish to thank Professor Raoul Bunschoten for his supervison and advise and the chair of the de-partment for Sustainable Urban Planning and De-sign, Institute of Architecture, Technical University of Berlin for supporting the research conducted. Fur-ther thanks to of the Chora Conscious-City-Lab of Prof. Dipl. Raoul Bunschoten specially Daniel Schulz for their hardware and assistance.
Figure 6 Future Features
REFERENCES
Al Bondakji, LA, Chatzi, AMC, Haidari Tabar, MHT, wesseler, LMW and Werner, LCW 2018 ’VR-VISUALIZATION OF HIGH-DIMENSIONAL URBAN DATA’,in Proceedings of eCAADe 2018, Lodz, pp. 773-780
Donalek, CD, Djorgovski, SGD, Cioc, AC, Wang, AW, Zhang, JZ, Lawler, EL, Yeh, SY, Mahabal, AM, Graham, MG and Drake, AD 2014 ’Immersive and Collabo-rative Data Visualization Using Virtual Reality Plat-forms’,in IEEE International Conference on Big Data, pp. 610-613
Huang, TH, Dang, AD, Cheng, HC, Peng, XP and ZHU, ZZ 2010 ’Digital urban planning oriented data warehouse constructing supported by GIS: Taking Greater Beijing regional planning as a case’, Pub-lished in 18th International Conference on Geoinfor-matics 2010
Mozzafari, EM and Seffah, Ahmed 2008 ’From Visualiza-tion to Visual Mining: ApplicaVisualiza-tion to Environmental Data.’,in First International Conference on Advances in Computer-Human Interaction
Sicat, RS, Li, JL, Choi, JC, Cordeil, MX, Joeng, WKJ, Bach, BB and Pfister, HP 2019, ’DXR: A Toolkit for Build-ing Immersive Data Visualizations.’,IEEE Transactions on Visualization and Computer Graphics, 25(01), pp. 715-725
Suh, KSS and Lee, YEL 2005, ’The Effects of Virtual Reality on Consumer Learning: An Empirical Investigation’,
MIS Quarterly, 29(04), pp. 673-697 [1] https://www.nachhaltigkeit.info/artikel/1_3_a_drei _saeulen_modell_1531.htm. [2] https://www.stadtentwicklung.berlin.de/planen/for en_initiativen/smart-city/download/Strategie_Smart_C ity_Berlin_en.pdf [3] https://unfccc.int/process-and-meetings/the-kyoto-protocol/what-is-the-kyoto-protocol/what-is-the-kyoto -protocol [4] https://fbinter.stadt-berlin.de/fb/index.jsp [5] https://download.geofabrik.de/ [6] https://www.vive.com/de/ready/