BioMed Central
Page 1 of 10 (page number not for citation purposes)
BMC Public Health
Open Access
Research article
Pedestrian injury and the built environment: an environmental scan
of hotspots
Nadine Schuurman*
1, Jonathan Cinnamon
1, Valorie A Crooks
1and S
Morad Hameed
2Address: 1Department of Geography, Simon Fraser University, Burnaby, Canada and 2Department of Surgery, University of British Columbia,
Vancouver, Canada
Email: Nadine Schuurman* - [email protected]; Jonathan Cinnamon - [email protected]; Valorie A Crooks - [email protected]; S Morad Hameed - [email protected]
* Corresponding author
Abstract
Background: Pedestrian injury frequently results in devastating and costly injuries and accounts for 11% of all road user fatalities. In the United States in 2006 there were 4,784 fatalities and 61,000 injuries from pedestrian injury, and in 2007 there were 4,654 fatalities and 70,000 injuries. In Canada, injury is the leading cause of death for those under 45 years of age and the fourth most common cause of death for all ages Traumatic pedestrian injury results in nearly 4000 hospitalizations in Canada annually. These injuries result from the interplay of modifiable environmental factors. The objective of this study was to determine links between the built environment and pedestrian injury hotspots in Vancouver.
Methods: Data were obtained from the Insurance Corporation of British Columbia (ICBC) for the 6 year period from 2000 to 2005 and combined with pedestrian injury data extracted from the British Columbia Trauma Registry (BCTR) for the same period. High incident locations (hotspots) for pedestrian injury in the City of Vancouver were identified and mapped using geographic information systems (GIS), and the characteristics of the built environment at each of the hotspot locations were examined by a team of researchers.
Results: The analysis highlighted 32 pedestrian injury hotspot locations in Vancouver. 31 of 32 hotspots were situated on major roads. Likewise, the majority of hotspots were located on downtown streets. The 'downtown eastside' was identified as an area with multiple high-incident locations, including the 2 highest ranked pedestrian injury hotspots. Bars were present at 21 of the hotspot locations, with 11 of these locations being judged to have high alcohol establishment density.
Conclusion: This study highlighted the disproportionate burden of pedestrian injury centred on the downtown eastside area of Vancouver. The environmental scan revealed that important passive pedestrian safety countermeasures were only present at a minority of high-incident locations. More importantly, bars were highly associated with risk of pedestrian injury. This study is the basis for potential public health intervention by clearly indicating optimal locations for signalized pedestrian crosswalks.
Published: 14 July 2009
BMC Public Health 2009, 9:233 doi:10.1186/1471-2458-9-233
Received: 12 January 2009 Accepted: 14 July 2009 This article is available from: http://www.biomedcentral.com/1471-2458/9/233
© 2009 Schuurman et al; licensee BioMed Central Ltd.
This is an Open Access article distributed under the terms of the Creative Commons Attribution License (http://creativecommons.org/licenses/by/2.0), which permits unrestricted use, distribution, and reproduction in any medium, provided the original work is properly cited.
BMC Public Health 2009, 9:233 http://www.biomedcentral.com/1471-2458/9/233
Page 2 of 10 (page number not for citation purposes)
Background
The World Health Organization [1] estimates that more than five million people around the world die annually as a result of injury. Half-a-million are in high-income coun-tries alone, where they account for 6% of all deaths. In high-income countries, road traffic injuries (including pedestrian trauma), self-inflicted injuries and interper-sonal violence are the three leading causes of death among people aged 15–29 years [2]. In Canada, injury is the leading cause of death for those under 45 years of age and the fourth most common cause of death for all ages. Collisions between motor-vehicles and pedestrians claim hundreds of lives and injure tens of thousands annually [3]. Traumatic pedestrian injury, in particular, results in around 4000 hospitalizations in Canada each year [4]. These injuries often result from the interplay of modifia-ble or preventamodifia-ble environmental factors [5]. Addressing the environmental factors related to pedestrian injury thus represents an important public health opportunity. Active interventions to reduce the toll of pedestrian injury centre on educating drivers and pedestrians in road safety and enforcement of traffic safety laws, while passive inter-ventions largely involve modifications to the built-envi-ronment [6,7]. Designing pedestrian-friendly roadways has the potential to reduce pedestrian injury [7,8]; how-ever the movement of motorized vehicles remains the pri-mary design objective for road engineers, while pedestrian safety is often an afterthought [9,10]. Research has linked aspects of the built environment, roadway infrastructure, and types of land-use to an increase or decrease in the risk of pedestrian injury. For example, roadway design factors including curb parking, long blocks, and the absence of marked and signalized crosswalks are associated with an increase in the risk of collisions between pedestrians and vehicles. Certain types of land uses have been linked with increases in pedestrian injury incidence, in particular schools and alcohol serving establishments [11-22]. Lower vehicle speeds, exclusive turn phasing at intersec-tions, and medians have been shown to reduce pedes-trian-vehicle encounters [8]. These and other environmental countermeasures are highly-effective, low-cost solutions that can be implemented at high-risk sites to help reduce the burden of pedestrian injury [23]. Geographic Information Systems (GIS) are a valuable tool for epidemiological research [24]. A handful of pedestrian injury studies have used GIS to analyze incident locations; however, few of these studies include a comprehensive analysis of the environmental factors that may be contrib-uting to the risk of pedestrian injury [25-27]. The goals of this study were (i) to use GIS to determine pedestrian injury hotspot locations in the City of Vancouver and (ii) to determine key characteristics of the built-environment that may contribute to increased risk of pedestrian injury. Results of this study highlight important areas of the city
that should be targeted for safety interventions, and may be useful for directing strategies to implement environ-mental countermeasures. In addition, this study intro-duces an innovative methodological advancement in using GIS-based hot spot analysis in combination with a detailed environmental scan.
Methods
In this study, high incident locations (hotspots) for pedes-trian injury in the City of Vancouver were identified using GIS, and the characteristics of the built environment at each of the hotspot locations were examined. Two pedes-trian injury data sources were combined for the analysis: The Insurance Corporation of British Columbia's (ICBC) pedestrian-vehicle collision data for the 6 year period from 2000 to 2005 inclusive, and the British Columbia Trauma Registry's (BCTR) pedestrian injury records for the 6 year period 2001 to 2006 inclusive. The ICBC source records all reported incidents, while the BCTR source records all incidents that resulted in a hospital stay of two days or more. Combined, and with duplicate records removed, data from the two sources can be considered representative of the majority of injuries from pedestrian-vehicle collisions over a given 6 year period. It should be noted that each record involved one person. If a road traf-fic collision involved two people, then there would be two incidents for that particular hotspot. For the purposes of this study, hotspots were determined to be locations where a minimum of 5 incidents were recorded in both datasets combined. Hotspots were then ranked according to the number of incidents recorded over the 6 year period. More severe incidents were ranked equally with "near misses" recorded as minor injuries. The rationale for this is that these minor incidents were as potentially lethal.
Incident locations were mapped using ArcGIS 9.2, [28] georeferenced to either an intersection or midblock loca-tion. The ICBC data were mapped according to latitude and longitude coordinates provided in the dataset for each incident location. The BCTR data were geocoded based on the street address or intersection where the inci-dent occurred which was available in the dataset. The fre-quency of non-mappable records was negligible, and all data were assumed to be accurate and complete. A kernel density map was created to allow for a simple visual exam-ination of incident locations and precise identification of all hotspots. A kernel search distance of 100 m was used, as it proved to be the most appropriate distance for high-lighting unique incident locations. Elements of the built-environment and roadway design were recorded at each of the hotspot locations to examine their potential contribu-tion to pedestrian injury. A team of 4 researchers inde-pendently surveyed each hotspot to assess 14 pre-determined built-environment characteristics, and recorded any other particularities observed at each
loca-BMC Public Health 2009, 9:233 http://www.biomedcentral.com/1471-2458/9/233
Page 3 of 10 (page number not for citation purposes) tion (e.g., changes in roadway slope). Prior to the
obser-vational period the investigators met to discuss how each variable should be interpreted in order to enhance the consistency of recorded data. The four investigators inde-pendently completed their observations at each intersec-tion on a standard recording sheet and then immediately met to compare notes and resolve any disagreements or differences in interpretation. Overall there was very little disagreement in the data recorded on the standard sheet across investigators and any that did occur was easily resolved through discussion at the intersection. Finally, all investigators reviewed and agreed with the data shared in the summative table produced (see Table 1).
The environmental scan was conducted between 10 am and 3 pm to avoid encountering high traffic volume and associated congestion. Factors that have been shown to increase risk that were included in the assessment were long blocks, presence of bus stops, curb parking, absence of controlled crosswalks, and visual obstructions. Protec-tive factors assessed were the presence of traffic calming measures, medians or pedestrian refuge islands, and exclusive turn signals at intersections. Factors that contrib-ute to location complexity were the number of signs, number of approach lanes, and whether a vehicle turning ban was in effect. Also recorded were the densities of bars, retail establishments, and schools in proximity to the hotspot locations. Privacy was protected both use of the kernel density method and by the clustering of incidents into hotspots of greater than 5 collisions.
Ethics approval for this study was granted from the Office of Research Services at Simon Fraser University (file #37437).
Results
A total of 2358 pedestrian-vehicle collisions were recorded within the City of Vancouver over the 6 year period, for an average annual pedestrian injury incidence rate of 66.6/100,000 residents. Intersections – rather than midblock locations – accounted for 61% of all incidents. Our analysis highlighted 32 pedestrian injury hotspot locations in the City of Vancouver for this time period. Figure 1 shows the intersections and midblock locations where pedestrian injuries were recorded and illuminates the high density locations. The darkest shades indicate the higher density hotspots. Of the 32 hotspots, 21 (66%) were at intersections while 11 were at midblock locations. Thirty-one of 32 hotspots were situated on either major collector or major arterial roads, with just one at a mid-block location of a minor traffic-restricted street. Overall, most hotspots were located on downtown streets. The downtown eastside (DTES) area was particularly high-lighted as an area with multiple high-incident locations, including the 2 highest ranked pedestrian injury hotspots.
Also of interest is the east-west Broadway corridor – a retail intensive commercial stretch.
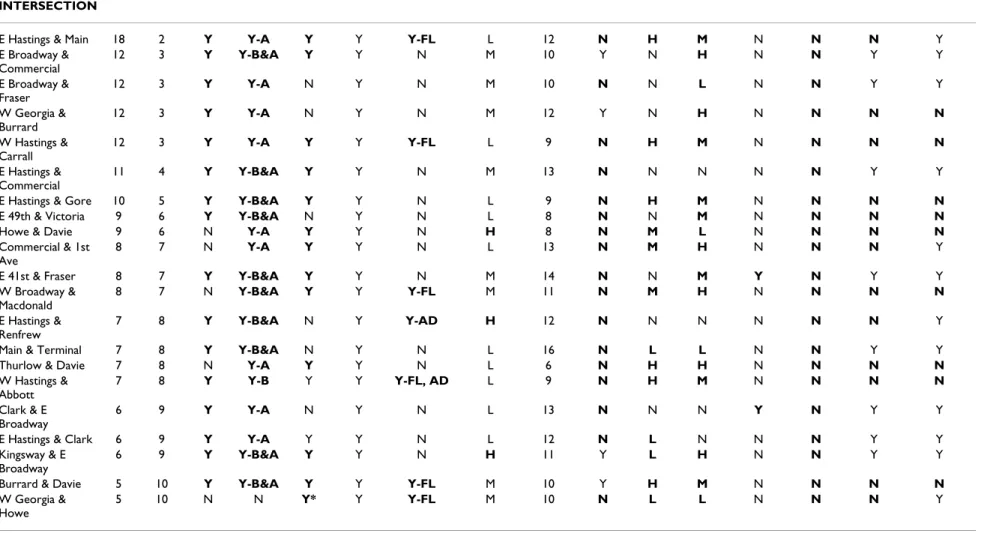
Results of the hotspot environmental scan are shown in Table 1. The results of primary interest are highlighted in the table, indicating the presence of demonstrated risk fac-tors for pedestrian injury, or lack of pedestrian safety countermeasures in place at the location. For a majority of midblock and intersection hotspots, long blocks, bus stops, and curb parking were recorded. Only 1 of the 11 midblock locations had a marked and signalized pedes-trian crosswalk. Regarding visual obstructions, a minority of locations had advertising or flora which was deemed to be intrusive. Complex signage was observed at just 3 hotspots. The number of approach lanes varied from 2 to 6 for midblock locations with 6 being the most common, and from 6 to 14 for intersections, with 12 the most com-mon. Just 4 of 21 intersections had a turning ban imposed. Almost all (26) locations had retail establish-ments nearby, with 9 considered to be in high retail den-sity areas. Only 2 locations were situated near schools, and only 1 had traffic-calming measures in place. Nine of 32 hotspots had medians or traffic refuge islands, and 12 of 21 intersections had exclusive turning signals. Bars were present at 21 of the hotspot locations, with 11 of these locations judged to have high alcohol serving establish-ment density.
Discussion
The mapping of Vancouver's pedestrian injury hotspots revealed an intriguing spatial pattern. As may be expected, there were more high-incident locations in downtown areas compared with outer areas of the city; however, the disproportionate number of hotspots in a small area of the DTES is conspicuous. Nine of 32 hotspots, and fully 10 per cent of total pedestrian injuries in Vancouver, were recorded within this small part of the downtown core. This area is notorious as the epicentre of homelessness in Vancouver in which large numbers of homeless and other marginalized individuals congregate along Hastings and adjacent streets. It is also where a large number of services aimed at homeless, drug addicted, and/or mentally ill per-sons are located. It is also likely that the number of alco-hol-serving retail establishments within the DTES was a strong factor with respect to the number of hotspots in the area. This is consistent with the existing literature [11-18]. The authors hypothesize that a combination of mental ill-ness, despondency associated with homelessness and high alcohol and substance abuse contributed to the con-centration of pedestrian injury in the DTES.
The scan of roadway infrastructure and built-environment characteristics at pedestrian injury hotspots in Vancouver produced two findings of interest. The most striking find-ing was the frequent presence of demonstrated
environ-BM C Public Health 2 009, 9 :233 http://ww w.b iomed central.com/1 471 -2 458 /9 /23 3 Pa ge 4 of 1 0 (page nu mber not for cit a ti on pur poses)
Table 1: Results of the hotspot environmental scan
LOCATION Incidents Contribute to Risk Complexity Land Use Safety Measures MIDBLOCK total rank long
block bus stop
curb park
X walk obstruction sign- age # lanes L/R ban bars retail school calming median excl. turn
E Hastings btw Columbia & Main
49 1 Y Y Y N N L 6 N/A H M N N N N/A
E Hastings btw Jackson & Dunlevy
10 5 Y Y Y N Y-AD L 6 N/A M M N N N N/A
E Hastings btw Main & Gore
9 6 Y Y Y N Y-FL L 6 N/A H M N N N N/A
Burrard btw Nelson & Comox
8 7 Y Y Y N N L 6 N/A N L N N N N/A E Hastings btw Kamloops & Penticton 8 7 Y N Y N N L 6 N/A N H N N N N/A Granville btw Georgia & Dunsmuir
8 7 Y Y N N Y-FL L 2 N/A L H N Y N N/A
E Hastings btw Heatley & Hawks
7 8 Y N Y N N L 6 N/A M M N N N N/A Granville btw Nelson & Helmcken 7 8 N Y Y N N L 4 N/A H H N N N N/A Main btw National & Terminal 6 9 N Y N N N L 7 N/A H L N N Y N/A W Georgia btw Howe & Granville
5 10 N Y Y* N Y-FL L 6 N/A N N N N N N/A
W Hastings btw Carrall & Abbott
BM C Public Health 2 009, 9 :233 http://ww w.b iomed central.com/1 471 -2 458 /9 /23 3 Pa ge 5 of 1 0 (page nu mber not for cit a ti on pur poses) INTERSECTION
E Hastings & Main 18 2 Y Y-A Y Y Y-FL L 12 N H M N N N Y
E Broadway & Commercial 12 3 Y Y-B&A Y Y N M 10 Y N H N N Y Y E Broadway & Fraser 12 3 Y Y-A N Y N M 10 N N L N N Y Y W Georgia & Burrard 12 3 Y Y-A N Y N M 12 Y N H N N N N W Hastings & Carrall 12 3 Y Y-A Y Y Y-FL L 9 N H M N N N N E Hastings & Commercial 11 4 Y Y-B&A Y Y N M 13 N N N N N Y Y
E Hastings & Gore 10 5 Y Y-B&A Y Y N L 9 N H M N N N N
E 49th & Victoria 9 6 Y Y-B&A N Y N L 8 N N M N N N N
Howe & Davie 9 6 N Y-A Y Y N H 8 N M L N N N N
Commercial & 1st Ave
8 7 N Y-A Y Y N L 13 N M H N N N Y
E 41st & Fraser 8 7 Y Y-B&A Y Y N M 14 N N M Y N Y Y
W Broadway & Macdonald 8 7 N Y-B&A Y Y Y-FL M 11 N M H N N N N E Hastings & Renfrew 7 8 Y Y-B&A N Y Y-AD H 12 N N N N N N Y
Main & Terminal 7 8 Y Y-B&A N Y N L 16 N L L N N Y Y
Thurlow & Davie 7 8 N Y-A Y Y N L 6 N H H N N N N
W Hastings & Abbott 7 8 Y Y-B Y Y Y-FL, AD L 9 N H M N N N N Clark & E Broadway 6 9 Y Y-A N Y N L 13 N N N Y N Y Y
E Hastings & Clark 6 9 Y Y-A Y Y N L 12 N L N N N Y Y
Kingsway & E Broadway
6 9 Y Y-B&A Y Y N H 11 Y L H N N Y Y
Burrard & Davie 5 10 Y Y-B&A Y Y Y-FL M 10 Y H M N N N N
W Georgia & Howe
5 10 N N Y* Y Y-FL M 10 N L L N N N Y
btw = between, B = before, A = after, FL = flora, AD = advertising, N/A = not applicable, * = illegal, H = high, M = medium, L = low, Y = yes, N = no.
BMC Public Health 2009, 9:233 http://www.biomedcentral.com/1471-2458/9/233
Page 6 of 10 (page number not for citation purposes) mental risk factors, coupled with a scarcity of
traffic-calming and passive pedestrian safety countermeasures at many of the high-incident locations. A second important finding from the environmental scan was that bars were closely situated to many of the hotspots.
The Absence of Pedestrian Safety Countermeasures
Road safety research has highlighted the influential roles that road infrastructure and the local environment at col-lision sites contribute to the occurrence of pedestrian injury [29]. Passive safety measures including the devel-opment of safe road infrastructure have been successful in reducing the burden of pedestrian injury [30]. Road-divid-ing medians were absent from a majority of high-incident locations, despite nearly all of the hotspots occurring on major arterial and collector roads. It has been shown that medians or pedestrian refuge islands can reduce pedes-trian injury as they promote a two-stage crossing on busy
streets and a slight reduction in vehicle speeds [31]. Implementation of medians or refuge islands is likely pos-sible at many of the hotspot locations in which they are absent. The highest-ranked intersection location at Hast-ings and Main Streets (Figure 2) is a good candidate for installation of a roadway-dividing median which will allow for a two stage crossing if needed, and will likely reduce vehicle speeds in this pedestrian-congested area. Another roadway modification designed with the pedes-trian in mind (and endorsed by the City of Vancouver) is corner sidewalk bulges to reduce crossing times for pedes-trians [32]. Figure 3 shows a location with a corner bulge in place. Medians and bulges at this hotspot location may require lane narrowing, or a possible lane removal which may result in reduced vehicle flow on this thoroughfare; however, the potential to increase pedestrian safety at this high-incident location should be paramount.
The intersections and midblock locations where pedestrian injuries were recorded, illuminating the high density locations Figure 1
The intersections and midblock locations where pedestrian injuries were recorded, illuminating the high den-sity locations.
BMC Public Health 2009, 9:233 http://www.biomedcentral.com/1471-2458/9/233
Page 7 of 10 (page number not for citation purposes) The absence of marked and signalized pedestrian
cross-ings at all but one midblock location is of particular con-cern. Well-marked crosswalks with a pedestrian-controlled signal can reduce pedestrian-vehicle conflicts [33]. Another option that has been shown to be effective at midblock locations are non-signalized crosswalks with in-pavement lights that flash when a pedestrian is present [34]. These were not present at any of our hotspot loca-tions. The midblock location on Hastings St. between Columbia and Main was by far the highest ranked inci-dent location (Figure 4). This is one of the main areas of the DTES where large groups of homeless people congre-gate, and is also the precise location of Insite, the govern-ment-sponsored controlled safe drug injection facility. These are likely factors in the disproportionately large number of pedestrian-vehicle collisions at this location; however, no crosswalk, traffic-calming measures, or pedestrian safety interventions are in place at this
mid-block location. The City of Vancouver has committed to providing midblock crossings on downtown streets near "significant pedestrian generators that create high demands for pedestrian crossing at mid-block" [32]. Fig-ure 5 shows a signalized crosswalk and median at a mid-block location on Expo/Pacific Blvd. This type of roadway design/traffic calming measure could potentially improve pedestrian safety at this very high-incident location on Hastings St. Indeed, this study is the basis for concerted and directed intervention on the part of public safety offi-cials. Moreover, it provides a protocol for determining and studying hotspot locations in other cities.
The Presence of Bars and Alcohol Serving Establishments
Alcohol consumption by pedestrians is a recognized fac-tor influencing their risk of collision with a vehicle; how-ever it is often overlooked as an issue in comparison with alcohol consumption by drivers. Recent consumption of alcohol is common in injured pedestrians, and it has been shown that the severity of injuries is frequently greater for this group [35]. The high incidence of injury in alcohol-affected pedestrians may in part be due to the effects of alcohol on the pedestrian's ability to judge gaps in the traffic for safe road-crossing [36]. Pedestrian injury hotspot locations are often in areas with a high density of bars and other alcohol serving establishments. In a spatial analysis of pedestrian injury in San Francisco, LaScala et al. [37] discovered that pedestrian injury was highest in areas with the greatest density of alcohol serving establish-ments, for incidents where the pedestrian had been con-suming alcohol. The results of the present study indicate that bars were located immediately proximal to two-thirds of the hotspots, with almost one-third located in high density bar and alcohol serving establishment areas. Since pedestrian injury patients' alcohol levels are not consist-ently included in the BCTR, we were unable to gauge Intersection at Hastings and Main Streets
Figure 2
Intersection at Hastings and Main Streets.
A location with a corner bulge in place Figure 3
A location with a corner bulge in place.
The midblock location on Hastings St. between Columbia and Main
Figure 4
The midblock location on Hastings St. between Columbia and Main.
BMC Public Health 2009, 9:233 http://www.biomedcentral.com/1471-2458/9/233
Page 8 of 10 (page number not for citation purposes) whether alcohol was a definitive explanation for the
cor-relation between bars and injuries. However, there is ample reason to suspect that this is the case and policy should proceed accordingly.
Active interventions such as educating the customer and service establishment in safe drinking guidelines have been used to varying success [14]; however, more effective countermeasures may involve modifying the roadway environment or calming traffic to increase the safety of alcohol-affected pedestrians. Results of a study by Lenné et al. [38] suggest that modifying traffic signals at high-risk times (late evening and early morning) could help reduce injury in this group. Specifically, if traffic signals in areas of high alcohol establishment density were set to 'dwell-on-red' in all directions when no vehicles were present, then the average speed of vehicles would drop, thus creat-ing a safer pedestrian environment. An Australian study proposed that environmental countermeasures such as enhanced street lighting, medians, skid-resistant surfaces, and highly responsive pedestrian operated signals should be implemented in areas with high alcohol-related pedes-trian-vehicle collisions [39].
Our findings did not implicate schools as a type of land use associated with Vancouver's pedestrian injury hotspots, despite the various other studies that have described the risk of pedestrian injury to children at or near schools as an important public health problem [21,40]. Road safety engineering is common in Vancouver on streets surrounding schools; particularly traffic-calm-ing measures such as speed humps, road narrowtraffic-calm-ing, and reduced speed limits designed to prevent pedestrian inju-ries among school children. These passive interventions can reduce the toll of paediatric pedestrian injury near schools through a reduction of speed and traffic volumes
in sensitive areas [41]. Traffic-calming and environmental countermeasures should also be aggressively pursued in other parts of the city, especially in areas of elevated pedestrian use such as Vancouver's DTES and streets with a high density of alcohol serving establishments. There are fewer options available to calm traffic and improve pedes-trian safety on arterial roads; however reducing the width of vehicle lanes can reduce the overall speed of vehicles on busy thoroughfares [42]. Also, a simple reduction of speed limits in high-risk areas is likely to be effective. Measures such as this, coupled with engineering modifica-tions including medians or refuge islands, corner bulges, and controlled midblock crosswalks could be imple-mented with probable benefits for pedestrian safety.
Limitations
This study has several limitations. The socio-demographic characteristics of the location of injury (average income, age of the population), and of the injured pedestrian (age, income, etc.) were not addressed. We focused on the con-tribution of the built-environment to pedestrian injury because much less is known about the relationship between roadway design and land-use type with pedes-trian injury, compared with its social correlates. Also, it is possible that aspects of the built-environment not consid-ered (or overlooked) in our analysis may be associated with pedestrian injury at these hotspot sites. For instance, we did not examine land use in detail nor did we account for weather or traffic volumes. Another limitation may be that the characteristics of a whole area could potentially have a greater effect on pedestrian injury than those of individual incident locations. For example, there is likely an area effect behind the clustering of multiple high-inci-dent locations in the DTES. Also, while our designation of a pedestrian injury hotspot as a location with 5 or more incidents over the time period was done in order to set parameters on the scope of the analysis, there are no firmly established precedents in the literature regarding hotspot determination.
Another potential limitation of this research is the reli-ance on raw numbers of incidents rather than using a denominator population. We did this for several reasons. First, many of the incidents occurred in high traffic areas that were not particularly high population density regions (e.g. the DTES). Thus residential population density would not be a good indicator of pedestrian or road traf-fic. Second, many of the incident locations were not coin-cident with the home residence of the victims. Third, our chief focus was the examination of urban design that facil-itates greater rates of injury.
Conclusion
This study highlighted the disproportionate burden of pedestrian injury centred on the DTES area of Vancouver A signalized crosswalk and median at a midblock location on
Expo/Pacific Blvd Figure 5
A signalized crosswalk and median at a midblock location on Expo/Pacific Blvd.
BMC Public Health 2009, 9:233 http://www.biomedcentral.com/1471-2458/9/233
Page 9 of 10 (page number not for citation purposes) through undertaking a spatial analysis of pedestrian
injury and subsequent environmental scan of hotspots. The environmental scan revealed that some important passive pedestrian safety countermeasures were only present at a minority of high-incident locations. Our find-ings support those of other studies which associate den-sity of bars with pedestrian injury; however, there was no such association with schools. These results provide a foundation for extending pedestrian injury research as well as instituting passive intervention efforts. Future studies should analyze the effectiveness of built-environ-ment modifications on reducing rates of pedestrian injury in areas such as those highlighted in this study.
Competing interests
The authors declare that they have no competing interests.
Authors' contributions
NS conceptualized and designed the study, participated in the environmental scan as well as in writing the paper. JC conducted the spatial analysis, participated in the envi-ronmental scan and contributed substantially to writing the paper. VC participated in the environmental scan and in writing the paper. SMH contributed to the study design and participated in the environmental scan.
Acknowledgements
NS would like to thank the Canadian Institutes of Health Research (CIHR) and the Michael Smith Foundation for Health Research (MSFHR) for their continued career support.
References
1. World Health Organization, 10 facts on injury and violence
[http://www.who.int/features/factfiles/injuries/en/index.html] 2. Peden M, McGee K, Krug EG: Injury: A leading cause of the
glo-bal burden of disease, 2000. Geneva: World Health Organization; 2002.
3. Transport Canada: Pedestrian fatalities and injuries, 1992– 2001. Ottawa 2004.
4. Canadian Institute for Health Information: National Trauma Reg-istry Analytic Bulletin: Pedestrian Injury Hospitalizations in Canada, 2001–2002. Toronto: CIHI; 2004.
5. Van Houten R, Malenfant JEL: Canadian Research on Pedestrian Safety. McLean, VA.: US Department of Transportation, Federal Highway Administration; 1999.
6. Nilsen P: What makes community based injury prevention work? In search of evidence of effectiveness. Inj Prev 2004,
10(5):268-274.
7. Stevenson M: Building safer environments: injury, safety, and our surroundings. Inj Prev 2006, 12(1):1-3.
8. Retting RA, Ferguson SA, McCartt AT: A review of evidence-based traffic engineering measures designed to reduce pedestrian-motor vehicle crashes. Am J Public Health 2003,
93(9):1456-1463.
9. Keegan O, O'Mahony M: Modifying pedestrian behaviour.
Transp Res A: Pol Practice 2003, 37(10):889-901.
10. Jacobsen PL: Why we fight about black spots. Inj Prev 2006,
12(6):356-357.
11. Vestrup JA, Reid JD: A profile of urban pedestrian trauma. J Trauma 1989, 29(6):741-745.
12. Solheim K: Pedestrian deaths in Oslo traffic accidents. BMJ
1964, 1(5375):81-83.
13. Solnick SJ, Hemenway D: Hit the bottle and run: the role of alco-hol in hit-and-run pedestrian fatalities. J Stud Alcohol Drug 1994,
55(6):679-684.
14. Stockwell T: Responsible alcohol service: lessons from evalua-tions of server training and policing initiatives. Drug Alcohol Rev
2001, 20(3):257-265.
15. Williams JS, Graff JA, Uku JM: Pedestrian intoxication and fatal traffic accident injury patterns. Prehospital Disaster Med 1995,
10(1):30-35.
16. Plurad D, Demetriades D, Gruzinski G, Preston C, Chan L, Gaspard D, Margulies D, Cryer HG: Pedestrian injuries: The association of alcohol consumption with the type and severity of injuries and outcomes. J Am Coll Surgeons 2006, 202(6):919-927. 17. LaScala EA, Johnson FW, Gruenewald PJ: Neighborhood
charac-teristics of alcohol-related pedestrian injury collisions: A geostatistical analysis. Prev Sci 2001, 2(2):123-134.
18. Athanaselis S, Dona A, Papadodima S, Papoutsis G, Maravelias C, Koutselinis A: The use of alcohol and other psychoactive sub-stances by victims of traffic accidents in Greece. Forensic Sci Int
1999, 102(2–3):103-109.
19. Clifton KJ, Kreamer-Fults K: An examination of the environmen-tal attributes associated with pedestrian-vehicular crashes near public schools. Accid Anal Prev 2007, 39(4):708-715. 20. Hotz GA, Cohn SM, Nelson J, Mishkin D, Castelblanco A, Li P,
Dun-can R: Pediatric pedestrian trauma study: a pilot project. Traf-fic Inj Prev 2004, 5(2):132-136.
21. LaScala EA, Gruenewald PJ, Johnson FW: An ecological study of the locations of schools and child pedestrian injury collisions.
Accid Anal Prev 2004, 36(4):569-576.
22. Roberts I, Norton R, Taua B: Child pedestrian injury rates: The importance of "exposure to risk" relating to socioeconomic and ethnic differences, in Auckland, New Zealand. J Epidemiol Community Health 1996, 50(2):162-165.
23. World Health Organization: World Report on Road Traffic Injury Prevention. Geneva: WHO; 2004.
24. Dummer TJP: Health geography: supporting public health pol-icy and planning. CMAJ 2008, 178(9):1177-1180.
25. Morency P, Cloutier MS: From targeted "black spots" to area-wide pedestrian safety. Inj Prev 2006, 12(6):360-364.
26. Pulugurtha SS, Krishnakumar VK, Nambisan SS: New methods to identify and rank high pedestrian crash zones: An illustra-tion. Accid Anal Prev 2007, 39(4):800-811.
27. Schneider RJ, Ryznar RM, Khattak AJ: An accident waiting to hap-pen: A spatial approach to proactive pedestrian planning.
Accid Anal Prev 2004, 36(3):193-211. 28. ESRI: ArcGIS. 9.2 edition. Redlands 2006.
29. Flahaut B: Impact of infrastructure and local environment on road unsafety: Logistic modeling with spatial autocorrela-tion. Accid Anal Prev 2004, 36(6):1055-1066.
30. Rivara FP, Mock C: The 1,000,000 lives campaign. Inj Prev 2005,
11(6):321-323.
31. King MR, Carnegie JA, Ewing R: Pedestrian safety through a raised median and redesigned intersections. Washington, DC: Transportation Research Record 1828; 2003.
32. City of Vancouver: Downtown Transportation Plan. Vancouver
2002.
33. Koepsell T, McCloskey L, Wolf M, Moudon AV, Buchner D, Kraus J, Patterson M: Crosswalk markings and the risk of pedestrian-motor vehicle collisions in older pedestrians. JAMA 2002,
288(17):2136-2143.
34. Hakkert AS, Gitelman V, Ben-Shabat E: An evaluation of cross-walk warning systems: effects on pedestrian and vehicle behaviour. Transp Res F:Traffic Psychol Behav 2002, 5(4):275-292. 35. Vives MJ, Kishan S, Asghar J, Peng B, Reiter MF, Milo S, Livingston D:
Spinal injuries in pedestrians struck by motor vehicles. J Spi-nal Disord Tech 2008, 21(4):281-287.
36. Oxley J, Lenne M, Corben B: The effect of alcohol impairment on road-crossing behaviour. Transp Res F: Traffic Psychol Behav
2006, 9(4):258-268.
37. LaScala EA, Gerber D, Gruenewald PJ: Demographic and environ-mental correlates of pedestrian injury collisions: a spatial analysis. Accid Anal Prev 2000, 32(5):651-658.
38. Lenné MG, Corben BF, Stephan K: Traffic signal phasing at inter-sections to improve safety for alcohol-affected pedestrians.
Accid Anal Prev 2007, 39(4):751-756.
39. Corben B, Diamantopoulou K, Mullan N, Mainka B: Environmental Countermeasures for Alcohol-related Pedestrian Crashes.
Publish with BioMed Central and every scientist can read your work free of charge "BioMed Central will be the most significant development for disseminating the results of biomedical researc h in our lifetime."
Sir Paul Nurse, Cancer Research UK Your research papers will be:
available free of charge to the entire biomedical community peer reviewed and published immediately upon acceptance cited in PubMed and archived on PubMed Central yours — you keep the copyright
Submit your manuscript here:
http://www.biomedcentral.com/info/publishing_adv.asp
BioMedcentral
BMC Public Health 2009, 9:233 http://www.biomedcentral.com/1471-2458/9/233
Page 10 of 10 (page number not for citation purposes) 40. Newbury C, Hsiao K, Dansey R, Hamill J: Paediatric pedestrian
trauma: The danger after school. J Paediatr Child Health 2008,
44(9):488-491.
41. Jones SJ, Lyons RA, John A, Palmer SR: Traffic calming policy can reduce inequalities in child pedestrian injuries: database study. Inj Prev 2005, 11(3):152-156.
42. Randall TA, Churchill CJ, Baetz BW: Geographic information sys-tem (GIS) based decision support for neighbourhood traffic calming. Can J Civil Eng 2005, 32:86-98.
Pre-publication history
The pre-publication history for this paper can be accessed here:
http://www.biomedcentral.com/1471-2458/9/233/pre pub