Banking Deregulation and Financial Stability : is it Time to re-regulate in Canada ?
36
0
0
Full text
(2) BANKING DEREGULATION AND FINANCIAL STABILITY: IS IT TIME TO RE-REGULATE IN CANADA? Résumé La stabilité financière est un objectif important pour les banques centrales. Dans ce contexte, il était largement reconnu que la déréglementation, en permettant aux banques d’œuvrer dans de nouvelles activités (généralement classifiées comme des activités hors-bilan), donnerait lieu à des gains importants en termes de diversification. L’on croyait que l’amélioration conséquente de l’arbitrage rendement-risque promouvrait la stabilité financière. Mais selon des études effectuées par Calmès et Liu (2007) et Calmès et Théoret (2008), la stabilité financière pourrait avoir été compromise à la suite des amendements de la Loi sur les banques. Dans ce papier, nous documentons davantage la détérioration de l’arbitrage rendementrisque dans le système bancaire canadien au cours de la période 1988-2007. Le gonflement des activités hors-bilan s’est en effet traduit par une augmentation considérable de la volatilité des revenus nets d’opération, allant même jusqu’à entamer des mesures courantes de la rentabilité bancaire, telles que le rendement sur les actifs et le rendement sur l’équité. En liaison avec la déréglementation, nous formulons une conjecture dont l’objet est d’expliquer le risque accru dans le système financier canadien. Sur cette toile de fond, une question perce à jour : doit-on re-réglementer? À ce sujet, nous avalisons la prévision de Calmès (2003) : un processus de maturation s’est effectivement enclenché après 1997. Il en est résulté une meilleure intégration des activités bancaires traditionnelles et non-traditionnelles de même que l’ajout d’une prime de risque à l’intérieur des rendements comptables des banques. C’est pourquoi nous estimons qu’il n’y a pas lieu de reréglementer. Les marchés financiers et les institutions ont pris en charge le risque accru relié aux affaires bancaires. Toutefois, nos propos n’insinuent pas qu’il faille déréglementer plus avant. À la lumière de nos résultats, nous pouvons en effet questionner la pertinence de fusions bancaires au Canada. Nous sommes portés à recommander la prudence en cette matière puisque la part des revenus autres que d’intérêt (les revenus associés aux activités hors-bilan), qui est en partie responsable de la volatilité accrue des rendements bancaires, pourrait osciller d’ores et déjà dans le voisinage de son niveau optimal. Autoriser les fusions de banques déjà très impliquées dans les activités hors-bilan pourrait donc s’avérer dommageable en termes de stabilité systémique. Finalement, nous épiloguons sur l’efficacité de la politique monétaire canadienne dans l’actuel environnement «déréglementé».. 2.
(3) Abstract Financial stability is a very important objective for central bankers. In this respect, it was widely believed that deregulation, by allowing banks to engage in new activities (generally classified as off-balance sheet (OBS) activities) would give rise to important diversification benefits. It was assumed that the resulting improvement of the risk-return trade-off would foster financial stability. But according to Calmès and Liu (2007) and Calmès and Théoret (2008), financial stability might have been actually put at risk after the successive Bank Act amendments. In this study, we provide new evidence of a worsening of the risk-return trade-off in the Canadian banking system over the period 1988-2007. Surging OBS activities have led to increasingly volatile net operating revenues, and might have reduced well-known measures of bank profitability, like return on assets and return on equity. Related to deregulation, we conjecture to explain the rising risk in the Canadian financial system related to deregulation. In this context, a natural question arises: should we re-regulate? On this matter, we confirm Calmès (2003) prediction: a maturation process took place after 1997 leading to a better integration of traditional lending and non traditional activities and to the inclusion of a risk premium in accounting bank returns. In this sense, we thus suggest that there is no need to reregulate. Financial markets and institutions took care of the increased risk in the banking business. However, this does not mean that we should deregulate further. Indeed, based on our results, we can question the relevance of allowing banks mergers in Canada. We would advize prudence because the share of noninterest income ( the revenue associated to OBS activities) , responsible for the increased volatility of banks returns, might already be in the neighbourhood of its optimal level. To be sure, allowing the merger of two banks much involved in non traditional banking activities could be detrimental to systemic stability. Our final comments concern the efficacy of Canadian monetary policy in the current deregulated environment.. 3.
(4) Introduction Financial stability and diversification effects of banking deregulation Before the recent financial turmoil, it was widely believed that the banking deregulation process1, which began in the 1980s in Canada, would strengthen financial stability by giving rise to important diversification effects inside the banking industry (Rose 1989, Saunders and Walter 1994). The series of amendments to the Bank Act enabled banks to act as security dealers and to offer fiduciary services and portfolio advices to investors. Those new types of banking activities, previously the "chasse gardée" of the three other pillars of the Canadian financial system, are usually classified loosely as OBS (off-balance sheet) ones. These activities were assumed to provide a better risk-return trade-off. Their growth was also associated to a process called "financial deepening", an increase in the ratio of direct to indirect financing, taking place in Canada, as elsewhere. This process led to a more market-oriented financial industry (Calmès 2004a). Theoretically, this move towards more complete financial markets should have translated into greater financial stability (Arrow 1964). As we saw, with the current credit crisis, this did not happen.. Deregulation put at risk financial stability Indeed, the aforementioned expectation proved to be at odds with the facts. And, as a matter of fact, both in Canada and the United-States, researchers find that OBS activities triggered a substantial increase in the volatility of banks' net operating revenue growth (Stiroh 2004, Stiroh 2006a, Stiroh and Rumble 2006, Calmès and Liu 2007 and Calmès 1. For more about the financial deregulation process in Canada see Théoret (1999, chap. 3) and Calmès (2004a).. 4.
(5) and Théoret 2008). Furthermore, this volatility surge does not seem to be associated to greater absolute or risk-adjusted (accounting) measures of bank returns − e.g. the return on assets or the return on equity. Actually, these measures of banks returns might have decreased following the upward trend in the share of noninterest income. Given the direct link between accounting measures of bank performance and the level and volatility of bank market returns, this situation should be perceived as problematic by the Bank of Canada. The stylized facts reported in this paper suggest that the surge in OBS activities actually increases the Canadian banking system riskiness . To explain the paradoxical decreasing diversification in the banking system, we provide a conjecture rationalizing the deterioration of the risk-return trade-off over the 1988-2007 period (Calmès and Liu 2007, Calmès and Théoret 2008).. Our maturation process story As put forward in Calmès (2003), a maturation process relating to a better integration of traditional lending activities and OBS ones seems indeed at play. One contribution of this paper is to show that banks have begun to incorporate a risk premium to account for the increased risk related to their non traditional activities. We also show that over the period 1997-2007, there is no longer a negative correlation between banks returns and the share of non-interest income (the revenues associated to this new type of activities) in banks' net operating revenue as was previously the case (Pellerin 2008). These findings are basically a maturation process story. Financial markets and institutions adjusted to greater risk even if the adjustment was slow (Caballero and Engle 2003). Since banks. 5.
(6) have adapted, we thus conclude that there is no need to re-regulate now. Our final remarks will concern problems related to eventual banks mergers and the role of monetary policy in the aftermath of deregulation.. The stylized facts about banking riskiness Valuing OBS activities The new bank activities resulting from the banking deregulation process are mainly classified as OBS ones generating noninterest income. By opposition, interest income is the revenue associated to the traditional lending activity of banks. Noninterest income is a heterogeneous aggregate that includes different components: trading income, gains (losses) on instruments held for other than trading purposes, fiduciary income, service fees, insurance and other fees and commissions. Insert box I about here According to box I, which presents a valuation method for Canadian banks OBS activities, these activities have grown steadily since 1988 (cf fig. 1). Indeed, according to our computations, they only represent 39% of balance sheet assets in 1988, and at the end of 2007, they largely exceed balance sheet assets, with a proportion of 122%.. The share of noninterest income. 6.
(7) Figure 1 The growing share of noninterest income for the eight domestic banks, 19882007. 0.65 0.60 0.55 0.50 0.45 0.40 0.35 0.30 0.25 88. 90. 92. 94. 96. 98. 00. 02. 04. 06. Figure I shows the growing importance of the share of noninterest income in Canadian banks' net operating revenue. Its upward trend began in 1992 and lasted until the bursting of the market bubble at the opening of the second millennium. By 2000, noninterest income accounted for 57% of net operating revenue, up from only 25% in 1988. This ratio seems to have entered in a period of consolidation thereafter, our first evidence of a maturation process story. This ratio recovered somewhat after the high tech bubble burst culminating at 60% in the first quarter of 2006 before decreasing again with the recent credit crisis. Note also that the fluctuations of the share of noninterest income are much larger after 1997 than before. Indeed, this share became increasingly sensitive to the fluctuations of financial markets (Calmès 2004a, Calmès and Liu 2007). Figure 2 Noninterest income per 100$ of assets for the eight Canadian domestic banks, 1988-2007. 2.8 2.6 2.4 2.2 2 1.8 1.6 1.4 1.2. 99 I 00 I 01 II 02 III 03 I 04 I 05 I 06 I 07 I. I. I 97. 98. I. I 95. 96. I. I 93. 94. I. I 91. 92. I. I 90. 89. 88. I. 1. 7.
(8) As suggested by figure 2, the growing share of noninterest income in banks' net operating revenue has boosted the bank ratio of noninterest income per 100$ of balance sheet assets. Excluding the drop of this ratio during the 1998 financial crisis (Russian debt episode), this ratio doubled between 1988 and 2001. It decreased steeply during the financial markets collapse of the beginning of the second millennium and did not really recover thereafter. There is thus also evidence of a maturation process here. Again, and similarly to the share of noninterest income, this ratio is also increasingly dependent on financial markets fluctuations.. Figure 3 Share of noninterest income in net operating revenue, three Canadian domestic banks, 1988 - 2007 0.80 0.70 RBC. 0.60. TD 0.50. NBC TOT. 0.40 0.30 0.20 88. 90. 92. 94. 96. 98. 00. 02. 04. 06. The post 1997 increasing volatility of the noninterest income share is much more striking if we consider individual banks instead of the pool of the eight Canadian domestic banks. Figure 3 provides a comparison of the noninterest shares for three wellknown Canadian banks differing by size: a relatively small-sized bank, the National Bank of Canada (NBC); a medium-sized bank, the Toronto-Dominion Bank (TD), and a largesized bank, the Royal Bank of Canada (RBC). Contrary to the RBC share, which is much more representative of the pool, the NBC and especially the TD share have become very. 8.
(9) volatile since the financial crisis of 1997. While the NBC share has remained on a volatile upward trend before collapsing on the fourth quarter of 2007, the TD share has decreased substantially since 2000. The dispersion between banks shares has also greatly increased since 1997, perhaps an additional indication of improved diversification in the Canadian banking industry since that year.. The increasing volatility of banks' net operating revenue growth Activities related to noninterest income are much more volatile than those associated to net interest income (Stiroh 2004, Calmès and Liu 2007). Their direct impact is the increase in the volatility of banks' net operating revenue growth. There is actually a diversification effect due to the fact that the correlation between interest and noninterest income is less than one, but this indirect effect is quite low in comparison to the direct one (Calmès and Liu 2007). Moreover, the correlation between these two forms of income is quite unstable. Hence, the direct contribution of noninterest income to the volatility of net operating revenue growth largely dominates. By increasing the operating leverage, this effect magnifies the volatility of profits growth (De Young and Roland 2001). Insert box II about here Table 1 Decomposition of the variance of net operating revenue growth, before provisions, Canadian banks, 1988-2007. 1988-1992 Average share. Variance. 1993-1997 Contribution to. Average share. Variance. variance Net operating revenue. Contribution to variance. 14.2. 9.4. Net interest income. 0.70. 16.9. 8.4. 0.64. 9.8. 4.0. Noninterest income. 0.30. 30.2. 2.6. 0.36. 40.4. 5.3. Covariance. 7.5. 3.1. -0.9. -0.4. Correlation. 0.33. -0.04. 9.
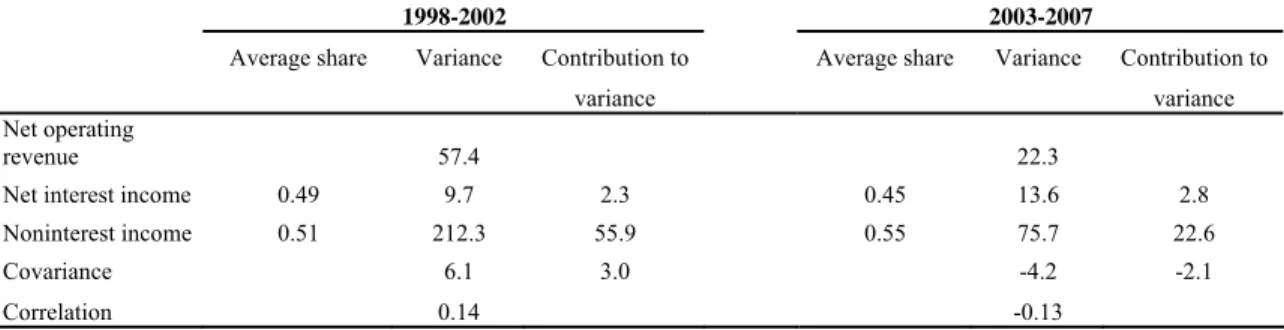
(10) 1998-2002 Average share. Variance. 2003-2007 Contribution to. Average share. Variance. variance Net operating revenue. Contribution to variance. 57.4. 22.3. Net interest income. 0.49. 9.7. 2.3. 0.45. 13.6. 2.8. Noninterest income. 0.51. 0.55. 75.7. 22.6. -4.2. -2.1. 212.3. 55.9. Covariance. 6.1. 3.0. Correlation. 0.14. -0.13. Table 1 reports the variance decomposition of net operating revenue growth over subperiods ranging from 1988 to 2007. The computations are detailed in box II. Time intervals correspond to different legislative periods. In the sub-periods 1988-1992 and 1993-1997, noninterest income seems to help reduce net operating revenue variance below what it would have been if banks relied solely on interest income. For example, in the 1988-1992 episode, net operating revenue variance was 14.2, lower than the 16.9 variance of net interest income. It can even be argued that from 1993 to 1997, there were clearly diversification benefits, net interest income volatility being higher than that of net operating revenue, and the correlation between the two components of net operating revenue being slightly negative. However, the two following sub-periods are quite different. During both sub-periods, the variance of net operating revenue growth is much higher than the variance of net interest income growth, which means that noninterest income growth increased substantially the volatility of net operating revenue growth. The variance of net operating revenue growth also jumped compared to the previous subperiods. The subperiod 19982002, which was plagued by excessive financial market fluctuations, is particularly symptomatic. The variance of noninterest income growth jumped to 212.3, while it was not higher than 40 before. During this subperiod, income from trading and investment. 10.
(11) activities was one of the major contributors to noninterest income volatility both in Canada (Calmès and Liu 2007) and in the United- States (Stiroh 2004a). This subperiod, associated to a financial turmoil, seems to have helped consolidate traditional lending activities and OBS ones. Indeed, during the sub-period 2003-2007, the volatility of net operating revenue growth receded, but it remained much higher than before the 1998-2002 financial crisis. In fact, the volatility of noninterest income growth has approximately doubled with respect to its level before the 1998-2002 subperiod. However, note that during this subperiod, the correlation between net interest and noninterest income growth became clearly negative, a rather new trend which contributes to dampen the direct pervasive impact of noninterest income on the volatility of net operating revenue growth. We might consider these recent developments as the concretization of a maturation process. In other words, this observation is consistent with the idea that non traditional activities are now better understood and managed − a standard “learning by doing” took place. Note however that the volatility of noninterest income growth is increasingly related to the one of income from trading and investment activities, the highest among the components of noninterest income, a delicate situation from the standpoint of the risk-return trade-off. To conclude, the Canadian banking system became definitively riskier following the successive deregulation waves, and this might be a bad news from the standpoint of financial stability. But thanks to the financial market turmoil we recently went through, adjustments to deregulation are now on the way. We will test these hypotheses later.. 11.
(12) A conjecture about the deceiving diversification gains and its concomitant increased riskiness Before studying our conjecture about a maturation process taking place in the Canadian financial system, we need from the outset to further characterize the increased riskiness of the banking business. First, OBS activities generate a specific systemic risk, which, by nature, is non-diversifiable. Thus Canadian banks have become more sensitive to aggregate shocks. Second, there is evidence that aggregate shocks have gained momentum relative to indiosyncratic ones2. Relatedly, data suggest that the situation worsens even more when we shift the focus from individual banks to the whole set of Canadian banks. More precisely, there seems to be some evidence of a herding behaviour whereby banks tend to behave alike when faced by aggregate shocks. This constitutes another source of systemic risk. Our working hypothesis is that net interest income, being related to physical stocks, (e.g. loans and other assets) would mainly respond to idiosyncratic shocks, like borrower default, whereas noninterest income, being related to flows, (e.g. service fees and trading revenues) would respond to aggregate shocks, like unexpected changes in stock market indices and macroeconomic aggregates (Calmès 2003). Since the former shocks are diversifiable while the latter are not, this conjecture complements the idea that the changing structure of bank revenues is associated with increasingly volatile banks' net operating revenues growth, as already suggested in Calmès (2004a) and Calmès and Liu (2007). With a greater involvement in OBS activities, Canadian banks are more sensitive to aggregate shocks.. 2. We are currently running experiments related to this issue.. 12.
(13) To parallel this idea, based on the U.S. experience, Houston and Stiroh (2006) find that aggregate risk has increased since 1990 relative to idiosyncratic risk. We still have to confirm this more formally for the Canada, but if this is also the case here, there would be an additional force driving banking risk and compounding the effect of higher banks sensitivity to risk3. Indeed, we can represent the banks exposure to aggregate shocks by the simple following product: Exposure to aggregate risk = sensitivity to aggregate shocks (OBS activities) x level of aggregate risk. where the level of aggregate risk is itself the product of aggregate risk frequency and intensity. While the two factors on the RHS of this equation rise, they are unfavourable to financial stability. The picture gets even clearer when shifting the focus from individual banks to the whole Canadian banking network. Being more exposed to aggregate shocks, banks are also likely to have more often similar reactions to economic events, a trend which could obviously increase banking riskiness further. Indeed this bank herding behaviour, i.e. the tendency for banks to move together in periods of economic uncertainty, documented both in the United-States (Baum et al. 2002) and in Canada (Calmès and Salazar 2006), should contribute to the greater exposure of banks to aggregate shocks. About these studies investigating the issue of the link between macroeconomic uncertainty and bank herding, Quagliariello (2006) notes that Canadian intermediaries display this behaviour when they deal with more pronounced aggregate uncertainty. Quagliariello (2006) observes a similar herding behaviour for the Italian banks. His contribution is to distinguish aggregate uncertainty from the idiosyncratic one. In the case of Italian banks, he reports that the herding behaviour is at play when macroeconomic or aggregate 3. We are currently conducting research on that topic.. 13.
(14) uncertainty increases. Consistent with Baum et al. (2002) and Calmès and Salazar (2006), he confirms that when idiosyncratic risk rises, banks behave heterogeneously. According to the author, this observation is related to the competitive advantage of better informed banks behaving in a different way compared to poorly informed intermediaries. Hence, if aggregate shocks are increasingly important to Canadian banks (in relation to the increasing share of their OBS activities), bank herding could become a structural and not just a cyclical phenomenon, as previously thought, and this would then translate into an increased correlation between banks accounting and equity returns. This is also a bad news for the investors in search of portfolio diversification since herding is at the antipodes of diversification, and it threatens the stability of the banking system. Considering the results and discussion reported so far, a natural question emerges: is this increased banking riskiness a concern?4 This is the question we want to address in the rest of the paper. As mentioned earlier, the answer might be no and reregulate a mistake. Relatedly, we also provide a digression about banks mergers and monetary policy in this new financial context.. 4. Note also that we should not underestimate the innovative capacity of a central bank confronted to financial instability. During the American subprime mortgage market crisis which began in 2007, the Federal Reserve Board developed new instruments and techniques to lessen the liquidity crisis resulting from the collapse of the subprime market. It even downgraded the collateral requirements needed against loans, allowing mortgage back securities as collateral. For Cecchetti (2008), who relates the reaction of the Fed to the financial crisis of 20072008, such central bank loans are a form of subsidy provided to distressed institutions. As noted later, such a move may lead to a decrease in the volatility of the gross domestic product (Jermann and Quadrini 2006).. 14.
(15) Our maturation process story Two hypotheses about the maturation process It is well-known that markets usually undertake the necessary adjustments when confronted with increased risk. The main interest we have in this paper is to examine the two following hypotheses: Hypothesis 1: There is a maturation process taking place in the Canadian banking sector, as expected by Calmès (2003). According to this hypothesis, in the long run, the share of noninterest income in banks' net operating revenue would no longer impact negatively on banks accounting performance measures. We date the break-even point around 1997.. Hypothesis 2 : In light of the increased riskiness of their operations, Canadian banks have adjusted to this situation by incorporating a risk premium in the return of their OBS activities. This premium, pricing the risk associated to OBS activities, came with some delay, and emerged around the year 1997.. Note that De Young and Roland (2001) conjectured that the surging volatility of banks revenues should give rise to the incorporation of risk premia in various measures of bank accounting returns. However, they did not test this conjecture. Our research contribution here is precisely to start dealing with this task.. 15.
(16) Insert box III about here. The results over the whole sample period 1988-2007 Box III provides the model used to test our hypotheses, while Box IV reports the results for the whole sample period without a risk premium. Experiments run from the first fiscal quarter of 1988 to the fourth fiscal quarter of 2007. We model the evolution of two measures of bank performance, the return on assets (ROA) and the return on equity (ROE), in terms of the share of noninterest income and other explanatory variables. The fit of the model is quite good over the whole period. We note that the risk-return trade-off worsened throughout this period. As expected, we confirm that the share of noninterest income has an important negative impact on both measures of performance retained for the analysis, either expressed on an absolute or risk-adjusted basis. Insert box IV about here In box V, we add a risk premium to the model. The fit of the equations explaining ROA and ROE improves considerably. This suggests that banks have reacted to the increasing volatility of their net operating revenue growth by implicitly adding a risk premium to the return of their OBS activities, a quite rational, and reassuring, behaviour. Consistent with our second hypothesis, this risk premium has been added with a delay. Insert box V about here. The results over subsamples 1988-1996 and 1997-2007 In box VI, we estimate again equation (2) (box III) over two sub-samples (1988-1996 and 1997-2007) in order to assess the robustness of our two hypotheses. We note that the. 16.
(17) performance of our model is excellent over the first subsample but weaker over the second. The deterioration of the fit of our equation might be attributed to the rise in the absolute level of idiosyncratic risk over the second period, which we reported earlier. Insert box VI about here Overall, hypothesis 1 seems to be supported by the data. The share of noninterest income no longer impacts negatively ROE and ROA (i.e. over the period 1997-2007), as it is the case before ( the period 1988-1996) while the share had a strong negative effect on the measures of bank performance. There seems to be a structural break after 1997 both with ROE and ROA. We relate this change to a maturation process which would have led to a better integration of the traditional bank lending activities with OBS ones. In other words, adjustment to the worsening risk-return trade-off was slow to come, as expected by Calmès (2003), but it finally emerged in the second part of our sample. Our second hypothesis seems also supported by the evidence. In box VI, we note that the risk premium is not significant over the period 1988-1996 for both ROE and ROA but significant over the period 1997-2007, a result in line with our maturation process story. In light of this evidence, we are thus encouraged to think that Canadian banks made (with delay) the required adjustments to the increased volatility of their operations.. Should we re-regulate? Considering this conjecture about a maturation process having taken place, should we re-regulate? Our empirical work suggests we should not. The mess may be behind us. We argue that a maturation process is in gestation in the banking sector, that the risk associated to the new line of business has been priced through a specific risk premium,. 17.
(18) and a better integration of traditional lending and OBS activities. Theoretically, as noted previously, adjustments to deregulation may take a long time (Calmès 2003, Caballero and Engel 2003) but they are now on the way, thanks in part to the financial turmoil we recently went through. The estimations performed in this paper and ongoing empirical work on the subject (Calmès and Théoret 2008, Pellerin 2008) seem to suggest that the trade-off between return and risk has improved since 1997. Although greater risk might prevail in the Canadian financial system, it should not be dealt with re-regulation. We must let the necessary adjustments unfold, with the greater completeness of the Canadian financial markets enabled by the deregulation process giving way to more risk sharing. In other respects, Canadian banks must have greater leeway in order to face international market competition: re-regulation would produce the opposite effect. As the Canadian financial system moves progressively towards perfect competition, profits related to bank lending become less attractive. While at first the increased risk was not associated with greater returns, we detect signals that banking is back to its optimal production frontier. For these reasons, we suspect that re-regulating now would be detrimental to bank profits. Deregulation allows banks to engage in other activities whose profitability was justifiedly questionable initially, but no more, as the maturation process eventually normalizes the situation and enables banks to prosper in a globalized, integrating financial system.. 18.
(19) Related questions to be addressed The question of banks mergers in Canada The next step of the deregulation process in Canada might be about banks mergers. Houston and Stiroh (2006) argue that there is a positive correlation between bank size and the share of noninterest income in banks' net operating revenue. In that respect and in light of our previous developments, there are two contradictory arguments related to the issue of banks mergers in Canada. On the one hand, by increasing the share of noninterest income in banks operations, mergers would add more risk in the banking industry. That might lead to a further deterioration of the risk-return trade-off facing banks. On the other hand, as suggested in our research, banks might take the necessary steps to incorporate this risk into their operations (e.g by pricing it soundly and better integrating traditional lending and additional OBS activities). This last argument is favourable to banks mergers while the former is not. In our opinion, the first argument must be given the greatest weight. Prudence is required before allowing mergers. According to Stiroh and Rumble (2006), following mergers, the weight of OBS activities in banks operations could increase without any additional diversification benefits – at best. A resulting jump in revenue volatility might unfold. And even if the necessary adjustments take place to account for the additional risk, there could be a limit to those adjustments. It is also appropriate to bear in mind our conjecture we presented earlier5 for studying the diversification effects related to banks mergers. According to this conjecture, banks have become increasingly exposed to aggregate shocks as their share of noninterest income increased, with the consequences. 5. On that matter see also Calmès (2003), and Calmès and Théoret (2008).. 19.
(20) mentioned earlier. This situation is all the more worrying since aggregate shocks seem to grow in importance relatively to the idiosyncratic ones in the banking industry (Houston and Stiroh 2006). Moreover, there is possibly an optimal share of noninterest income in banks’ net operating revenues. Exceeding this share could be detrimental from the standpoint of banks profits. Further investigation must be done on that matter. The decision to allow bank mergers should take such an optimal level into consideration, if it actually exists. In summary, it is appropriate to do more studies on the diversification effects of mergers before permitting them in Canada.. Canadian monetary policy in the new financial era A new era Counter-intuitively and contrary to a view held at the Bank of Canada (Dodge 2001, Freedman 2003), financial “instability” (i.e. increased banking riskiness) we document in this paper did not entail real sector instability. Instead, in parallel to the financial developments we discussed above, a movement called "the Great Moderation" began in 1984 in the United-States and, according to Stock and Watson (2003), in the early 1990s in Canada. In recent years and in many industrialized countries, we observed a substantial decrease in the volatility of several macroeconomic aggregates, like gross domestic product6. As noted before, financial deepening has important consequences for the conduct of monetary policy in Canada (Calmès 2004a). Instead of contracting bank loans, firms. 6. For more details on that subject see Stock and Watson (2002), Ozenbas and al. (2006), Stiroh (2006b), and Gali and Gambetti (2008), among many others.. 20.
(21) resort increasingly to financial markets to fund their operations. Referring to Calmès article (2004a), Luengnaruemitchai and Ong (2005), Serletis and Pinnoi (2006), Zhou (2006), and Chang (2007) note the synchronism between financial deepening and the banking deregulatory process in Canada. There is actually a clear link between these two developments. Banks would have fostered the deregulation process in order to engage in new activities (loosely called OBS activities), the margin on their traditional lending activities trending downward. That the spikes of the share of noninterest income correspond to the Bank Act amendments dates is thus not mere coincidence. In summary, the financial system is becoming progressively more market-oriented in Canada, as elsewhere. Securitization, a technique used increasingly by banks to fund their loans, amplifies this financial deepening movement (Altunbas et al. 2007).. An alternative credit channel for the Bank of Canada Following deregulation and its associated financial deepening, the traditional lending channel might have lost its steam. A related question which must be examined is about the existence of an alternative credit channel on which the Bank of Canada could rely following deregulation or whether monetary policy lost its efficacy. A relatively new literature based on self-enforcing contracts and RBC models provides a propagation mechanism of monetary policy shocks operating through firms’ balance sheets (and not just the traditional financing components). For Roldos (2006), the financial markets stability brought by financial innovations and the endogeneization of financial constraints, like the terms of the borrowing contracts (e.g. the nature of collateral. 21.
(22) required in borrowing contracts), motivates a modification in the financial accelerator theory to account for the broader credit channel7. Referring to Calmès (2004a), Roldos (2006) notes that the structural breaks in the Canadian monetary policy transmission mechanism correspond to the dates of the Bank Act amendments. Following these breaks, Canadian aggregate demand became more sensitive to the interest rate8, which suggests that the financial accelerator mechanism gained strength with the financial deepening process, as predicted by the theory. Other studies concluding just the opposite, i.e. that monetary policy lost its steam because of the increase in direct financing, this question deserves further investigation.. Macroeconomic shocks, the Great Moderation and the efficacy of monetary policy There is now some evidence that Canadian monetary policy contributed, as in the United-States, to the Great Moderation (Jermann and Quadrini 2006, Gali and Gambetti 2008). However, there is still really no coherent theory accounting for this contribution. Jermann and Quadrini (2006) explain the decrease of the GDP volatility by two financial developments: the better ability for firms to get credit and a greater flexibility in equity financing. In their model, an increase in these two parameters gives way to a decrease in the volatility of output. According to Jermann and Quadrini (2006), the lower volatility of macroeconomic aggregates importantly depends on the increasing flexibility in equity financing.. 7. His modified financial accelerator model works as follows. A change in interest rate leads to a change in firm cash-flows, cost of capital (or Tobin's q) and assets value, fostering an adjustment of aggregate demand. The working of Roldos model is in line with the overinvestment theory, described in Calmès 2001, Calmès 2004b and Calmès 2005. 8 That is the interest rate sensitivity of aggregate demand depends on the ratio of direct to indirect finance.. 22.
(23) In other respects, in theories about the link between monetary policy and the Great Moderation, the role of macroeconomic shocks is still unclear. There are at least three aspects to consider: i) Does a credible and transparent monetary policy, as an inflation targeting rule, gives way to a reduction of non-technological shocks, like demand shocks? If so, that will contribute to reduce the volatility of output. In line with this argument, it is possible that past monetary policy triggered demand shocks (Gali and Gambetti 2008). ii) Thanks to more complete financial markets, did aggregate demand become less sensitive to macroeconomic shocks? iii) What is the relative contribution of aggregate and idiosyncratic shocks in the propagation of monetary policy shocks? According to Houston and Stiroh (2006), the importance of aggregate shocks has increased in the financial sector since the end of the 1980s, while the opposite is observed in the real sector. How to explain these developments and what is the role played by monetary policy? The answers to these questions, obviously very important for the comprehension of the monetary policy propagation mechanism, are additional avenues of future research.. Conclusion Following deregulation, risk has increased in the Canadian banking sector. But banks have made several adjustments, as incorporating risk premia in their returns and better integrating new OBS activities with traditional lending.. 23.
(24) We thus conclude that there is no need to re-regulate. Financial markets and institutions can adapt to new situations. There is also evidence that the move toward OBS activities is endogenous to the Canadian banking industry, in the sense that it was originated by banks themselves9. Under that scenario, banks initiated and even fostered the financial deregulation process, by shifting their activities toward, a priori, more profitable ones, like underwriting and securitization. Indeed, the branches network of Canadian banks was becoming less profitable. During the transition, banks have encouraged their customers to be more market-oriented, substituting securities issues for loans. Based on this plausible scenario and on the endogeneity of the deregulation process, re-regulation would not be a good idea. There is also evidence that banks engaged in new activities before having received the authorization to do so10. The legislators only sanctioned such moves, an example of banks and government intermingling interests. Nevertheless, regulators must be prudent before giving additional powers to banks. As noted previously, there is possibly an optimal level in the share of noninterest income in banks' net operating revenues. Since this ratio is already quite high for Canadian banks, it might already be in the neighbourhood of its upper range. Allowing more flexibility for banks might be detrimental to the stability of the Canadian banking system. In that respect, caution is in order before opening the doors to banks mergers, a move which could accelerate the rise in OBS activities.. 9. We are currently checking this hypothesis. This was the case for two Canadian banks engaged in brokerage activities before the 1987 Bank Act amendment. Banks capitalized on Bank Act loopholes at the time.. 10. 24.
(25) References Altunbas, Y., Gambacorta, L., and Marques, D. (2007) “Securitization and the bank lending channel.” Working Paper no. 653, Banca d'Italia. Arrow, K. (1964) “The role of securities in the optimal allocation of risk-bearing.” Review of Economic Studies, 31, 91-96. Baum, C.F., Caglayan, M., and Ozhan, N. (2002) “The Impact of Macroeconomic Uncertainty on Bank Lending Behaviour. ” Working Paper, University of Liverpool. Baum, C.F., Caglayan, M., and Ozhan, N. (2005) “The second moments matter: The response of bank lending behaviour to macroeconomic uncertainty.” Working Paper no. 521, Boston College. Boyd, J.H., and Gertler, M. (1994) “Are Banks Dead? Or are the reports greatly exaggerated?.” Federal Reserve Bank of Minneapolis Quarterly Review, 18(3), 1-27. Caballero, R.J., and Engle, E. (2003) “Adjustment is much slower than you think.” Working Paper no. 9898, National Bureau of Economic Research. Calmès, C. (2001) “Financial Market Imperfections, Cash Flow and Investment: a Short Survey.” Bank of Canada. Calmès, C. (2003) “Revenue Shift and Performance of U.S. Bank Holding Companies, a Discussion.” The Evolving Financial System and Public Policy. Bank of Canada Conference organized by Christian Calmès, 12-05-2003. Calmès, C. (2004a) “Regulatory changes and financial structure: the case of Canada.” Swiss Journal of Economics and Statistics, 140(1), 1-35. Calmès, C. (2004b) “Financial Market Imperfection, Overinvestment and Speculative Precaution.”, Working Paper 2004-27, Bank of Canada. Calmès, C. (2005) “Financial Market Imperfection and Precautionary Overinvestment.” Journal of Financial Transformation , 14 (August), 1-30. Calmès, C., and Liu, Y. (2007) “Financial structure change and banking income: a Canada – U.S. comparison.” Journal of International Financial Markets, Institutions and Money, in press. Calmès, C., and Salazar J. (2006) “Variance macroéconomique conditionnelle et mesure de dispersion des actifs dans les portefeuilles bancaires.” In: Racicot, F.E., and Théoret, R., Finance computationnelle et gestion des risques. Presses de l'Université du Québec: SteFoy. Calmès, C., and Théoret, R. (2008) “Surging OBS activities and banks revenue volatility: Or how to explain the declining appeal of bank stocks in Canada.” In: Stock Market Volatility. Chapman & Hall/CRC Finance Series, forthcoming. Cecchetti, S.G. (2008), “Crisis and responses: the Federal Reserve and the financial crisis of 2007-2008.” Working Paper no. 14134, National Bureau of Economic Research. Chang, J.C. (2007) “Investigating the credit supply-versus-demand puzzle in a small open economy.” Working Paper, National Chi Nan University. DeYoung, R., and Roland, K.P. (2001) “Product mix and earnings volatility at commercial banks: evidence from a degree of total leverage model.” Journal of Financial Intermediation, 10(1), 54-84. Dodge, D. (2001) “The Bank of Canada and Financial Stability.” Speech at the Montreal Society of Financial Analysts, Montreal.. 25.
(26) Engle, R.F., Lilien, D.M., and Robins, R.P. (1986) “Estimating Time-Varying Risk Premia in the Term Structure: the ARCH-M Model.” Econometrica, 55(2), 391-407. Freedman, C. (2003) “Reflections on three decades at the Bank of Canada.” Bank of Canada. Gali, J., and Gambetti, L. (2008) “On the Sources of the Great Moderation.” Working Paper, National Bureau of Economic Research. Houston, J.F., and Stiroh, K.J. (2006) “Three decades of financial sector risk.” Staff report no. 248, Federal Reserve Bank of New York. Jermann, U., and Quadrini, V. (2006) “Financial innovations and Macroeconomic Volatility.” Working Paper, Wharton School and University of Southern California. Luengnaruemitchai, P., and Ong, L.L. (2005) “An anatomy of corporate bond markets: growing pains and knowledge gains. ” IMF Working Paper. Ozenbas, D., and San Vincente Portes, L. (2006) “On balance sheets, idiosyncratic risk and aggregate volatility: Is firm volatility good for the economy?.” Working Paper, Montclair State University. Pellerin, N. (2008) “L'effet des activités hors-bilan sur la rentabilité et la volatilité des revenus des banques canadiennes.” mémoire, DESS finance, Université du Québec en Outaouais (UQO). Quagliariello, M. (2006) “Macroeconomic uncertainty and banks' lending decisions: the case of Italy. ” Working Paper no. 2006/02, University of York. Roldos, J. (2006) “Disintermediation and Monetary Transmission in Canada.” Working Paper, International Monetary Fund. Rose, P.S. (1989) “Diversification of the Banking Firm.” The Financial Review, 24(2), 251280. Saunders, A., and Walter, I. (1994) Universal banking in the United-States: What could we gain? What could we lose?. Oxford University Press: New York. Serletis, A., and Pinnoi, R. (2006) “Corporate Financing in Canada.” Working Paper, University of Calgary. Stiroh, K.J. (2004) “Diversification in banking: is noninterest income the answer?.” Journal of Money, Credit and Banking, 36(5), 853-882. Stiroh, K.J. (2006a) “A portfolio view of banking with interest and noninterest activities.” Journal of Money, Credit and Banking, 38(5), 1351-1361. Stiroh, K.J. (2006b) “Volatility accounting: a production perspective on increased economic stability.” Staff Report no. 245, Federal Reserve Bank of New York. Stiroh, K.J. and Rumble, A. (2006) “The dark side of diversification: the case of US financial holding companies.” Journal of Banking & Finance, 30(8), 2131- 2161. Stock, J., and Watson, M.W. (2002) “Has the business cycle changed and why?.” NBER Macroeconomics Annual 2002, MIT Press. Stock, J., and Watson, M.W. (2003) “Has the Business Cycle Changed: Evidence and Explanation.” Working Paper, Federal Reserve Bank of Kansas City Symposium. Théoret, R. (1991) “Un modèle économétrique des marges bénéficiaires des caisses populaires Desjardins du Québec et des banques à charte canadiennes.” L'Actualité économique, Revue d'analyse économique, 67(1), 58-79. Théoret, R. (1999) Traité de gestion bancaire. Presses de l'Université du Québec: Ste-Foy. Zhou, J. (2006) “Why did private business equity fall in Canada?.” Working Paper, University of Western Ontario.. 26.
(27) Boxes Box I Valuing banks OBS activities The valuation of OBS activities presents many measurement problems (Calmès 2004a) but we can tackle them by resorting to the method suggested by Boyd and Gertler (1994) who proposed to compute an asset-equivalent measure of OBS activities. Let rBS be the mean return on balance sheet activities, ABS be the value of balance sheet assets, and NBS the net revenue associated to balance sheet activities. We have: rBS ABS = N BS so ABS =. N BS rBS. The balance sheet assets are thus the capitalization, at the rBS rate, of the net revenue generated by these assets. Similarly, we can write AOBS =. N OBS rOBS. where AOBS is the asset-equivalent of OBS activities, NOBS is the net revenue associated to OBS activities and rOBS is the mean return on OBS activities. Assume that rBS = rOBS. that is the capitalization rate of balance sheet assets is the same as the one of OBS assets. We can thus write. AOBS =. N OBS N NOR ABS = OBS ABS N BS N BS NOR. where NOR stands for net operating revenue. We measure respectively the ratio (NOBS /. NOR) by the share of noninterest income and the ratio (NBS / NOR) by the share of net. 27.
(28) …Box I continued… interest income in net operating revenue. We thus arrive at the following measure of OBS activities, for the eight Canadian domestic banks and for the fourth quarter of 2007 AOBS =. snonin 0.55 × ABS = 2283 = 2790 sni 0.45. where snonin represents the share of noninterest income, and sni the share of net interest income. According to the asset equivalent computation, the assets related to Canadian banks OBS activities are equal to 2790 billion $, an amount 122% larger than the level of balance sheet assets. By comparison, they only represented 39% of balance sheet assets in 1988. Similarly to the American banks, Canadian banks activities are increasingly dominated by OBS activities.. Box II Decomposing the variance of banks' net operating revenue growth Following Stiroh (2004a) and Calmès and Liu (2007), we decompose the net operating revenue growth with a portfolio approach in order to analyze its volatility with two components: volatility of net interest income growth and volatility of noninterest income growth. The growth of net operating revenue (NOR) is computed as: ⎛ NORt ⎞ ⎟⎟ = ln (NORt ) − ln (NORt −1 ) d ln( NOR ) = ln⎜⎜ ⎝ NORt −1 ⎠. Its variance may thus be decomposed as follows:. σ d2 ln( NOR ) = w2σ d2 ln( NONIN ) + (1 − w)2 σ d2 ln( NI ) + 2w(1 − w) cov(d ln( NONIN ), d ln( NI ) ) where NONIN stands for noninterest income, NI, for net interest income, and where w=. NONIN the share of noninterest income in banks net operating revenue. The NONIN + NI. direct contribution of noninterest income to σ d2 ln( NOR ) is given by w 2σ d2 ln( NONIN ) , while the 28.
(29) contribution of net interest income to σ d2 ln( NOR ) is equal to (1 − w) σ d2 ln( NI ) . Since 2. noninterest income is usually more volatile than net interest income, the growing importance of noninterest income in bank net operating revenue directly increases σ d2 ln( NOR ) . But as long as the correlation between the growth rates of noninterest income. and net interest income is not equal to 1, the trade-off between net operating revenue growth and volatility can improve.. Box III The model linking noninterest share to accounting measures of bank profitability We test the impact of the growing share of noninterest income on bank performance by resorting to an empirical model used by Stiroh (2004) in the United-States and by Calmès and Liu (2007) and Calmès and Théoret (2008) in Canada. The general form of this model is11 yt = β 0 + β1 yt −1 + β 2 snonint + β 3 X t + ε t. (1). where yt is an accounting measure of bank performance – i.e ROE and ROA –, snonint is the share of noninterest income in net operating revenue, Xt is a vector of control variables and εt is the innovation or error term. For example, Xt may control for any factor that may impact on bank performance (e.g. bank size, riskiness of loans or asset growth). Following Stiroh (2004a) and Calmès and Liu (2007), equation (1) was also estimated on a risk-adjusted basis. In this equation form, yt is divided by a fourth-quarter moving average of the standard deviation of yt. To scale down yt, we also resorted to a measure of risk used by Calmès and Théoret (2008), deflating yt by its conditional volatility as measured by a GARCH(1,1) model. We tested for other well-known econometric 11. For an alternative model of bank performance see Théoret (1991).. 29.
(30) specifications of conditional volatility, like GARCH(p,q), TARCH, EGARCH and PARCH, using also different distributions for the error term (normal, Student and generalized error (GED)), but the standard GARCH(1,1) specification was the best measure of conditional volatility according to traditional measures of econometric model evaluation, such as the Akaike and Schwarz criterions. It is possible that the increasing volatility of banks operating revenues might have given rise to the introduction of a risk premium in equation (1). Actually, traditional finance establishes a risk-return trade-off such that rt = θ1 + θ 2 riskt + μt. where rt stands for return, riskt is a risk measure, and μt the innovation. Following Calmès and Théoret (2008), risk is introduced in equation (1) by resorting to an ARCH-M model12, that is: yt = β 0 + β1 yt −1 + β 2 snonint + β 3 X t + β 4σ c ,t + ε t. (2). where σc,t, the conditional volatility, is computed using the following equation. σ c2,t = θ 0 + θ1σ c2,t −1 + θ 2ε t2−1 The ARCH-M procedure is very appealing to estimate the risk premium because it directly incorporates the conditional volatility, chosen as a measure of risk, in the return equation instead of running a regression on returns defined on a risk-adjusted basis, i.e. a measure of return scaled down by an "ad hoc" measure of its volatility.. 12. The ARCH-M model is due to Engle et al. (1986).. 30.
(31) Box IV The results over the whole sample without a risk premium Table 2 reports the estimation of equations (1) and (2) for the pool of the eight major Canadian domestic banks for the period running from the first fiscal quarter of 1988 to the fourth fiscal quarter of 2007 which corresponds to the whole sample period. Data come from the Canadian Bankers Association and the Office of the Superintendent of Financial Institutions (Canada). Unit root tests suggest that all statistical series are stationary, so they are modelled in levels. Following Calmès and Liu (2007), we retain only the ratio of loan loss provisions to total assets as control variable because the other ones were found not significant. Estimation of equation (1) for the ratios ROE and ROA gives very satisfying results in terms of adjusted R2 which is equal to 0.72 for both ratios. Before adjustment for risk, estimation of equation (1) reveals that the coefficient of the share of noninterest income is significantly negative for the two performance ratios. That suggests that OBS activities have reduced the performance of Canadian banks over the whole sample period, while they also increased the volatility of bank net operating revenue growth.. 31.
(32) …Box IV continued…. Table 2 Profitability of the eight Canadian domestic banks vs noninterest income share, 1988Q1 – 2007Q4 ROE(1). ROE(2). ROE/σuc,t. ROE/σc,t. ROA(1). ROA(2). ROA/σuc,t. ROA/σc,t. C. 0.24***. 0.25***. 12.58**. 2.94***. 1.02***. 0.21***. 23.71***. 5.16***. yt-1. 0.15**. -0.01. 0.75***. 0.60***. 0.11*. 0.01. -4.72**. 0.11. snonin. -0.11**. -0.20***. -16.43**. -1.72. -0.39**. -0.72***. -22.32*. -2.20**. LLP. -2.49***. -0.14***. -0.15***. -7.97***. -1.99***. 0.55***. -0.59***. -9.31**. DUM2Q. -0.02. -0.01. 1.24. -0.60*. -0.06. -0.03. 2.37. -0.37. DUM3Q. -0.02. -0.01. -0.51. -0.20. -0.05. -0.05. 3.32. -0.28. DUM4Q. -0.03**. -0.02*. 0.32. -0.65**. -0.11**. -0.09**. 2.57. -0.55. -. 1.85**. -. -. -. 9.78***. -. -. 0.72. 0.80. 0.67. 0.68. 0.72. 0.83. 0.15. 0.70. σc,t Adjusted R. 2. Note: Explanatory variables: yt-1, lagged dependent variable; snonin, share of noninterest income in net operating revenue; LLP, ratio of loan loss provisions over total assets; DUMiQ, dummy variable taking the value of 1 for the ith quarter and 0 otherwise; σuc,t, unconditional volatility of the dependent variable computed using a rolling window of four quarters; σc,t, conditional volatility of the dependent variable using a GARCH(1,1) model. ROE(1) and ROA(1) are models without conditional volatility. ROE(2) and ROA(2) are ARCH-M models incorporating the conditional volatility of the dependent variable. Asterisks indicate the significance levels: * stands for 10%, ** stands for 5% and *** stands for 1%.. These findings might cast doubt on the belief that noninterest income activities can lead to better bank performance through diversification activities (reduction in risk and/or higher returns). But there might have been a structural break inside our sample in conformity with our conjecture about a maturation process taking place in the Canadian banking sector. We will verify this conjecture in box VI. Moreover, consistent with expectations that loan loss provisions lower profits, the coefficient of the ratio of loan loss provisions to total assets is negative in all equations. Since this ratio jumps during recessions, that accentuates the procyclicality of ROE and ROA, which have yet been made more procyclical following the banks increasing involvement in OBS activities. Regressing equation (1) using risk-adjusted performance ratios leads to a decrease of adjusted R2, due to the fact that the scaling factor fluctuates greatly from one period to. 32.
(33) …Box IV continued…. another. Results tend to improve when using conditional volatility instead of the historical one to scale the performance ratios, especially for ROA where the adjusted R2 increases from 0.15 to 0.70 when shifting from historical to conditional volatility. In other respects, the results are similar to those obtained for the regressions without risk adjustment.. 33.
(34) Box V The results over the whole sample with a risk premium We also consider the estimation of equation (2) (box III) with the ARCH-M procedure, a new feature for investigating bank performance in this framework. This equation incorporates a risk premium to account for the increasing volatility of bank revenues13. These estimations are reported at table 2 (box IV). We first observe that the introduction of a risk premium in the equations of ROE and ROA results in a jump of the adjusted R2. It increases from 0.72 to 0.80 when regressing equation (2) instead of equation (1) using ROE as dependent variable and from 0.72 to 0.83 when using ROA as the dependent variable. We may thus observe that the risk premium has an important impact on ROE and ROA. Note also that, for both ratios, the risk premium is significant at the 1% level. We thus conclude that banks have reacted to the increasing volatility of their net operating revenue growth by adding a risk premium to the return of their OBS activities, a quite rational, and reassuring, behaviour. It remains to verify if this risk premium was prevailing over the whole estimation period or only after the manifestation of the maturation process. In Box VI, we test this hypothesis.. 13. Note that this procedure is another way to run a regression of return defined on a risk-adjusted basis.. 34.
(35) Box VI Estimation of equation (2) over the subperiods 1988-1996 and 1997-2007 to test for a structural break in banking data It seems that a structural break took place around 1997 (Pellerin 2008). This break corresponds to an increasing volatility of net operating revenues growth and of the ratio of noninterest income per 100$ of assets. We reestimated equation (2) (box III) over the two following subperiods: 1988-1996 and 1997-2007. The results are reported in table 3.. Table 3 Profitability of three Canadian banks vs noninterest income share over subperiods 1988-1996 and 1997-2007 ROE1988-1996. ROE1997-2007. ROA1988-1996. ROA1997-2007. 0.48***. 0.44***. 2.02***. 0.39***. 0.07. -0.25. 0.07**. -0.02. snonin. -0.66***. 0.10. -2.61***. 0.12. LLP. -0.16***. -0.07. -0.62***. -0.54*. DUM2Q. -0.01. 0.01. -0.03. -0.03. DUM3Q. -0.01. -0.01. -0.01. -0.05. DUM4Q. -0.01. -0.01. -0.03. -0.11*. -3.45. 0.04***. -4.15. 30.11**. 0.96. 0.29. 0.97. 0.43. c y(t-1). σt,c 2. Adjusted R. The results are in line with our hypotheses. First, the strong negative effect of snonin on either ROA or ROE seems to have been only effective over the first subperiod (running from 1988 to 1996). In the second subperiod (1997-2007), the coefficient of snonin is positive and non-significant in both equations (i.e. for ROE and ROA). That result is in line with our hypothesis about a maturation process underway in the Canadian banking system. Second, the risk premium is significantly positive only in the second subperiod for both ROE and ROA. Banks have thus adjusted (with delay) to their increasingly volatile operating revenues. Indeed, a risk premium, required to price the increasing risk related to the surging OBS activities, seems to emerge in the second subperiod (199735.
(36) …Box VI continued…. 2007). This result also seems to confirm our hypothesis about the role played by a maturation process. Note also that the fit of our empirical model is very good over the first subperiod (1988-1996), the adjusted R2 being 0.97 for both ratios14. It deteriorates substantially over the second subperiod (1997-2007), especially for the ROE measure, for which the adjusted R2 drops to 0.29. As noted previously, the snonin variable became very volatile over this subperiod, which contributed to lower the performance of our reduced form model. High idiosyncratic risk prevailed.. 14. These strong R2 might be partly due to the loan loss provisions variable which is colinear to the endogenous variables.. 36.
(37)
Figure


+2

Related documents
The curriculum, including curricula delivered both on-site and via distance education, if relevant, must use materials and methodologies appropriate for teaching language and
The provisions of this Law shall apply to health workers, health institutions, professional health associations, institutions for infant and small children care,
The aim of this paper is to focus attention on these properties and to prepare future chemistry teachers not only expand theoretical knowledge about the chemical substances and
This document contains non-GAAP financial measures, "noninterest income”, “net interest income”, “total revenue”, “ noninterest expense”, “net income (loss)”,
2) From 2012, trading related net interest income is reported as net gains and losses on financial items at fair value. For 2012, SEK 523m has been moved from net interest
We have previously audited, in accordance with auditing standards generally accepted in the United States, the consolidated balance sheet of the Company as of December 31,
generally-accepted accounting principles, or GAAP, Attunity uses Non-GAAP measures of revenue, net income, operating income, operating profit margin and net income per share, which
equity Interest rates Gross margin - lending rate - borrowing rate Operating cost Net margin net income/revenue Asset utilisation revenue/assets Return on assets net
