Information Systems and Enterprise Modeling
ICB Institute for Computer Science and Business Information Systems
Institut für Informatik und Wirtschaftsinformatik (ICB)
Interactive Visualisations: Joining
Inter-action Design and Software Engineering
IDC Seminar Sept 16, 2015 Middlesex University London
Agenda
1. Interactive Visualisations
2. Interactive Visualisation Development
as Software Development
3
Traditional Information Visualisation
Principles of presenting information
visually are examined since the end of the 19th century.
Connection between diagrams and
human thinking reflected since
C. S. Peirce 1902 (“diagrammatic reasoning”)
Bertin 1967, Tufte 1983: empirical collections of
diagram types
Existential Graph
http://www.vizworld.com/2010/04/stockmapper-interactive-stock-market-visualization Interactive Visualisations Reports, Charts Clickable Maps Infographics etc. https://www.cg.tuwien.ac.at/research/publications/2007/TR-186-2-07-07/ https://www.graphix-box.nl/en
5
Creating Interactive Visualisations
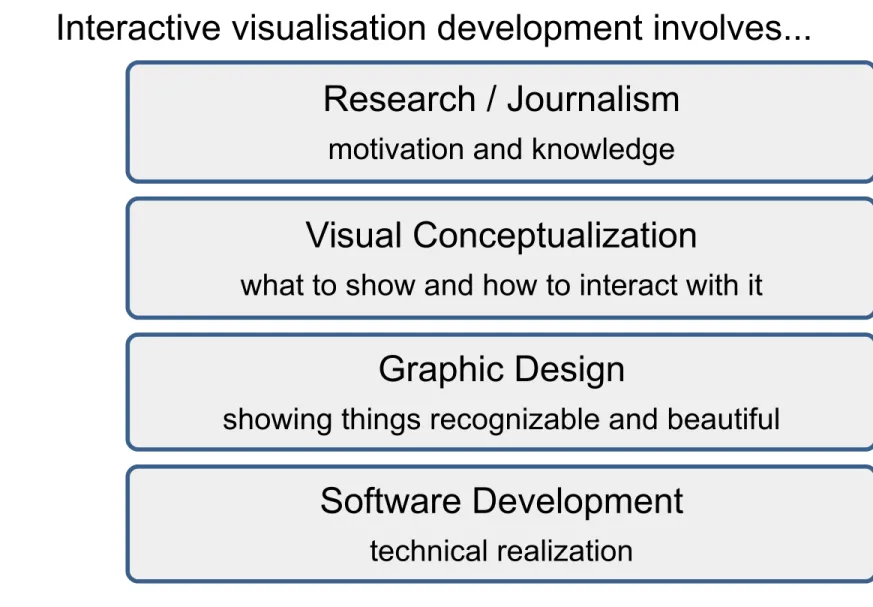
Interactive visualisation development involves...
[Cairo12]
Research / Journalism
motivation and knowledge
Visual Conceptualization
what to show and how to interact with it
Graphic Design
showing things recognizable and beautiful
Software Development
...through the Eyes of a Software Developer
Implemen-tation
Software development method
Analysis
Design Run
Journalism ConceptualizationVisual
Graphic Design Software
7
Interactive Visualisations as Software Products
Fundamental: interactive visualisations require
software to provide interactivity
→ Strong link to software development
Typical technologies for implementation: Action Script in Flash / Dynamic HTML
with JavaScript
Libraries: D3, Infoviz, Prefuse, ... Technological components, but
not “thinking” in terms of knowledge-presentation, information needs, etc.
Interactive Visualisation Development
from the Software Development Perspective
Methods and principles from software development Esp. Domain Specific Software Development
Interactive Visualisations form their own class of
software products
To be examined: what is the language spoken
when creating interactive visualisations
Potential of re-use → capture common
abstractions via domain specific models
Maybe combine with visual prototype editors Finally model-driven code-generation to create
9
Research Question
The software development that is part of creating
interactive visualisations can be seen as a
software development project
Research question: How can software development techniques be applied to interactive visualisation development,
in a way that interactive visualisation software can be developed faster, cheaper, and less
[Gulden15a] Unifying Data and Visualisations
Suggestion for a unified description of data
characteristics and visualisation characteristics
Meta-Model ViewpointType name : EString comment : EString FeatureSignature name : EString minCount : EInt maxCount : EInt ConfigurationValue value : EString AbstractFeatureProvider comment : EString Viewpoint name : EString comment : EString FeatureMapping AbstractDataType ExplicitTypeCast ExplicitStructureCast Viewpoints ViewpointTypes ConfigurationSignature signature 1..* configurationFeatures 0..* featureProvider 1 slots 1..* mapFrom 1 mapTo 1 featureMappings 1..* configurationValues 0..* feature 1 dataType 1 viewpointType 1 typeCast 0..1 structureCast0..1 viewpoints 0..* viewpointTypes 0..* configurationSignature 0..1
11
[Gulden15a] Example Feature Mapping Model
Visual notation example
Title():string,nominal[1] Signature Features Label(x):string,circular[*] Value(x):double,relational[*] Title():string,nominal [1] Feature Extractors Label(x):string,nominal[*] Value(x):int,relational[*] FeatureMapping Data objects
Data objects Pie ChartPie Chart
Alphabetical sorting
[Gulden15a] Prototype
Eclipse EMF meta-modeling environment
and Google Visualisation API
13
[Gulden15a] Comparing Visualisation Types
Substitutability relationship
≥
≥
=
Pie Chart Pie Chart Title():string,nominal[1] Signature Features Label(x):string,circular[*] Value(x):double,relational[*] Bar Chart Bar Chart Title():string,nominal[1] Signature Features Label(x):string,ordinal[*] Value(x):double,ordinal[*] Line Chart Line Chart Title():string,nominal[1] Signature Features Label(x):string,ordinal[*] Value(x):double,relational[*]15
[GuldenReijers15] Research Agenda (1/2)
Basic research for
Information Systems
Identify demand for a
theory that allows to:
Compare visualisations Assess the quality of
visualisations
Justify design decisions Estimate the efficiency
of visualisations
Current approaches are
limited to separation of
17
[GuldenReijers15] Research Agenda (2/2)
Mapping Model map map Conceptual (Meta-)Models Visualization Features abstract abstract Extended Mapping Model map map Model of Conceptual Qualities Conceptual (Meta-)Models Model of Perceptual Qualities Visualization Features Model of Cognitive efficient patterns map map apply
(a) Traditional view
End of the Presentation
Thank you for your attention