a
Saving Lives,
Saving Money
The costs and benefits of
achieving safe roads
Dr Joanne Hill &
Caroline Starrs
April 2011
ATION
FO
The Road Safety Foundation is a UK charity advocating road casualty reduction through simultaneous action on all three components of the safe road system: roads, vehicles and behaviour. For the last decade, it has focused on leading the establishment of the European Road Assessment Programme (EuroRAP) in the UK and internationally, and is the UK member responsible for managing the programme in the UK and Ireland.
Road Safety Foundation Worting House Basingstoke Hampshire RG23 8PX Tel: 01256 345598 www.roadsafetyfoundation.org
The Royal Automobile Club Foundation for Motoring Limited is a charity which explores the economic, mobility, safety and environmental issues relating to roads and responsible road users. Independent and authoritative research, carried out for the public benefit, is central to the Foundation’s activities.
Registered Charity No. 1002705
RAC Foundation 89-91 Pall Mall London SW1Y 5HS Tel: 020 7747 3445 www.racfoundation.org
ATION
FO
UND
Road Safety Foundation is a UK registered charity (No. 295573). Registered in England and Wales as a company limited by guarantee, No. 02069723.
c
Saving Lives,
Saving Money
The costs and benefits of
achieving safe roads
Dr Joanne Hill &
Caroline Starrs
April 2011
Acknowledgments
The authors are grateful to the RAC Foundation and the Rees Jeffreys Road Fund for their financial contributions.
This report has been prepared by Dr Joanne Hill and Caroline Starrs (Road Safety Foundation). The report content is the view of the authors and does not necessarily represent the views of the RAC Foundation or the Rees Jeffreys Road Fund.
Analysis and validation was carried out by Dr Joanne Hill and Caroline Starrs (Road Safety Foundation). Cartography was carried out by Nick Moss (Road Safety Foundation) using Digital Map Data © Collins Bartholomew Ltd (2010). Photography by Dr Joanne Hill and TRL.
This project was supported by a Steering Panel comprising representatives of the Road Safety Foundation (John Dawson, Dr John Mumford, Dr Joanne Hill, and Caroline Starrs), the RAC Foundation (Professor Stephen Glaister and Elizabeth Box) and the Rees Jeffreys Road Fund (David Bayliss).
The authors are grateful to John Dawson and Dr John Mumford for their contributions to the report and Rob Salmon for managing the survey of local authorities and members of ADEPT (The Association of Directors of Environment, Economy, Planning and Transport) who provided information and allowed it to be used. The authors are also grateful to peer reviewers for their helpful comments during drafting.
April 2011 © Copyright Road Safety Foundation and Royal Automobile Club Foundation for Motoring Limited
ii
Contents
Forewords v
Executive Summary vii
The Cost of Road Crashes in Britain 1
1.1 Government valuations of crash prevention 1
1.2 Estimating crash numbers and implications of under-reporting 4
1.3 Road crashes – who pays? 6
1.4 The cost of road crashes and the insurance industry 6
1.5 NHS cost recovery scheme 9
1.6 Recommended improvements in valuations 10
Economic Evaluation of Road and Transport Improvements 13 2.1 Expected rates of return from transport and other public programmes 13
2.2 Rates of return achieved from road safety programmes 17
2.3 FYRR versus BCR 18
2.4 Towards Zero Deaths and the Safe System Approach 19
2.4.1 Sweden and Vision Zero 19
2.4.2 Netherlands and Sustainable Safety 21
2.4.3 OECD’s Towards Zero 22
Identifying the Road Network Where Crash Costs are Concentrated 23
3.1 Estimating current levels of road safety 23
3.1.1 Risk Mapping 24
3.1.2 Star Rating (‘Road Protection Score’) 24
3.2 Crash cost mapping methodology 25
3.2.1 Fatal and serious crash cost per kilometre 27
3.2.2 Fatal and serious crash cost per vehicle kilometre 28
3.3 The differing crash costs across Britain 33
3.3.1 Crash cost density - fatal and serious crash cost per kilometre 33 3.3.2 Crash cost per distance travelled - fatal and serious crash cost per
vehicle kilometre 36
3.3.3 Crash cost per capita 39
3.3.4 Summary results: Scotland and Wales 41
3.3.5 Summary results: the Highways Agency network 42
3.3.6 Summary results: Local Authority primary and non-primary A road networks 42
Establishing Minimum Rational Levels of Safety 43
4.1 Defining rational safety levels for Britain’s roads 44
4.2 Estimating the costs of the programme 47
1
2
3
4.3 Estimating the benefits and costs of achieving safe roads 47
4.3.1 Phasing 49
4.3.2 Distribution of costs and benefits 49
Generating and Evaluating Road Safety Programmes 53
5.1 Current practice in road safety scheme evaluation 53
5.1.1 Crash rates used for route safety assessments 54
5.1.2 Crash data sets 55
5.1.3 Economic evaluation 55
5.2 Supporting standardisation with professional guidance 56
5.3 The integration of maintenance and safety programmes 57
Summary of Key Findings and Recommendations 59
Conclusions 61 References 63 5 6 7 8
ANNEX 1: Government Methodology for Valuation of Road Crashes 68
ANNEX 2: Technical Methodology 71
ANNEX 3: Survey Questionnaire 82
List of Tables
Table 1: Proposed minimum safety level by road type for motorways and A roads x Table 2: Average value of road crash prevention by severity and cost component 3 Table 3: Average value of road crash prevention by severity of casualty/crash-related costs 4
Table 4: Average value of prevention by severity and class of road 4
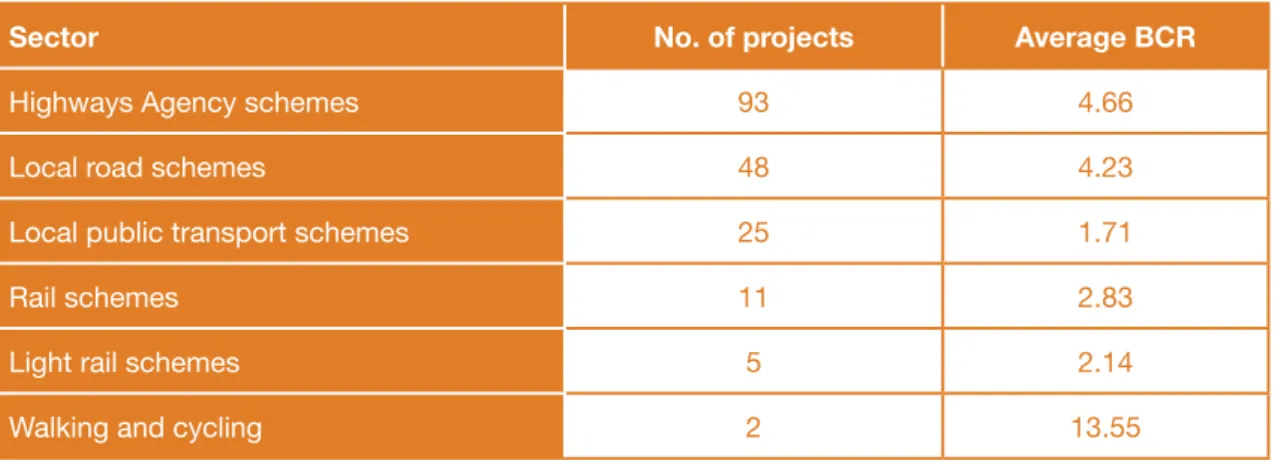
Table 5: Average BCR results from transport schemes by sector 16
Table 6: Allocation of crash costs by injury severity and road type 26
Table 7: Colour coded ‘cost’ bandings 27
Table 8: Benchmark Star Rating by road type 45
Table 9: Road types and risk categories used in estimation of Star Rating 45
Table 10: Benefits and costs for different programme sizes 49
Table 11: Benefit-cost ratios by programme size, nation and road type 50 Table A2.1. Summary of calibration factors across British EuroRAP network 75
Table A2.2: Generic road layout for single carriageway by risk rate 76
iv
List of Boxes
Box 1: British crash statistics and trends 5
Box 2: Record insurance court settlement 7
Box 3: Ethical dimensions of ‘Vision Zero’ 20
List of Figures
Figure 1: Total value of crash prevention by cost component 2
Figure 2: Breakdown of motor claim types in the private motor market 7
Figure 3: Average annual fatal & serious crash cost per kilometre across Britain 27 Figure 4: Average annual fatal & serious crash cost per vehicle kilometre across Britain 28 Figure 5: Fatal and serious crash cost per kilometre on Britain’s motorways and A roads 29 Figure 6: Fatal and serious crash cost per vehicle kilometre on Britain’s motorways
and A roads 31
Figure 7a: Annual fatal and serious crash cost per kilometre on motorways and A roads
for England, Scotland and Wales 33
Figure 7b: Annual fatal and serious crash cost per kilometre on primary and non-primary
A roads, by English region 35
Figure 7c: Annual fatal and serious crash cost per kilometre on primary and non-primary
A roads, by Scottish region 36
Figure 8a: Fatal and serious crash cost per vehicle kilometre on motorways and A roads
for England, Scotland and Wales 37
Figure 8b: Fatal and serious crash cost per vehicle kilometre on primary and non-primary
A roads by English region 38
Figure 8c: Fatal and serious crash cost per vehicle kilometre on primary and non-primary
A roads, by Scottish region 39
Figure 9a: Fatal and serious crash cost per capita on motorways and A roads, for
England, Scotland and Wales 40
Figure 9b: Fatal and serious crash cost per capita on primary and non-primary A roads,
by English region 41
Figure 10: Current and benchmark risk for a typical high risk single carriageway 46
Figure 11: Correlation between Risk Mapping and Star Rating 46
Figure 12: Estimated distribution of Star Ratings across Britain’s A road and motorway
network before investment 48
Table 12: Cost by programme size, nation and road type 51
Figure 13. Costs of upgrading the network to minimum safety standards per capita
Forewords
PROFESSOR STEPHEN GLAISTER, DIRECTOR RAC FOUNDATION
Road accidents have killed 30,000 people over the last decade and still kill six people a day. We understand road risks well enough to know how to reduce this toll of injury and death – yet we fail to implement cheap and effective measures to combat them. Would we tolerate this in any other area of public health?
It is now well accepted that a ‘safe system approach’ to road safety requires safe drivers, safe vehicles and safe roads. The road safety profession and motor manufacturers can reasonably claim to have had some success over recent decades. Higher standards of crash protection for car drivers and passengers mean that there are people now enjoying a healthy life who would otherwise have been maimed or killed. We must continue to make improvements in all three areas, but this report demonstrates that it is time to give more attention to the roads.
The report shows how it is now possible to assess the safety rating of a stretch of road from its physical characteristics and compare that rating against an expected standard. This is an important advance over the long-standing tradition of concentrating on accident ‘black spots’ where tragedies have already occurred.
It turns attention to the prevention of future tragedies by assessing a whole network and spotting those stretches which have a poor safety rating. We can estimate the cost of bringing a substandard stretch of road up to a minimum safety level, and estimate the expected benefits of doing so in terms of reducing the risk of death and injury.
Some will say that we have been focusing on road improvements for years and should now turn our attention to improving drivers’ behaviour. This report does not argue against that course of action. But countries leading in road safety agree that roads should be designed to take account of the fact that all drivers make mistakes, and that the road environment should be made as ‘forgiving’ as possible.
We tolerate unsafe roads yet the cost of bringing the whole system up to minimum standards would be a manageable proportion of what we already spend on our roads; and this cost can be mitigated if we take the opportunities presented as we maintain and enhance the network. For instance, non-skid surfaces and crash barriers to protect against dangerously exposed trees can be installed during routine maintenance. The rates of return from redirecting resources to where they are most effective are so high that it beggars belief that we have not acted sooner.
The UK may once have been a world leader, but this report shows that we are in danger of falling behind far-sighted countries which have decided not to tolerate unsafe situations any longer. We are in danger of becoming complacent: our data are not always accurate; we have a poor understanding of who bears what costs of road accidents; local authorities are using different techniques to assess benefits and costs – there can be little reason to continue to use crude ‘first year rates of return’ when the use of more appropriate estimates of value for money requires just a little more effort.
vi
expertise available for road safety will be reduced, rather than increased. The imperative is to use what we have more effectively, and this report offers guidance on how we can do that. This report should make us angry and determined to act to see more lives saved – at little or no extra cost.
LORD DUBS OF BATTERSEA, CHAIRMAN ROAD SAFETY FOUNDATION
Saving Lives, Saving Money breaks important new ground.
It shows clearly that Britain loses 1.2%-2.3% of GDP annually in road crashes but, for the first time, maps the high concentration of crash costs on targetable A road and motorways.
Innovatively, the report proposes minimum Star Ratings for
infrastructure safety using an internationally established system. This permits public, policy makers and engineers to get to grips with the levels of infrastructure safety we should normally expect for motorways and busy A roads while avoiding complex engineering nuances. It makes the benefits and costs of achieving safe roads transparent and a systematic approach possible.
Without a simple measurement of infrastructure safety, road engineers will remain tongue-tied in trying to explain what might be achieved through a programme of safety fencing, safe turning lanes or any of the other 70 proven safety engineering measures. Without normal methods of cost benefit analysis, safety programmes will continue – as this report has found – to be largely ignored in favour of programmes which are well evaluated.
This report was stimulated by OECD recommendations that countries should examine the institutional barriers that were preventing an economic focus on road crashes. It contains vital new evidence for senior policy makers in national and local government. Some of the highest returns from any public programme are available simply by generating and evaluating crash cost reduction programmes properly.
Safety engineering improvements are typically low cost and last decades. This report reveals that the average serious crash costs on a main road is more than £1m per kilometre in a decade.
Such a high concentration of crash cost explain why simple safety improvements can
routinely pay back their costs within a year – and then go on saving lives and saving money on emergency services, hospitals and long term care.
The good news from the report is that we need mainly to introduce rational economics to help generate programmes and then evaluate them within existing budgets. The resulting programmes can be executed largely by upgrading missing safety features during routine maintenance over the next decade.
If this is done, we can save an extraordinary number of lives and serious injuries as well as billions in crash costs.
The findings of this report detailing the costs of crashes now need to be carried to the hundred or so authorities who are in a position to make roads safe. They need our support and encouragement to prevent not only unnecessary pain and suffering but the unnecessary billions ultimately borne by families and business.
Executive Summary
In the last decade, 30,000 people have been killed and a further 300,000 have been seriously injured in crashes on Britain’s roads. Britons are four times more likely to die on the roads than in any other daily activity. Road crashes remain the leading cause of death amongst young adults. The contrast between the safety performance expected of road transport and the management of all other risks is stark, not least when compared with air, rail or marine safety. The economic impact of road crashes is stubbornly constant. The rate of improvement
achieved in recent decades in reducing the number of reported road deaths by 3% for example is too slow to make significant headway against the growing economic and societal cost of crashes involving bodily injury.
Road crashes that result in serious trauma are now largely preventable yet they consume, for example, around 75% of hospital capacity available for dealing with serious head injuries. Many nations are pursuing policies based on the actions that would be needed to eliminate road deaths, recognising the importance of a safe system approach where actions on roads, vehicles and behaviour are all considered. In 2008, the Organisation for Economic Co-operation and Development (OECD) reviewed the road safety policies of leading nations and called on members to implement the institutional management changes that were needed to focus on economic investment. In 2010, health bodies in the UK (the National Institute for Clinical Excellence, NICE) and internationally (the World Health Organisation, WHO) published material recognising safe road design – traditionally a preserve of road authorities – to be key in a total approach to the reduction of road injury. The recent reform of the Fire and Rescue Service, similarly, has put the management of high risks at its heart, and recognises formally that dealing with road crashes is one of its core activities.
The first section of Saving Lives, Saving Money examines, using published research, the costs of road crashes to the economy, and where those costs fall. It reviews the extent to which these costs – for – central and local government and public authorities such as the NHS and emergency services – are understood. It reviews the costs borne by households and industry, and examines insurance industry data.
The second section reviews how road and transport schemes are evaluated and the rates of return that are expected, and those actually achieved. It describes how the scale of ambition has changed in leading countries as the potential returns from adopting a systematic approach to casualty reduction are understood.
The third section maps the network of roads on which high crash costs are concentrated, and which could be efficiently targeted. It analyses and ranks the crash cost for each English region, Scotland and Wales, and tabulates the costs of crashes on main roads for which particular road authorities have a responsibility to provide visible ‘crash cost centres’. The fourth section proposes, for national discussion, economically rational levels of safety that could and should be achieved for Britain’s main road network. These benchmark levels of safety balance the cost of carrying out effective programmes to improve the safety detailing of the infrastructure against the benefits from preventing death and injury. The result is an affordable, nationally significant, rational programme for the period 2011-2020 with value for money well in excess of most public programmes. The proposed programme would represent a significant contribution from the UK toward the UN Decade of Action for Road Safety, launched worldwide on 11 May 2011.
Prior to reaching a series of recommendations and conclusions, the fifth section of the report reviews a new survey of how authorities currently evaluate safety programmes. It proposes
viii
practical guidance on how crash cost reduction programmes can be generated and evaluated so that national agencies and decentralised authorities are able to make their own choices in a way that makes their performance transparent both to Parliament and local voters.
Section 1: The Cost of Road Crashes in Britain
The key findings of this section are that:• Road crashes cost the British economy between £15 and £30 billion annually (1.2 – 2.3% GDP).
• The aggregate economic costs are well estimated by the Department for Transport (DfT) for general policy purposes and for evaluating the benefits of programmes to reduce casualties. • The way that the cost of road crashes falls on individual services such as the NHS, the
emergency services and, particularly, long-term care is inadequately understood and shared. The DfT considers the costs of care for up to 18 months while third-party court settlements value the costs for over half a century. The lack of transparency of the scale of the crash cost burden inhibits effective action.
• The direct financial costs paid in insurance premiums account for just under 1% of GDP annually (approximately £10 billion). An average comprehensive private insurance premium costs approximately £800. Insurance premiums however only reflect successful insured claims. Around 85% of individual insurance claims relate to property, but around half of claims by value are for bodily injury. While third-party claims for bodily injury can exceed £10 million, claims to the insured and a partner in a typical comprehensive policy are limited to around £10,000, with the remainder of the costs falling on the wider economy. The costs paid to the legal profession from motorists’ premiums by insurers amount to £1 billion annually, excluding insurers in-house costs.
• The value of life and limb is closely linked to GDP per capita which typically rises at 25-30% per decade. The 3% average annual reduction in road deaths achieved in recent decades therefore barely makes headway in reducing the value of those that continue to occur. • Further improvements in crash data recording and analysis are urgently needed so that
consistent measurements of the protection standards of vehicles (NCAP rating) and
infrastructure (RAP rating) are available for fatal and serious injury crash sites. This, and the linking of police crash records to hospital records, so that objective injury information is available, is vital to 21st century road and vehicle design.
Section 2: Economic Evaluation of Road and Transport Improvements
The Coalition Government is seeking nationally significant returns from capital investment and the business community is seeking initiatives to promote growth. Historically, the DfT has regarded programmes with a benefit-cost ratio (BCR) in excess of more than 2 as providing good value for money with a presumption of funding. With tightening finance, higher and quicker returns are needed to assist growth.Recent research has revealed the scale of economic returns achievable by upgrading existing infrastructure and ensuring that simple safety features such as roadside barriers and safe junction layouts are implemented on busy roads. In Britain, BCRs equivalent to 5, 10 or even 20 are commonplace from such schemes. Large-scale systematic programmes on busy main roads in other countries such as Sweden, the Netherlands, Australia, and New Zealand are being rolled out to ensure safe roadsides, safe junctions, safe overtaking and safe villages. In 2008, the OECD took stock of the major developments in international practice and
published Towards Zero: Ambitious Road Safety Targets and the Safe System Approach. The report highlights the “institutional management changes required in many countries to implement effective interventions through a strong focus on results to build the economic case for road safety investment”.
Three simple institutional problems have so far prevented British authorities from grasping the impact and importance of implementing large-scale systematic programmes:
• Safety engineering programmes have not been evaluated or assessed by authorities on the same basis as other major capital expenditure (i.e. in BCRs evaluated over the economic life of the investment), instead being judged on first year rates of return.
• Programmes have not been systematically generated using value engineering, where schemes offering efficient use of restricted resources and highest rates of investment returns over their economic life are prioritised.
• There is a lack of transparency and accountability when it comes to reducing the cost of road trauma, as the associated costs and impacts are spread across many groups including fire, police, ambulance, NHS, business and families.
Section 3: Identifying the Road Network Where Crash Costs
Are Concentrated
For nearly a decade, Britain has been among path finding nations in seeking to systematically measure the risk posed to road users from road infrastructure. Practical support from
Britain’s leading authorities means that the measured risk of death and serious injury on Britain’s motorways and main roads is now available across a 45,000km network. Results have been published annually since 2002 by the Road Safety Foundation, during which time improvements have been tracked, particularly progress in eliminating very high-risk sections of major routes.
This information has now been used for the first time as a key input in this report to map the distribution of serious crash cost across Britain. Defining ‘crash cost centres’ for individual authorities can make the scale of economic loss transparent to the public, and help trigger a proportionate response. In the decade 2011-2020, an average kilometre of this network can expect to see £1 million of loss in crashes involving death and serious injury alone. The inclusion of all injuries and damage broadly doubles this estimated cost. The following key findings relate to fatal and serious crashes on the motorway and A road network studied: • Every year Britain suffers serious injury crash costs of £0.5 billion p.a. on motorways
(excluding the substantial costs of traffic delays), £1 billion on national trunk roads, and £2.5 billion on local authority A roads – 40% therefore incurred by crashes on motorways and trunk roads. These costs are the equivalent of £10 per person on motorways, £20 on trunk roads and £50 per person on the local authority A roads.
• The average annual cost of death and serious injury per kilometre of motorway is £150,000. Britain’s intensively used motorways have the highest concentration of serious crash cost of all the road types even though they are the least risky for individual road users.
• The average annual serious crash cost per kilometre on Britain’s A roads is £82,000 – despite the fact that traffic flows on single carriageways are typically ten times lower than on motorways.
• Expressed as an average serious crash cost per kilometre travelled, the cost of road crashes on local authority A roads is 2.0-2.5 pence compared with 0.5 pence on motorways.
x
• Of the British nations and regions, South-East England loses the greatest GDP from serious injury crashes on main roads mainly because of its larger population.
• Scottish losses are 25% higher per capita than England.
• The Highways Agency network is Britain’s single largest ‘crash cost centre’, with £1.2 billion of serious crash cost annually on its motorways and trunk roads (excluding substantial resulting traffic delay costs).
• Collectively, the largest block of serious crash cost is on local authority roads. English local authorities lose £2 billion annually on their A roads. A local authority outside metropolitan areas might typically be responsible for 300kms of A road with an annual serious injury crash cost in excess of £25 million.
Section 4: Establishing Minimum Rational Levels of Safety
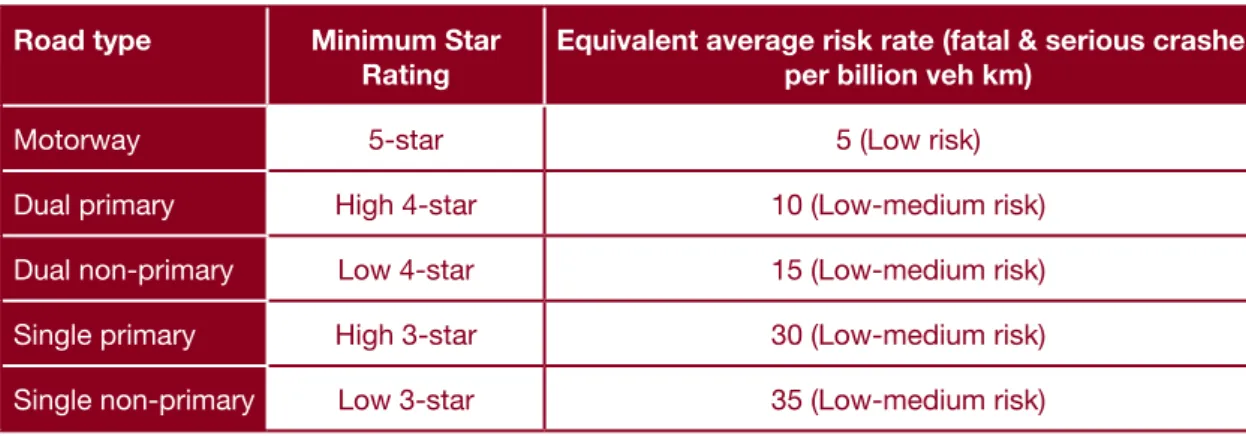
Star Ratings are a high level measure of infrastructure safety obtained from inspecting and scoring the physical features of road design and layout known to have an impact on the likelihood of a crash and its severity. Following analysis and inspection of 7,500kms of British main roads, the following minimum benchmark levels of infrastructure safety are proposed for national discussion.
Table 1: Proposed minimum safety level by road type for motorways and A roads Road type Minimum Star
Rating
Equivalent average risk rate (fatal & serious crashes per billion veh km)
Motorway 5-star 5 (Low risk)
Dual primary High 4-star 10 (Low-medium risk)
Dual non-primary Low 4-star 15 (Low-medium risk)
Single primary High 3-star 30 (Low-medium risk)
Single non-primary Low 3-star 35 (Low-medium risk)
Source: Authors own
Setting minimum benchmark safety levels in this way enables a new transparent and objective discussion to take place between engineers, public and elected members about what
infrastructure safety standards should normally be expected without mandating improvement at any cost. For example, the New Zealand Transport Minister receives information on the Star Rating of the road involved within every fatality report. Ministers from countries as varied as the Netherlands and Malaysia have announced policy goals based on raising Star Ratings.
Setting minimum benchmark Star Ratings at this level implies that even by 2020 risks will be accepted on single carriageway routes that are six times higher than on motorways because investment is being targeted to reduce the greatest numbers of serious injuries given the funds available. Such an approach immediately demands an evaluation of the costs and benefits of a programme that might achieve the benchmarks.
Approximately half of the 2,000 sections of road examined in detail had a safety performance below the proposed benchmark level. The estimated present value of the benefits of raising the standard of these sections to the benchmark level is £34 billion (based on discounted figures over 20 years). Combined with maintaining the solid existing programme in urban cores and some treatment of very high-risk locations on minor local authority roads, this would offer a one-third saving of all British deaths from engineering measures alone – and a total crash
cost saving worth around 0.5% of GDP. This would be further amplified if other education, enforcement and vehicle safety programmes were put in place.
The costs of implementing this programme over the period 2011-2020 was estimated with the assistance of local authorities in South-East England and after examining data provided by the Highways Agency on the costs of 70 standard safety interventions. For example, the average cost of upgrading sub-standard sections of motorway to the minimum 5-star level, where problems are largely of missing or inadequate side ‘run-off’ protection, was estimated at £0.5 million per kilometre.
The cost of the proposed programme across the network is £8 billion. At £800 million p.a. over the ten year programme this represents less than 10% of current annual spending on road maintenance.
The programme BCR would be 4 even if no cost was accommodated within existing essential routine maintenance over the decade and no further value engineering was completed. In practice, the programme BCR would rise substantially. Firstly, the most practical
implementation is to upgrade safety during essential maintenance. Secondly, bulk procurement and consistent orders for safety equipment (e.g. installation of safety fencing) would allow British prices to fall to levels seen elsewhere in Europe.
Major projects which must be completed over many years before they achieve their benefits run significant risks of cost overrun in construction and poor performance when eventually open for service. In contrast, a major safety programme is highly modular with short lead times and quick, certain returns. Major safety programmes are front loaded for the highest returns with subsequent modules costed and value engineered based on the latest experience. A major safety programme in Sweden has been phased so that 75% of network mileage is treated by 2020 and the remainder by 2025. If this strategy were pursued in Britain, the benefits of the proposed programme to 2020 would be £26 billion and the face costs £460 million annually with a BCR of 6. Target BCRs can be set higher to ensure procurement and value engineering efficiencies are achieved.
Section 5: Generating and Evaluating Road Safety Programmes
With the support of ADEPT (the Association of Directors of Environment, Economy, Planning and Transport), a sample of local authorities was surveyed to establish how they generated and evaluated schemes to improve infrastructure safety. The key findings of this survey were: • The Police STATS19 form for recording crashes and DfT economic parameters were
universally used.
• Nearly one-third of authorities use ‘black spot cluster analysis’, a technique introduced in the 1930s, rather than proactively eliminating known high risks along routes. Short period analysis, typically three years, was the norm but some authorities examined ten year crash histories.
• The returns from infrastructure investment were universally evaluated over the first year only and expressed as a ‘first year rate of return’. Whole life costs and benefits using BCRs were not typically used preventing comparisons with competing non-safety schemes.
• Where authorities set economic hurdle rates before a scheme would be funded, this was typically 100% rate of return (implying a BCR in the order of 10-15).
xii
• Evaluation of previously implemented schemes showed a typical intervention cost less than £100,000 to save a death or serious injury per year (i.e. less than £10,000 for each death or serious injury saved, for schemes with lifetimes of ten years or more).
• There was an appetite for improved guidance on generating and evaluating safety schemes. While many of the variations in approach are fully compatible with empowering local choices there is a lack of good practice guidance for local authorities to refer to in this area. Without comparable measures, transparency and the transfer of best practice between authorities is hampered.
Sections 6 and 7: Summary of Key Findings, Recommendations and
Conclusions
• A nationally significant high return programme to raise the safety of Britain’s infrastructure is possible within current budgets in the period 2011-2020, particularly if implemented during the course of routine maintenance.
• Britain should define minimum benchmark levels for infrastructure safety which would be achievable on most main roads by authorities in the period 2011-2020, particularly during the course of routine maintenance.
• Transport ministers and local authority leaders should follow recent OECD
recommendations and best international practice to set ambitious goals for the safety of the roads for which they are responsible, based on a properly evaluated economic case.
• Senior policymakers in each responsible road authority should call for the generation of a programme of crash cost reduction measures and evaluate these objectively and transparently alongside other priority programmes.
• The cost of road crashes on main roads should be published by the Road Safety
Foundation annually for each authority, alongside its annual report tracking the risk of fatal and serious crashes on Britain’s motorways and main roads.
• Elected local authority leaders should be provided with accessible published information, including independent critique, on the safety performance of the road infrastructure for which they are responsible.
• The Highways Agency, as Britain’s single largest crash cost centre, should act as a model ‘best practice’ institution leading a vigorous crash cost reduction programme from which authorities throughout Britain can learn.
• The professional associations, the Road Safety Foundation, and the Highways Agency should develop professional guidance on the generation and evaluation of crash cost reduction programmes.
• Parliament and the Treasury should examine the value for money that can be provided by programmes to reduce death and injury, and investigate how institutional barriers to rational investment and priority setting can be overcome.
• Improvements in crash data recording and analysis are needed so that measurements of the protection standards of vehicles (NCAP rating) and infrastructure (RAP rating) are provided as standard. This, and the linking of police crash records to hospital records, is vital to 21st century road and vehicle design.
1. The Cost of Road
Crashes in Britain
Road crashes impose a range of impacts
on people and organisations not least the
immeasurable pain, grief and suffering of family
and loved ones. These include the obvious costs
of fire, police, ambulance and medical services,
and material damage to vehicles and property.
Less obvious costs such as lost economic
output, long-term care, insurance, administration,
and legal and court costs are also incurred.
Britain’s Coalition Government is seeking substantial efficiency
improvements as it reduces public spending to tackle the budget deficit. With this crash cost valued at between 1.2–2.3% of GDP, a reduction in the number and cost of the most expensive injury crashes represents a significant efficiency improvement which would enhance the economy and reduce demand for a raft of public services.
This section examines the true cost of road crashes, reviewing the financial costs to the economy and how cost estimates are generated. The role of the insurance industry and the diverse crash cost centres, including emergency services and highway authorities, is addressed and recommendations for improvement are presented.
Government valuations of crash prevention
Well-designed interventions, such as the provision of safe roadsides or safe junctions along a route, have the potential to reduce the number of road crashes and their severity. Road safety schemes are assessed against affordability and economic effectiveness criteria to find those that represent a good investment return and a responsible use of public money.
The Cost of Road Crashes in Britain 2
In order to establish cost-efficient national, regional and local policies for casualty reduction and enable the economic evaluation of returns from practical programmes, crashes and casualties are assigned a cost, and form the key quantitative indicators for the appraisal of transport interventions. Combining these numbers with values for prevention yields a monetary estimate of the related costs and benefits of proposed improvement schemes. The economic return from an intervention is determined by how much greater the benefits are than the costs. Confidence in the costings is critical to ensure that they provide a robust and relevant basis for the prevention of road death, trauma and collisions.
The DfT estimates that in 2009 all road crashes cost the economy £15.8 billion (DfT, 2010a). This includes an estimate of the cost of damage-only crashes, but does not allow for unreported injury crashes – these could almost double the costs to £30 billion (3% of GDP). Figure 1 shows how this total crash cost is distributed.
Figure 1: Total value of crash prevention by cost component
Damage to property £150 million (1%) Ambulance & medical Insurance & admin Serious human cost
Fatal human cost
Slight human cost Lost output £5,040 million (32%) £3,560 million (22%) £530 million (3%) £1,970 million (12%) £2,160 million (14%) £2,420 million (15%)
Source: Using DfT (2010a: 39)
Since 1993, the DfT, with Treasury approval, has based the valuation of both fatal and non-fatal casualties on a consistent ‘willingness-to-pay’ methodology, encompassing both human and direct economic costs. Valuations include an amount to reflect pain, grief and suffering, as well as the lost output and medical costs associated with road crash injuries. The willingness-to-pay methodology assesses how much a sample of the population would be willing to willingness-to-pay for
various improvements in safety. The mid-point of £1 million, of a range found to extend from £750,000 to £1.25 million in 1997, forms the basis for the DfT’s value for the prevention of a death. A similar approach has been used to derive values for serious and slight casualties, each pegged to the fatality value. Annex 1 summarises the underpinning research.
The current values for prevention of casualties (at 2008 prices) by injury severity and class of road user are set out in the tables below (DfT, 2010b). These include various cost components: • Loss of output due to injury is calculated as the present value of the expected loss of
earnings plus any non-wage payments (national insurance contributions, and so on) paid by the employer. This includes the value of consumption of goods and services lost as a result of injury crashes.
• Human costs represent pain, grief and suffering to casualties, their relatives and friends. For fatal casualties the intrinsic loss of enjoyment of life, except consumption of goods and services, is included.
• Ambulance costs and the costs of hospital treatment covers the costs of attending the crash scene and subsequent treatment.
Injury crashes are classified according to the most severe casualty, but on average may involve more than one. For example, a crash involving one vehicle where one occupant sustains a slight injury and the second a serious injury would be classed as a serious crash. For this reason, the value of prevention for injury crashes is greater than that for the corresponding casualty. Table 2 shows the total value of road crash prevention by severity and cost component. These represent minimum estimates, and do not take account of associated effects such as delays to other road users.
Table 2: Average value of road crash prevention by severity and cost component
£ June 2008 Injury severity Lost output Human costs Ambulance & medical TOTAL
Fatal 578,840 1,103,980 990 1,683,810
Serious 22,300 153,400 13,510 189,200
Slight 2,360 11,230 1,000 14,590
Average, all casualties 10,940 39,270 2,410 52,620
Source: DfT (2010b: 3)
Elements of the value of prevention can be classified according to whether they relate
specifically to casualties or to the crash as a whole. Casualty-related values include lost output, medical and ambulance costs, and human costs, since each individual casualty will incur costs in this area. Police, insurance and property damage relate to the crash. The total value of prevention is the aggregate of these (see Table 3).
The Cost of Road Crashes in Britain 4
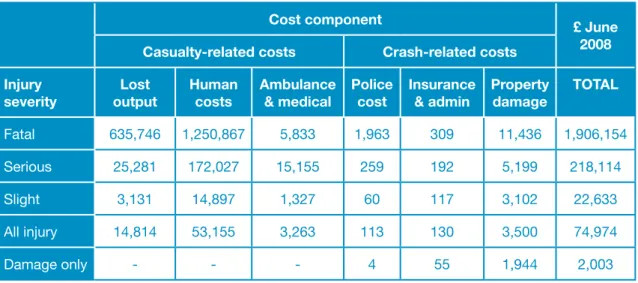
Table 3: Average value of road crash prevention by severity of casualty/crash-related costs
Cost component £ June
2008 Casualty-related costs Crash-related costs
Injury
severity outputLost Human costs Ambulance & medical Police cost Insurance & admin Property damage TOTAL
Fatal 635,746 1,250,867 5,833 1,963 309 11,436 1,906,154 Serious 25,281 172,027 15,155 259 192 5,199 218,114 Slight 3,131 14,897 1,327 60 117 3,102 22,633 All injury 14,814 53,155 3,263 113 130 3,500 74,974 Damage only - - - 4 55 1,944 2,003 Source: DfT (2010b: 4)
The average number of casualties per crash and the cost of vehicle damage both vary by road category. For example, a serious collision on a non-built up road will on average involve 1.17 serious casualties, compared with 1.07 serious casualties on a built-up road, together with a greater amount of vehicle damage (DfT, 2010b).
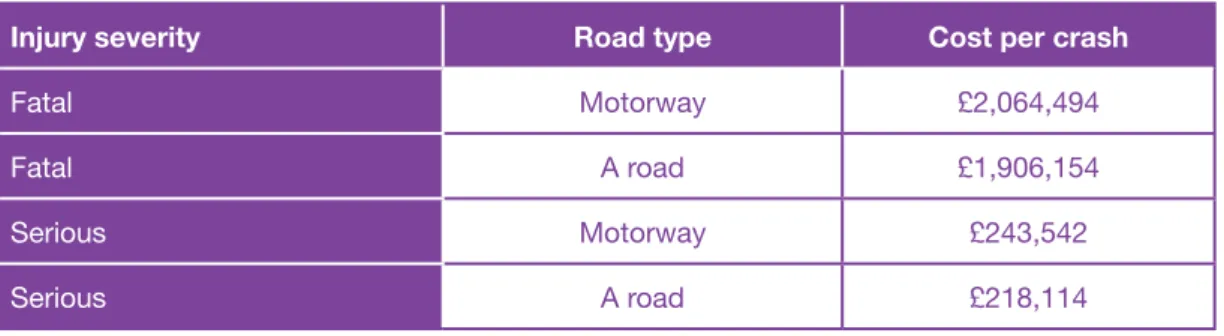
Table 4 shows the variation in average values of prevention by road class and injury severity. The average value for a fatal crash is greater for motorways than for built-up and non-built up roads. This reflects the fact that a typical motorway crash will result in a higher fatality rate (which is attributable in part to the higher speeds permitted on this network).
Table 4: Average value of prevention by severity and class of road
Road class1 £ June 2008
Injury severity Built-up Non built-up Motorway All
Fatal 1,806,191 1,973,602 2,064,494 1,906,154 Serious 209,844 234,473 243,542 218,114 Slight 21,465 25,188 29,928 22,633 All injury 59,718 121,041 89,080 74,974 Damage only 1,880 2,779 2,673 2,003 Source: DfT (2010b: 4)
Estimating crash numbers and implications of under-reporting
A major concern in valuations of crash prevention are not on how costs are compiled but on the weaknesses in how Britain defines and records crashes and injuries. The DfT has taken a number of significant steps to research and address these and to adjust costings appropriately, but concern about British figures continues to be publicly expressed by leading international researchers (e.g. Elvik, 2010).
1 Built-up roads are those other than motorways with speed limits of 40pmh or less; non built-up roads are roads other than motorways with speed limits greater than 40mph
Box 1: British crash statistics and trends
Road crashes in England and Wales account for one in every 245 deaths (DfT, 2010a; ONS, 2010). In the last decade, 30,000 people have been killed and a further 300,000 seriously injured on Britain’s roads. On average, 73 people are killed or seriously injured every day – a toll
far greater than that seen in other forms of transport2. While the latest figures for the year 2009
show a steady decrease, reaching an all time low of 2,222 fatalities (57% lower than in 1990) and 24,690 serious injuries (down 59%)(DfT, 2010a; DfT, 2011), Britons are 4 times more likely to die on the roads than in any other daily activity (Allsop, personal communication 2011). Road crashes are the leading cause of death in young adults and can readily require half a century of care, with significant reductions in quality of life. In 2009, 65 under-16’s were killed and a further 18,307 injured on Britain’s roads – 2,267 seriously (DfT, 2010a). Formal public health guidance is now in place focusing on road design and engineering safer routes (NICE, 2010). Annual statistics reveal some important variations. For example, urban roads are more than twice as dangerous as rural roads per kilometre travelled and account for two-thirds of all road crashes. However, crashes on rural roads tend to be more serious, with 38% of road fatalities occurring on rural A roads and a further 21% on other rural roads. The vast majority of pedestrian injuries – 95% – occur on urban roads, with children being disproportionately at risk. Crashes on rural roads more often include car occupants.
Under-reporting and misclassification of injury severity is well recognised. Although the two are not equivalent measures, comparisons between police reports at the scene of a crash and hospital records of admissions and treatment show a substantial mismatch in terms of both absolute casualty numbers and recent trends over time.
Hospital Episode Statistics data, collated by the Department of Health, provide a means of monitoring the number of road traffic casualties admitted overnight to hospital, involvement by consultants, and hospital discharges for England. The external causes of injury for all admissions are recorded allowing road crash victims to be identified.
STATS19 data (generated by police STATS19 forms for recording crashes) provides information on personal injury road crashes occurring on Britain’s public highways, and their consequent casualties. Data are collected by police forces and local authorities to an agreed national standard, and are collated and analysed by the DfT. STATS19 defines a serious injury as one requiring a person to be detained in hospital as an in-patient, or as one found on a broad list of injuries (ranging from life threatening to relatively minor) whether or not they are detained. The police are not necessarily informed that a casualty has been admitted to hospital following a crash, nor is there a duty on hospitals to reveal this information even if it is requested. It is generally accepted that whilst the STATS19 record is an underestimation of the true number of road crash casualties, it is nevertheless the most detailed, complete and reliable single source of information on the subject.
Comparison of hospital and police records shows that:
• an appreciable proportion of non-fatal crashes are not reported to the police (Ward et al., 2006); • the total number of annual road casualties in Britain, including those not reported to police,
is currently estimated as 610,000-780,000, with a central estimate of 700,000 (Tranter, 2010). This is in comparison to the 215,000 currently officially reported (DfT, 2011);
• up to a-fifth of casualties reported to the police are not included in STATS19 data (see Ward et al., 2006);
2 A total of 9 people were injured in train crashes in 2009, and none killed. Only 1 person has been killed since 2005 (DfT, 2010a). In 2008, 395 deaths and serious injuries to plane passengers and crew were recorded (DfT, 2009a).
The Cost of Road Crashes in Britain 6
• there are three times as many casualties in road crashes as there are reported to, and by, the police (with under-reporting for cyclists and motorcyclists involved in single vehicle crashes much higher);
• to take account of misclassification and under-reporting/recording the number of serious casualties should be increased by a factor of 2.76(Simpson, 1996).
The law requires crashes involving any personal injury to be reported to the police only if those involved have been unable to exchange personal and insurance information. However, the public can be unwilling to do so in an effort to protect premium-related no-claims discounts (Privilege Insurance, 2005). A survey of 2,000 respondents by Confused.com in 2009 found that 38% of motorists were so concerned about losing their no-claims bonus and incurring higher premiums that they avoided making car insurance claims altogether.
Studies also suggest that police underestimate injury severity more frequently than they overestimate, because of the inherent difficulties of assessing and classifying severity at the crash scene – this despite the definition of serious injury being ‘intentionally broad’ to allow a layman to determine severity quickly and easily.
Accepting these issues as part of the system means that the way in which casualty targets are monitored, and policy shaped is being undermined. This is particularly pertinent in the allocation of adequate funding to those central to preventing road crashes or stepping into the breach to save lives once a crash has occurred. A key step in determining whether all costs are being accounted for is to determine the major ‘crash cost centres’.
Road crashes – who pays?
In a serious road crash, victims may have to be cut out of the vehicle by the Fire and Rescue Service, attended by paramedics and other medical experts, and taken to hospital by the ambulance service. Police have wide-ranging and well-documented responsibilities as they move in to protect the scene, inform relatives and take witness statements. The costs of physical damage, from vehicle and property repairs to wreckage clearance, involve another chain of costs falling on highway authorities, insurance companies and private owners. With limited exceptions, the emergency and long-term medical care costs fall on the NHS (see section 1.5). The average length of a stay in hospital following a road crash is 3.9 days (DfT, 2010b). The cost of personal care tends to fall on family, freinds and local authorities.
Families pay direct costs through motor insurance premiums, and bear all the human costs of sudden violent death or injury which cannot be, or are not, reimbursed by third-party insurance pay-outs (see section 1.4). Much of the burden of long-term care inevitably falls on families, and this too can take these individuals out of the workforce. Where a breadwinner is unable to continue working and there is no third-party insurance payout, families can suffer a personally devastating loss of income.
Annually, families and business together pay the £407 million levy (Motor Insurers Bureau, 2010) made on all motor insurance policies to cover crash costs from uninsured drivers that cannot be recovered. Many smaller vehicle and property damage costs are not reimbursed through insurance as a result of policy excesses, unwillingness to lose a no-claims bonus or, in the case of larger businesses, self-insurance. Business bears some of the cost through insurance and lost production as employees (including family carers) become unavailable for work. The economy at large bears the balance, with taxpayers financing welfare bills that become payable when an individual is unable to work. The cost of lost tax revenues are made up by taxpayers.
The cost of road crashes and the insurance industry
Britain has had compulsory motor insurance since Herbert Morrison’s 1930 Road Traffic
1.3
Act. Funding of the record £17.5 million court award cited in Box 2 will be settled through an insurance claim. The main types of risk covered by motor insurance policies include (1) damage to vehicles and property; (2) fire and theft; and (3) bodily injury. An individual claim can involve any or all of these.
Box 2: Record insurance court settlement
In October 2010, the English courts awarded a record £17.5 million compensation payout to a sixth-form student paralysed in a road crash. The young woman was 16 when, in November 2006, a lorry hit the car she was travelling in and left her with catastrophic brain injuries and confined to a wheelchair. Now twenty years old, she lives in a care home. The award means that she will receive a lump sum of £4 million, plus index-linked, tax free payments of £300,000 a year to cover care for the rest of her life.
Annually three-quarters of UK households purchase motor insurance. Each year around three million motor claims are made, with total net claim payouts in 2009 totaling £9.9 billion (ABI, 2010a), the majority involving minor damage such as bumps, dents and scrapes.
Figure 2: Breakdown of motor claim types in the private motor market
0 20 40 60 80 100 2001 Accidental Damage Theft
Bodily Injury Property Damage Other
2002 2003 2004 2005 2006 2007 2008 2009 120
140
%
Source: ABI (2010a: 6)
Figure 2 shows the breakdown of various claim types in the private motor market (ABI, 2010b). A claim may have several elements including accidental damage, bodily injury, and property damage.
Of all private motor claims notified over the past nine years, 60-70% involved accidental damage. In 2009, just over 85% of motor claims related to property damage to property (including accidental vehicle damage, property damage, fire and theft), but claims for bodily injury now account for half of all payments. Bodily injury claims are accounting for an increasing proportion of total claims up from 4.7% in 2003 to 11% in 2009.
Higher claim costs for damage are associated with more serious crashes but the astonishing improvement in personal protection from crumple zones and airbags can mean significant
The Cost of Road Crashes in Britain 8
repair costs in even low speed collisions. Higher claim costs for bodily injury are a reflection of a better survival rate afforded from safer vehicles.
The management information systems of the insurance industry provide rich insights into the cost of road crashes and changes over time, but the data do not cover all cost components in Britain. The total cost of road crashes to the British economy is substantially more than those settled through insurance claims, because so many of the individual elements fall outside of the insurance system, or are in a form where a cash transaction does not, or in practice cannot, result. The major omissions are those not made to keep an accident record clean or protect a no-claims bonus.
The Motor Insurers Bureau is a not-for-profit company run by members of the industry, supported by the Government, to reimburse those impacted by uninsured drivers. Annually, uninsured drivers injure over 20,000 and kill over 150 (Motor Insurers Bureau, 2010). The levy call to members in 2009 to meet claims was £407 million – a cost met by motorists buying cover. In recent years, with the DVLA and police, the Bureau has been a partner in the development of insurance databases that have proven successful in reducing the cost of uninsured drivers. Many UK motorists may be surprised to find that they are not fully covered by comprehensive motor insurance. Compulsory motor insurance was introduced to protect the interests of third parties and as such a typical comprehensive policy, accounting for 90% of all those sold in the UK (ABI, 2010b) makes a significant differentiation between (i) injuries to third parties where cover is typically provided to a maximum £20 million, and (ii) injuries to the policyholder and their partner, where there may typically be a maximum of £5,000-£10,000 even in the event of death or brain injury. The distinction between self and third-party insurance is important to understand as just one of the major differences between the costs paid by the insurance system and the costs to the British economy at large. Unless there is an additional insurance in place, the driver of a vehicle deemed at fault in a crash (and their partner) may receive just £5,000 towards a lifetime of care. The remainder must be borne elsewhere.
Insurance for personal injury is managed differently in some other countries. Australia and New Zealand operate ‘no fault’ schemes so that the sums for which crash victims are insured does not depend on whether or not a court judges them to be at fault. There are disadvantages of this system, for example, it does not impose penalties on drivers with a poor safety record or permit a competitive market in personal injury insurance. However, a key advantage is the substantial saving in legal costs. The costs paid to the legal profession from motorists’ premiums by insurers amount to £1 billion annually, excluding insurers in-house costs.
Nations with the best road safety records now expect the severity of injuries to be mitigated by the quality of highway safety engineering. The New Zealand Transport Minister, for example, receives a monthly report of all fatal crashes, showing the Star Rating of both the road section and vehicles involved (personal communication, KiwiRAP 2010).
The issue of disparity between third-party and at-fault injury compensation has not surfaced as a concern in Britain in recent years, perhaps because the NHS is free at the point of need and mass motorisation took place after the welfare state was established. Care services support crash victims in the same way as they would anyone else in need. Some employees may also receive full or partial compensation for loss of income through company insurance schemes in the event that they are unable to work in the short (up to two years) or long-term.
Generally, a highway authority can only recover costs for damage to the road when it is not at fault itself and where it can also identify someone to claim from. For example, it is difficult to identify a driver colliding with a modern safety fence who will drive away unhurt. Although some powers and procedures exist, for the purposes of this report we have not been able to establish the extent to which the costs of NHS, highways authorities and other public bodies are reimbursed by insurance payments.
The headline concerns of the insurance industry are: • the chronic and unusual lack of profitability in Britain;3
• rising bodily injury claims; • fraudulent claims; and
• young drivers and motorcyclists, where the cost of bodily injury claims can be substantial and long-term.
The Motor Insurance Repair Research Centre at Thatcham represents a practical response to vehicle repair costs, conducting research and data to assist in the efficient, safe and cost effective repair of motor vehicles. They provide some 70% of the data that insurers use to define a cars’ insurance grouping. Their work means that the insurance industry is helping to prevent the significant challenge of repair costs increasing exponentially. Advances in vehicle safety over the last ten years means that the NCAP safety performance of the typical new vehicle sold in Europe is now 4-star, with 5-star being achieved by some. This has made a major contribution to the reduction of road death and serious injury as new safer vehicles begin to replace older models. Thatcham is making a major contribution to keeping demands on repair costs within bounds as crumple zones, air bags, ABS, ESC and the increasing safety and comfort provided by electronic systems has been added as standard in modern vehicle design.
Headline consumer concerns about motor insurance focus mainly on price, and particularly on the cost to young men. The urgent inquiry by the Transport Select Committee on Motor Insurance announced in November 2010 was triggered by rapid rises in premiums during 2010, which reflected the industry’s need to seek profitability. Lack of affordable insurance or innovation in targeted pay-as-you go products threatens to create an underclass of those who, feeling priced out of driving legally, drive without insurance.
Supported by strong global theoretical and empirical evidence (e.g. MacMahon & Dahdah, 2008), economists would expect all human costs from road crashes to rise in line with the growth in GDP or real incomes. As such, a typical British bodily injury claim might be expected to increase by 25-30% in real terms (i.e. over and above inflation) per decade. In addition, as the general longevity of the population increases, so too does the period over which care must be provided. The rising value in what we are willing and able to pay to prevent death and injury is a central strain on NHS funding but is little discussed when considering the overall financial benefits that accrue to the economy from road casualty prevention.
NHS cost recovery scheme
Since the 1930’s, hospitals have been able to recover the costs of treating certain road traffic crash victims. On 5 April 1999 the Road Traffic (NHS Charges) Act came into force, providing a structured and centralised policy for the collection of NHS charges from insurance companies following specific road crashes.
On 29 January 2007, the scheme was replaced with the NHS Injury Costs Recovery scheme, expanding the circumstances under which the NHS can reclaim the cost of treating injured patients to all those involving personal injury compensation. Provision was also made for the recovery of ambulance costs, including the first journey to A&E and any subsequent transfers to other hospitals (Department of Health, 2007).
NHS charges are levied when a person is involved in a road crash and, as a result, receives examination or treatment at an NHS hospital, and subsequently claims and receives
3 British insurers made an underwriting loss in 2009 of £1.6 billion – the 15th consecutive year of loss. Premium income decreased by 5 per cent and claims increased by 10 per cent (ABI, 2010b); AA British Insurance Industry Index, 2009, estimated that for every £100 spent on motor insurance premiums £105 is lost in claims.
The Cost of Road Crashes in Britain 10
compensation from the holder of a compulsory motor vehicle insurance policy. As a routine part of making a claim, a claimant is asked if they have received NHS hospital treatment and, if so, at which hospital. The insurer passes this information on to the Compensation Recovery Unit (CRU), part of the Department of Work and Pensions with links to all insurers. The CRU confirms with the hospital that treatment has been given, and established whether the person was treated as an inpatient or outpatient. Costs of treatment are calculated by the CRU using a simple tariff (as of April 2010):
• where the injured person is provided with NHS ambulance services: £177 for each occasion; • flat rate for treatment without admission: £585;
• daily rate for treatment with admission: £719; • a cap on charges in any one case of £42,999.
The insurer receives a time-limited certificate of NHS charges from the CRU which must be settled within 14 days of paying compensation to the crash victim. Once payment is made the money is transferred directly to the hospital and they are free to use the income for any purpose.
In the period 1 April 2009 to 31 March 2010, £182 million was paid to the NHS in cost recovery (note that this figure includes compensation for personal injuries and road crashes combined – both having been applicable since 2003). Payments to ambulance trusts totaled £6.5 million during the same period (Department of Health, 2010). Given the latest DfT cost allocation of £530 million for medical and ambulance services (shown in Figure 1), this suggests that the scheme may only be recovering around one-third of the total costs incurred.
Recommended improvements in valuations
For this report we examined a number of policy-sensitive issues – for example, we looked into whether the propensity for more serious injuries to car occupants on faster roads outside built-up areas was taken into account in the DfT’s valuations and found that it was. We concluded that overall, the approach and underpinning research used by the DfT is of a high standard, and the costings are fit for purpose in their current role of providing a relevant basis for economic evaluation of practical programmes to prevent road death and injury. There is a need, however, to periodically update them, as the DfT is currently doing. The current valuations reinforce economic costs of road crashes in Britain as broadly equivalent to 1.2% of GDP, with total costs closer to 2.3%. While areas for improvement were found, none were deemed to have a material impact on overall economic evaluation of programmes.
While in aggregate the economic burden of crashes is well estimated, we found the costs to be unrealistic in a number of areas important to current policy formulation. This was primarily the case for those costs falling on public services. We note, for example, that when the Bain Report (Bain, 2002) examined the role and activities of the Fire and Rescue Service in 2002, it recognised dealing with road crashes as one of its core functions, leading to its formalisation inside a general strategy of risk prevention and duties. Likewise, The Home Office includes a measure of casualty reduction in its Analysis of Policing and Community Safety Framework (Home Office, 2010). In 1999 the Department of Heath set a target to reduce, by 2010, the death rate from accidents (including road crashes) by at least one-fifth and the rate of serious injury by at least one-tenth (Department of Health, 1999). The medical profession deal with the consequences of road crashes as part of the wider NHS covering ambulances, casualty wards, intensive care, convalescence and rehabillitation.
In the DfT estimates, we noticed the following weaknesses in particular:
• Recording casualties using police officers at the crash scene does not correspond adequately with hospital records. It’s not practical that the Police, or indeed a doctor, should be asked at the point of a crash to reliably record whether the consequences are
1.6
slight or serious. Injuries need to be understood in medical terms. Reporting can also vary over time, as different constabularies adjust explanations to guide officers who have to interpret ambiguous questions against what they can recall while, perhaps, dealing with multiple casualties in difficult circumstances.
• There is no cost attributed to long-term care after 18 months, yet courts are making multi-million pound awards for third-party compensation based on the decades of care that many victims will require.
• The cost of £1,000 as an estimated average for police resources required to deal with a serious road crash is very low. The figure appears to be based on a conservative estimate of the amount of officers’ time involved, costed at the wage rate rather than basing it on the full cost associated with command and control, equipment and vehicles, allowing an allocation of normal overheads for recruitment, training, R&D, publications, consumables, and so on.
• Similarly, the medical costs to the NHS of a single injury crash are estimated to be less than £1,000 even though road crashes are a known major source of demand.
• International researchers have suggested that long-term costs are underestimated referring to evidence that shows a reduction in life expectancy amongst parents and partners who lose a family member in a road crash (Elvik, 2010).
The danger of failing to understand how each of the cost centres is affected leads to road crashes being seen as unavoidable, rather than a largely preventable cost. This is captured well in the OECD’s Towards Zero report (OECD, 2008), which suggests that institutionalisation of road death and injury in the budgets of those dealing with the toll is part of the problem – in other words, everyone pays but no-one is responsible. Decentralisation policies can help to ensure that Britain spends less on coping with road crashes by making costs transparent and empowering authorities to act.
Budgets and procedures to compartmentalise road death and trauma have long been set – fire, police, ambulance, medical services, long-term care, compulsory insurance, and so on. While there is no direct financial incentive to invest to prevent road crashes, there is pressure on each organisation involved to minimise the associated financial costs. We recommend that each of the main cost centres be provided with a fully allocated cost of dealing with road crashes from a financial professional. This would form a solid starting point in establishing the true financial burden incurred, helping to define how to construct better systems to incentivise the management and control of the loss of up to 2.3% of Britain’s economy.
Many local agencies engage in road safety work and they have more impact when their efforts are well co-ordinated. A new ‘Total Place’ initiative by the Treasury looking at how a ‘whole area’ approach to public services can lead to better services at less cost would work well in road safety. The methodology seeks to identify and avoid overlap and duplication between organisations – delivering a step change in both service improvement and efficiency at the local level, as well as across Whitehall (HM Treasury, 2010a).
The NICE formal public health guidance, focusing on the prevention of unintentional injuries among children below fifteen years of age through road design and engineering safer routes (NICE, 2010), advocates co-ordination between health professionals and local highway authorities to promote change. It recommends specifically that a senior health professional takes responsibility for the health sector’s involvement in casualty reduction.
Highway engineers are responsible for providing a safe road network. In the last decade, ministers have tended to prioritise journey time reliability through reduced congestion rather than road safety. National and local highway engineers must address safety as a part of their
The Cost of Road Crashes in Britain 12
responsibilities, with issues such as procurement, project management, incident clearance and construction standards being at least as pressing.
As public awareness of the need for safer roads increases, local communities are pressuring local authorities to address the design and layout of road infrastructure and to improve road condition. In a review of current road safety practice and funding, presented in detail in Section 5, we found that life-saving programmes are not being rationally generated or evaluated. Even where a local authority was found to be using economic appraisal, the cut-off rate implied no investment unless schemes delivered benefit-cost ratios (BCRs) of nearly 20 to 1 (some ten times greater than the estimated return achieved by the high speed rail programme).
The next section addresses the often poor political and professional understanding of the costs of road crashes, and the value that should be placed on prevention.