Leveraging Natural Language Processing
Applications and Microblogging Platform for
Increased Transparency in Crisis Areas
Ernesto Carrera-Ruvalcaba
Southern Methodist University, [email protected]
Johnson Ekedum
Southern Methodist University, [email protected]
Austin Hancock
Southern Methodist University, [email protected]
Ben Brock
Wells Fargo, [email protected]
Follow this and additional works at:
https://scholar.smu.edu/datasciencereview
Part of the
Artificial Intelligence and Robotics Commons
,
Probability Commons
,
Social Media
Commons
, and the
Statistical Models Commons
Recommended Citation
Carrera-Ruvalcaba, Ernesto; Ekedum, Johnson; Hancock, Austin; and Brock, Ben (2019) "Leveraging Natural Language Processing Applications and Microblogging Platform for Increased Transparency in Crisis Areas,"SMU Data Science Review: Vol. 2 : No. 1 , Article 6.
Leveraging Natural Language Processing Applications and
Microblogging Platform for Increased Transparency in Crisis
Areas
Ernesto Carrera1, Johnson Ekedum1, Austin Hancock1, Ben Brock2 1 Southern Methodist University,
2 Wells Fargo
{ecarreraruvalcaba, jekedum, hancockma}@smu.edu, [email protected]
Abstract. Through microblogging applications, such as Twitter, people actively document their lives even in times of natural disasters such as hurricanes and earthquakes. While first responders and crisis-teams can help people who call 911, or arrive at a designated shelter, there are vast amounts of information being exchanged online via Twitter that provide real-time, location-based alerts that are going unnoticed. To effectively use this information, the tweets must be verified for authenticity and categorized to ensure that the proper authorities can be alerted. In this paper, we create a Crisis Message Corpus from geotagged tweets occurring during 7 hurricanes in the United States. Using this annotated corpus, we train a machine learning classifier to identify requests for help in real time. Through a deep learning model, we remove tweets that are below our classification confidence threshold of 98%. Using this model in conjunction with a front-end dashboard can allow service teams in crisis areas to be notified of alert-tweets without having to sift through hundreds of non-relevant tweets.
1 Introduction
The deadliest U.S. hurricane in recent history was Hurricane Sandy in 2012. Out of the 147 deaths that occurred during the storm, at least 87 were caused by indirect events such as; hypothermia from power outages, electrocution from downed power lines, and car accidents [1]. During crisis
situations, these types of “indirect” events may not be reported in the form of a 911 call leaving first-responders, relief workers, and others within the disaster area unaware of the danger. However, these are just the types of events that citizens may be noticing and discussing via social media platforms.
Given the advent of new technologies, our ability to communicate with one another has evolved drastically. No longer are we solely reliant on conventional media outlets such as newspapers, radio, and TV to disseminate and ingest information. The development of smartphone technologies has made it possible for us to deliver or receive information within milliseconds. Mainstream social
Twitter, as a major social media technology platform, is often used to spread news and updates around the world. Because of its multidirectional network communication effect and global usage, it could serve as a vital resource for situational awareness in times of disaster and crisis. However, leveraging it under time-critical situations is no easy task. With roughly 350,000 tweets sent per minute around the globe [3], manual analysis is not a tenable approach for this data.
The process to make sense of these messy social media data to aid disaster and crisis management involves solving many data challenges including parsing unstructured data, filtering out irrelevant and noisy content, and handling information overload through the implementation of robust scalable storage and data-processing infrastructure. Recent advances in machine learning and artificial intelligence have made it possible for researchers and scientists to access and analyze new and bigger data sources than ever before. By combining artificial intelligence and machine learning with technologies like natural language processing we are able to uncover hidden insights from the massive amount of unstructured data.
The scope of this paper falls in the new field referred to as "Crisis Informatics." The term was coined by Christine Hagar, in a paper presented in 2006 entitled “Using research to aid the design of a crisis information management course.” Crisis informatics is broadly defined as the
interconnectedness of people, organizations, information, and technology during crises/disasters. Crisis informatics examines the intersecting trajectories of social, technical and information perspectives during the full life cycle of a crisis: preparation, response, and recovery. It is a growing field of inquiry and requires integrative and collaborative efforts from many disciplines in order to achieve effective and efficient crisis/ disaster preparedness and response [4].
Stowe et al. [5] suggested an annotation schema of the data generated in Twitter before, during, and after Hurricane Sandy. The first annotation was to determine if the tweet was relevant to the natural disaster as the first filter from all the tweets generated during the crisis, then the relevant tweets were manually categorized into seven categories. Three people trained by domain experts classified the tweets. The categories defined were: Reporting, Sentiment, Information, Action, Preparation, Movement. While this is helpful to understand human behavior during the crisis, it does not provide specific insights into the type of help that people need. Our work aims to predict what critical resources are required during the crisis and serves as a guide to the humanitarian organizations in this matter.
Imran et al. [6] also proposed annotations to tweets during the natural disaster events. They created a corpus in which the annotations were made by Stand-By-Task-Force using an application called MicroMappers. The tweets were normalized to address, typos, single and multi-word abbreviations, phonetic substitutions, and words without spaces. They also created a language model to solve the problem of Out of Vocabulary (OOV) words in the dataset using Bayes Theorem. The data used to train the language model comes from the Wiktionary, the British National Corpus, and the Spell Checker Oriented Word Lists (SCOWL).
Researchers have also focused on the evacuation responses of residents in the areas that it is prone to natural disasters. Martin et al. [7] leveraged geotagged tweets to measure compliance with evacuation orders. Data used in this study came from tweets generated before, and after the hurricane Matthew that impacted the Southeastern coast of the United States.
More specifically, this study analyzed three South Carolina conglomerates and tracked how many Twitter users evacuated, their evacuation destination and return date. This helped authorities to deploy efforts in areas with a low percentage of people displaced.
A novel approach in the incorporation of geotagged data extracted from social media was implemented by Aulov et al. In their research, social media data is used as physical observations to adjust the parameters in the General NOAA Operational Modeling Environment (GNOME). GNOME is the NOAA forecast model that implements an oil spill trajectory prediction [8]. The framework was tested in the Gulf Spill oil caused by BP in 2010. The latitude and longitude are extracted from the images posted on Flickr with the query "BP oil spill", and filtering information related to protests of BP or other events not related directly to the location of the spill. This gave them the ability to generate a series of maps with the sightings of oil at different times and outlined a method to calibrate the parameters of the model such as rates of the oil spill, the diffusion coefficient, and other model parameters.
During times of natural disasters, such as hurricanes, it is difficult to know where help is needed and what type of help is required. Using geo-tagged tweets from cities effected by Hurricane Michael, we build an annotated corpus to categorize tweets by the type of information being discussed. We then pass this data into our natural language classifier to build real-time probability projections of at-risk areas.
In Section 2 we discuss how natural language processing methods can be used to understand text. In Section 3 we outline the data that we use for our Crisis Message corpus, as well as our collection parameters. In Section 4 we define our approach for the construction of our complete data pipeline and discuss the methods involved. Section 5 contains the results of our findings. In Section 6 we discuss the ethical implications that a process such as ours entails. Section 7 presents our conclusions for the paper.
2
Natural Language Processing
Natural language processing, often abbreviated to as NLP, is the ability of a computer to comprehend human language. It sits at the intersection of Computer Science, Linguistics and Machine Learning.
The field of NLP has benefited immensely from the recent innovations in Machine Learning, particularly from Deep Learning techniques. Its further divided into Speech Recognition, Natural Language Understanding and Natural Language generation.
In this paper we examine existing NLP methods for social media applications that’s directed
towards extracting useful information from social media platform. This includes applications such geo-location detection, sentiment analysis, entity and topic detection, text summarization and word vector representation.
2.1 Geo-location Detection
The identification of geo-location information is one of the important topics in semantic analysis. Geo-location could be a region, city or point represented as longitude and latitude. Automatic detection of event location in times of crisis situations such as hurricane is important for timely response and safety measures
We could easily obtain geo-location from the user profiles of people who have subscribed on the social network service, however due to privacy reasons, not all users will provide a precise information about their location. Therefore, other methods like deducing the location from the communication network or from the content of a text could be used.
2.2 Sentiment Analysis
Opinion mining, which is also known as sentiment analysis, aims to determine the attitude of a speaker, writer, or text information with respect to some topic or the overall contextual polarity or emotional reaction to a document, interaction, or event. It is often used to categorize into three levels, document level, sentence level, and entity level
• Document level: The goal is to determine the overall sentiment of an entire document. This level looks at the document as a single entity.
• Sentence level: the goal at this level of analysis is limited to the sentences and their expressed opinions. Within this level, we are able to determines whether a sentence expresses a positive, negative or neutral opinion.
• For Entity-level: Within this level, a sentiment scope within which each named entity is embedded, this predominantly decides the sentiment information associated with the entity Using sentiment analysis our focus is on recognizing emotional sentences in tweet based on polarity: positive and negative. We find that extracting sentiments during a disaster may help emergency responders develop stronger situational awareness of the affected areas. Such information can also be used to help assess the extent of the devastation and find people who are in specific need during an emergency situation
2.3 Event / Entity Extraction
This is a type of section of NLP that works on extracting the specific knowledge of certain incidents from texts. It is very important in social media context because people tend to post many messages about trending events, and many users read those comments in order to locate the information they need.
After extracting tweets, we use a bag of words approach and query the Twitter with manually selected keywords frequently appearing in flood emergency posts, Accident, flood, power outage, collapse etc. In addition, we limit the potential geographic scope of event to the geographical area of interest.
Event/ Entity detection in Twitter and other social media can be used for emergency situation awareness like hurricane, events can be detected and classified by key entities and then updates on the situation can be processed in order provide help where it’s needed.
2.4 Text Summarization
Automatic text summarization is a part of natural language processing. It is often used to find a subset of data which contains the "information" of the entire set. Such techniques are widely used in industry today. Micro-blogging platforms such as Twitter generate massive volume of data for most real-world events on a daily basis. Sifting through the noise and redundancy to understand the important aspects of a tweet is a very challenging task.
Text summarization can aid to extract relevant key information in a tweet, providing a concise summary of an event.
2.5 Word Vector Representation
Word vectors representations are widely used in Natural Language Processing applications. Vectors are convenient since we can use the concept of distance between vectors to find similarities between words. In this paper, we explore word2vec distributed representations of words. Word2vec proposes two architectures: Continuous Bag of Words Model (CBOW) and Continuous Skip-gram Model. The former aims to predict the current word based on the context and the later predicts surrounding words given the current word[9].
3 Data
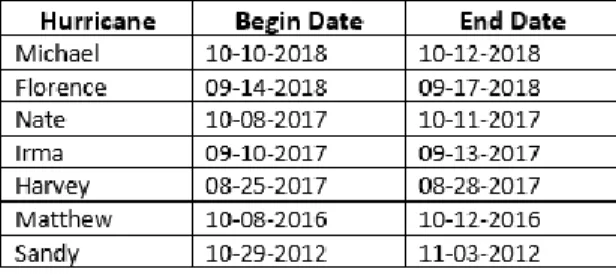
The data that we use contains geotagged tweets for 7 hurricanes that made landfall in the United States. The historical Twitter information that is available to query through the platform’s search
control is dependent upon four parameters: latitude/longitude geocode, search radius, begin data, and end date.
Unlike the approach taken by prior research which identified tweets pertaining to a natural
disaster by using a tweet’s “hashtag” [6,10], which will return any tweet that contains the hashtag regardless of location, our approach will search tweets based on the location from which the tweet was sent. By using the location of a tweet, rather than merely a keyword search, our query will only return tweets that originated from within the area of the disaster itself. This is key when the objective is to create a corpus containing tweets identifying hazards and requesting the aid of first responders or from relief organizations. In order to produce an accurate location, we first determine the path of the hurricane and identify the cities which fall within this path. We then pass these individual search coordinates into the Twitter search control, along with a radius of 15 miles, to create an overlapping search pattern across each city, as shown in Figure 2. While this will cause some overlap between cities, any duplicate tweets can easily be filtered out. The major benefit of this approach is time saved by restricting our search to only cities within the path of the hurricane as well as only identifying cities from which a user was tweeting. If a search zone does not contain any geotagged tweets, nothing is returned for that area.
Fig. 2. Twitter search zones overlaid onto path of Hurricane Michael. The grey and yellow shadings on the map indicate the width of the hurricane in terms of hurricane force. The direct path of the hurricane is shown with a red and yellow line, indicating the hurricane category at that point in time (red for category 3, yellow for category 1). The red circles represent the search radiuses passed to the Twitter API.
To collect only tweets that were sent during the time that each hurricane was active over the United States, we need to pass to the Twitter search control the parameters “since” and “until” as the “begin” and “end” date search criteria. Using these search criteria allows us to focus only on tweets which were happening during the crisis. We use the dates that each hurricane made initial landfall up until the hurricane was downgraded to a tropical storm or until the hurricane was no longer over the United States with some additional days added to account for tweets which request help in the days after a hurricane has passed over a city.
Table 1. Hurricanes and dates used to query Twitter API.
Using these cities and dates, we created an array in python to pass the searches to the Twitter API in the correct format for each hurricane. These queries resulted in approximately 5,000 tweets which were then extracted to excel. Once extracted, we manually labeled each tweet into one of 11 categories which we use to bin tweets by content. The categories we use to bin each tweet include; Alert: Down Trees, Alert: Flooding, Alert: Misc., Alert: Power Outage, Alert: Road Closure, Alert: Structural Damage, News, Personal, Request, Supply Center, Update: Power On. We created these specific categories to properly allocate the incoming tweets into a context that is beneficial to a crisis management worker whose tasked with identifying tweets which provide information on public needs and dangers while filtering out tweets which require no action on the part of first responders or the crisis management team.
Fig. 3. Number of tweets by type.
The category imbalance as seen in Figure 3 is very apparent. This type of imbalance is to be expected when working with social media platforms since people naturally use it as a medium of self-expression and general communication rather than specifically as a means of notifying crisis-teams during a disaster. Our approach is designed to read in these ‘Personal’ tweets, determine that they are not alerts that need to be addressed, and ignore them.
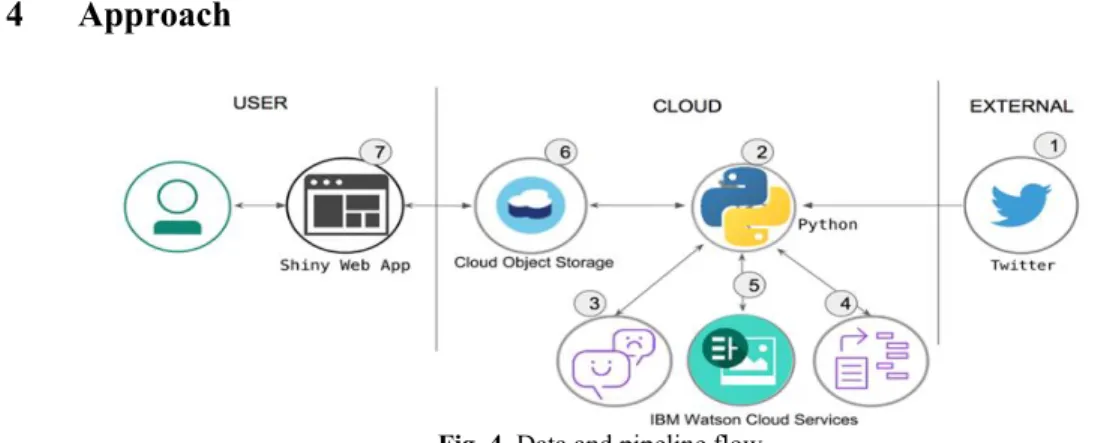
4 Approach
Fig. 4. Data and pipeline flow
4.1 Data Ingestion
API is an abbreviation for “Application Programming Interface”. This is a way for software to
access the Twitter platform. It supports a large number of functions for interacting with Twitter, specifically for acquiring a Twitter dataset which includes retrieving, searching and filtering tweets. A number of tools already exist to help interact with Twitter API; these tools may vary in capabilities
but what these tools share in common is that they all use Twitter’s public API. However, the Twitter public API has a number of limitations one of which is the ability access to historical tweets. This is very limited in the sense that we’re only able to search and retrieve tweets within the last 7 -9 days of a user’s timeline.
In order to overcome this challenge, we used the Selenium package. Selenium is a web browser automation tool. Its primarily used for automating web applications for testing purposes, however, its functionalities go beyond automation. It could also be used to interact with the browser, acting as a web scraper which allows us to process the HTML of a Web Page to extract data within tags and elements in a page. Using Selenium, we were able to communicate with the search element within Twitter, passing in search query criteria to pull down relevant historical tweets across geographical location on interest.
Once we had the tweets pulled in, we next needed to classify them. To do this, we read each tweet and manually assigned it to one of our 11 categories; Alert: Down Trees, Alert: Flooding, Alert: Misc., Alert: Power Outage, Alert: Road Closure, Alert: Structural Damage, News, Personal, Request, Supply Center, and Update: Power On.
important that we do a cleanup exercise and take only the information which is important to the problem asked, knowing that the results and output of our machine learning model are only as good as what we put into it.
We used a number of preprocessing techniques such as escaping HTML characters, decoding data, removal of stop words, expressions, special characters. Afterwards We manually annotate our data into different buckets based on nature of tweet.
4.3 IBM Cloud Services
Once we have collected, cleaned and stored relevant tweets, we focus on enriching the data by using Watson Developer Cloud services in steps 3, 4, and 5 of our pipeline. We annotated tweets using Watson knowledge studio, classified images within tweets using Watson image recognition and extracted sentiments, topics, keywords and entities within text using Watson Natural language understanding. Using IBM’s natural language classifier model, which includes multiple Support Vector Machines (SVMs) and a Convolutional Neural Network (CNNs), we were able to train our preprocessed data. Accuracy is determined using a series of real time tweets to test the validity of the model.
4.4 Cloud Object Storage
In step 6 we securely move our processed data into cloud object storage. Data is stored, encrypted and dispersed across multiple geographic locations. This data can be accessed over HTTP using a REST API.
4.5 Shiny Web App
The final step of our pipeline is our front-end dashboard. This dashboard, built using R Shiny, allows the user to see all classified tweets mapped by their GPS coordinates. As can be seen in Figure 5,
the application color codes each tweet marker by our model’s predicted classification allowing the
Fig. 5. R Shiny dashboard of classified tweets during Hurricane Sandy.
5 Results
With the primary goal of this work being to create a manageable set of alert tweets that will be passed to a disaster response team, IBM’s Deep Learning-as-a-Service (DLaaS) model performs the better of our two approaches. Below, we analyze why that is.
In our first approach, we were attempting to use ‘Personal’ as a category a tweet could be in. While it is easy to manually read a tweet and classify it as ‘Personal’, it is much more difficult to
have a machine learning model come to the same conclusion. This approach was attempting to find a common structure within each tweet category by using the tf-idf vectors, which for categories with a common theme, works very well. However, due to the inherent randomness that such a large
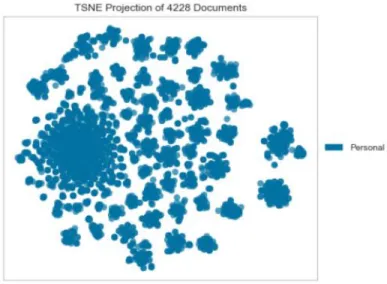
category as ‘Personal’ contains, this method was creating a structure when none exists. Figure 6 displays the t-distributed stochastic neighbor embedding (t-SNE), of all ‘Personal’ tweets. This
technique reveals similarities between tweets of the same class. From this figure, you can see that the tweets within this category simply do not have a single strong commonality.
Fig. 6. t-SNE corpus visualization of ‘Personal’ tweets.
What Figure 6 highlights is that while there is not a single shared structure within this category, there are smaller clusters. This is a strong indicator that we needed a different approach to handle these more general tweets. These smaller groupings were taking over the category and applying their structure to the classifier. This, combined with the large class imbalance, caused our model to misidentify many of our alert categories as personal. To combat this, it was necessary to not use
‘Personal’ as a category, but rather to identify anything that does not belong in one of the other classes as ‘Personal’. This is an important distinction which is explored further in the analysis of our deep learning model.
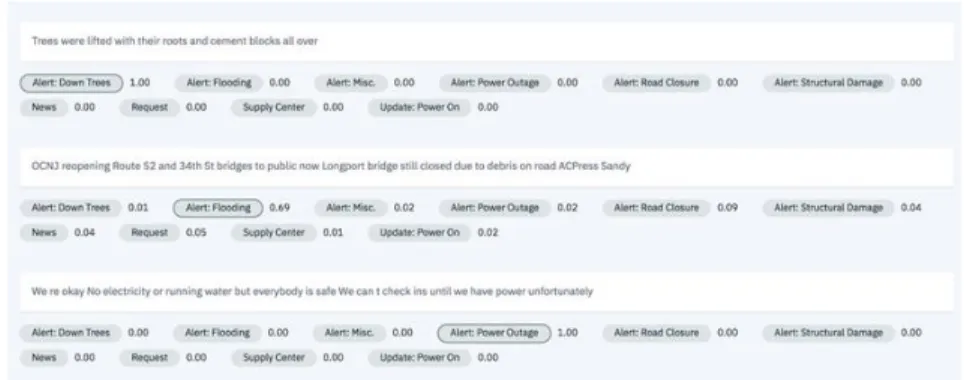
The deep learning model was created to address the classification of ‘Personal’ tweets. Rather than take the approach of treating ‘Personal’ as a structure within tweets that needed to be identified, we treated it as a catchall that tweets would fall into if they were not strongly associated with one of our other classes. We did this by training a new model on all categories except for personal.
This new model was then used to create confidence predictions on what class a tweet would belong to (Figure 7). By taking this approach, we could say that if a tweet has a confidence value for a given category at a certain threshold then assign that tweet to the category, otherwise consider
the tweet ‘Personal’. Taking this approach, we set the confidence threshold to be 98% and produced
our final model. While this value may seem high, the primary goal of the model is to sift through thousands of tweets and only return tweets which need to be addressed by crisis-teams. Keeping a highly-selective threshold in place is more efficient than allowing a large number of ‘Personal’
tweets to overwhelm the output, especially since this method is meant to supplement, rather than replace, traditional means of requesting assistance during natural disasters. This final model produced a precision score of 93% and a recall score of 91% (Figure 8).
6 Ethics
In this section, we evaluate the potential ethical issues that could arise derived from the work presented in this paper and a proposal on how to mitigate them. For that purpose, we frame the assessment using the ACM Code of Ethics [11]. The primary items in the code for potential violation are: 1.4 Be fair and take action not to discriminate and 1.6 Respect of Privacy.
The first aspect that the ACM code of ethics outlines with regards respect of privacy is that a computing professional should become conversant in the various definitions and forms of privacy and should understand the rights and responsibilities associated with the collection and use of personal information [11]. The data used in the analysis comes from Social Media Websites (SMWs), and for that reason, we reviewed the terms and conditions of the two SMWs leveraged (Twitter and Instagram). Twitter places special attention not to share information with any public sector entity (or any entities providing services to such entities) for surveillance purposes, including but not limited to: investigating or tracking Twitter's users or their Twitter Content; and, tracking, alerting, or other monitoring of sensitive events (including but not limited to protests, rallies, or community organizing meetings) [12]. Because of this term, the idea of sharing the corpus for additional research purposes with public entities that are in charge of providing safety during natural disasters such as Federal Emergency Management Agency (FEMA) or Department of Public Safety it is not possible. However, we are allowed to provide these agencies with the model generated in this paper for its implementation.
The other derivative concerning respecting privacy that the ACM establishes is the minimum amount of personal information necessary to be collected, in the preparation of the data for analysis, we eliminated the names and Twitter IDs to avoid the risk of identification of the users.
The principle 1.4 of the ACM "Be fair and take action not to discriminate" says that the use of information and technology may cause new, or enhance existing, inequities. There are on-going discussions regarding the population bias that exhibit the use of SMWs data given that different demographic groups may participate in social media platforms at different rates [13]. Several studies have identified significant biases along gender, age, race, income, education, and urban/rural lines [13]. Therefore, the model may not be representing the needs of unrepresented groups during natural disasters. The potential users of the model will have to rely on additional resources to identify the needs of the whole population. Thus, the model serves only as a component of the entire strategy of the crisis' management.
7 Conclusions
The results of the deep learning model offer an immediately applicable method of identifying tweets of interest for crisis-teams during hurricanes. While some ‘Alert’ tweets will be filtered out of the model, the greater number that are identified will still help in saving lives in natural disaster zones. As more data is gathered from other events, the model will continue to get better at identifying these alert messages sent from those in need. With less than ¼ of the tweets in this dataset being non-Personal, our data faced a class imbalance that was difficult from the start. While we were able
to build a model that worked around this imbalance, getting more ‘Alert’ tweets from future
hurricanes will help the model get better at identifying this type of tweet structure.
Tweet categories sometimes share a lot of the same words, even though they are categorized into
different groups. For example, the categories ‘Alert: Power Outage’ and ‘Update: Power On’, both commonly contain the words ‘power’ and ‘lights’ even though they are not the same category. These
types of overlapping categories are common. One way to approach getting better prediction accuracies in situations like this would be to add sentiment analysis to the model. For instance,
‘Alert: Power Outage’ tends to include highly negatively scored words while ‘Update: Power On’
tweets tend to have a very positive tone. By adding in a sentiment layer to our model, it may be possible to separate these tweet categories more effectively.
Another problem that can occur is a ‘Personal’ tweet being misidentified as an ‘Alert’. This could
happen when a tweet is talking about other people experiencing an alert, but the Twitter user is not personally experiencing that event. For example, many people would tweet that their prayers were with those who had lost power. Manual annotation looks at this and can see that this is not someone who needs help, while a text-based algorithm sees ‘lost power’ and assigns a category. Like the problem with sentiment style tweets, more data is needed along with an in-depth sentence structure analysis to include a layer to handle these types of instances.
The results of the observational study presented in this paper are only applicable to information generated from Twitter in the English language during hurricanes taking place in the United States of America. For that reason, we would like to extend this work in several aspects. The first element is to include information from additional SMWs. Secondly, gather historical posts from other countries that speak English, and which also experience hurricanes strikes (e.g., Australia). These two aspects will help us to have a more robust corpus and expand the results to other geographies in the event of hurricanes. A third item for expanding this paper is to gather data from non-English speaking countries.
The fourth inclusion to the frameworks is to determine if the emojis in the post constitutes an element that can increase the prediction of the model. Lastly, Facebook, Watson, and Google provide tools for image recognition, we added that information to our dataset, but we did not include it as part of the features analyzed in the model. Therefore, we could also probe how the pictures attached to the posts in the social media websites can be leveraged to either enhance the performance of the model or as a way of validating that text corresponds to an "Alert" category.
Given the enhancement of the predictions produced by using deep learning models, we would also like to train the data using other architectures offering out-of-the-box models such as Caffe, Torch, and TensorFlow to compare them and select the one with better performance metrics.
References
1. Blake Eric et al, “Tropical Cyclone Report Hurricane Sandy”, 2012, The National Hurricane Center, https://www.nhc.noaa.gov/data/tcr/AL182012_Sandy.pdf, [Accessed 3 November 2018]
3. “Twitter Usage Statistics”, n.d., [Online]. http://www.internetlivestats.com/twitter-statistics/ , [Accessed 3 November 2018]
4. Hagar, Christine, “Crisis informatics”, Journal of Geography and Natural Disasters, 2014,
https://www.omicsonline.org/open-access/crisis-informatics-2167-0587.1000e115.php?aid=24638 [Accessed 10 October 2018]
5. Stowe Kevin, Paul Michael, Palmer Martha, Palen Leysia, Anderson Ken, Identifying and Categorizing Disaster-Related Tweets, In the Proceedings of the Fourth Int’l Workshop on NLP for Social Media, held
w/ EMNLP, 2016, pp. 1-6
6. Muhammad Imran, Prasenjit Mitra, Carlos Castillo, “Twitter as a Lifeline: Human-annotated Twitter Corpora for NLP of Crisis-related Messages”, Qatar Computing Research Institute (HBKU), 2016 7. Martin Y, Li Zhenlong, Cutter Susan, “Leveraging Twitter to gauge evacuation compliance: spatiotemporal
analysis of Hurricane Matthew”, 2017, https://doi.org/10.1371/journal.pone.0181701 [Accessed 12 October 2018]
8. Aulov Oleg, Halem Milton, “Human Sensor Networks for Improved Modeling of Natural Disasters”
Proceedings of the IEEE. Vol.100. No. 10, 2012
9. Mikolov Thomas, Chen Kai, Corrado Greg, Dean Jefrey, “Efficient Estimation of Word Representations in Vector Space”, ICLR Workshop, 2013.
10. Muhammad Imran, Shady Elbassuoni, Carlos Castillo, Fernando Diaz, and Patrick Meier, “Practical Extraction of Disaster-Relevant Information from Social Media”, Proceedings of the 22nd international conference on World Wide Web companion, 2013
11. Gotterbarn, Don, Brinkman, Bo, Flick, Catherine, Kirkpatrick, Michael S., Miller, Keith,
Varansky, Kate, Wolf, Marty J., “ACM Code of Ethics and Professional Conduct.” Association for Computing Machinery, 2018, [Online] https://www.acm.org/code-of-ethics [Accessed 27 Jan 2019] 12. Twitter’s Developer Agreement and Policy,
https://developer.twitter.com/en/developer-terms/agreement-and-policy.html [Accessed 27 Jan 2019]
13. Johnson Isaac, McMahon Connor, Schöning Johannes, Hecht Brent, “The Effect of Population and
“Structural” Biases on Social Media-based Algorithms – A case study in Geolocation Inference Across the Urban-Rural Spectrum”, 2017, http://dx.doi.org/10.1145/3025453.3026015 [Accessed 28 Jan 2019]
![Fig. 1. Word2vec model representation [9]](https://thumb-us.123doks.com/thumbv2/123dok_us/10182579.2920741/6.918.258.659.689.836/fig-word-vec-model-representation.webp)