Harrisburg University of Science and Technology
Digital Commons at Harrisburg University
Other Student Works
Analytics, Graduate (ANMS)
2017
Strategies for using data analytics in testing the
readability levels of textbooks: It’s time to get
serious
Emily Wefelmeyer
Mary Beth Backus
Follow this and additional works at:
https://digitalcommons.harrisburgu.edu/anms_student-coursework
Part of the
Analysis Commons
, and the
Educational Assessment, Evaluation, and Research
Commons
ScienceDirect
Available online at www.sciencedirect.com
Procedia Computer Science 118 (2017) 95–99
1877-0509 © 2017 The Authors. Published by Elsevier B.V.
Peer-review under responsibility of the Organizing Committee of the Data Analytics Summit II 10.1016/j.procs.2017.11.149
10.1016/j.procs.2017.11.149 1877-0509
ScienceDirect
Procedia Computer Science 00 (2017) 000–000
www.elsevier.com/locate/procedia
1877-0509 © 2017 The Authors. Published by Elsevier B.V.
Peer-review under responsibility of the Organizing Committee of the Data Analytics Summit II.
Data Analytics Summit II; Structuring the UNSTRUCTURED: The Missing Element of
Analytics, 14-16 December 2015, Harrisburg, USA
Data Analytics Summit II
Strategies for using data analytics in testing the readability
levels of textbooks: it’s time to get serious
Emily Wefelmeyer & Mary Beth Backus
b*
Harrisburg University, 326 Market Street Harrisburg, PA 17101bUniversity of Maryland University College Upper Marlboro, MD 20774.
Abstract
The idea that education in America is deteriorating is emotionally charged and controversial. While there is no disputing that education levels in the United States continue to rise, there is also a pervasive notion that this was accomplished by gradually reducing the readability level and general difficulty of textbooks. One tool often employed in the defense of education is the employment of readability indices in the evaluation of textbooks. There are a variety of these readability indices that serve the purpose of indicating a grade level for a particular piece of writing (Kinkaid,
et. al., 1975). It’s relatively easy to find dozens of sites where a teacher or interested person can submit text or a URL
with the purpose of finding out the reading level expressed as a grade level for a particular piece of text. Most sites report on five different indices: Automated Readability Index, Flesch Reading Ease, Flesch-Kinkaid Score, Gunning-Fogg Index, and SMOG Index (Simplified Measure of Gobbledygook). This paper addresses these indices, their applications, and the drawbacks of their use..
© 2017 The Authors. Published by Elsevier B.V.
Peer-review under responsibility of the Organizing Committee of the Data Analytics Summit II.
Keywords: correlation, education, readability indicies, textbooksIntroduction
Since the late 1960s, Noam Chomsky, probably the world’s most famous linguist, has maintained there is an innate component to
96 Mary Beth Backus et al. / Procedia Computer Science 118 (2017) 95–99
2 Author name / Procedia Computer Science 00 (2017) 000–000
Introduction
The idea that education in America is deteriorating is emotionally charged and controversial. Anyone with just a passing daily exposure to national news cannot avoid hearing about issues raised with respect to educational funding, teachers´ unions, novel approaches to education, and even about the content of curriculum, i.e., school textbooks. While there is no disputing that education levels in the United States continue to rise, there is also a pervasive notion that this was accomplished, in part, by gradually reducing the readability level and general difficulty of textbooks. At the high school level, literacy is a large focus since over half of students graduating from high school are required to complete remedial coursework upon beginning a 2- or 4-year college or university program [1]. A simple search of the terms “dumbing down” and “education” on Amazon turns up dozens of
books on the subject. And that’s just one way to express this idea. There are, literally hundreds of books on the subject of
educational deterioration in our country. Moreover, this is not a recent idea. We found an article on the subject in the LA Times from 22 years ago [2]. There is little doubt that we could find several more such articles stretching decades back in time. Adding energy to this discussion is the fact that it is now become common knowledge that the cost of higher education has been accelerating exponentially over the last 25 years [3]. Such awareness has brought about a shift in perception over the same time. Twenty-five years ago parents were satisfied when their children could even gain entry into reputable colleges and universities so
that they were in a position to have the opportunity to enter the ranks of the “college educated”. Today, however, parents and
students alike are often viewing themselves as consumers where they repeatedly asked the question, “What exactly are we getting for our money here?” [4] And now, as we enter into a cycle of presidential campaigns, more than one candidate is echoing the
sentiment.
How can educators even begin to defend themselves against such attacks? In the past decade, we have seen an intensification of several strategies. One such strategy has been to change the goals and techniques of higher education. Today it is not
uncommon to hear educators talking about competency-based education and interdisciplinary approaches to learning. Also, the terms experiential learning and assessment have found their way into almost every discussion of education along with the ideas about how we might increase standardization. There is no doubt about it, education today is under attack and as a result finds itself in a state of intense self-evaluation.
One tool often employed in the defense of education is the employment of readability indices in the evaluation of textbooks. There are a variety of these readability indices that serve the purpose of indicating a grade level for a particular piece of writing
[5]. It’s relatively easy to find dozens of sites where a teacher or interested person can submit text or a URL with the purpose of
finding out the reading level expressed as a grade level for a particular piece of text. Most sites report on five different indices. The different techniques are calculated using a variety of components ranging from word and sentence length to a calculation of percentage of words with higher syllable counts. Educators do not hesitate to reference these readability measures when
defending the current state of American education.
Educational researcher Dr. Freddy Hiebert answers the charge that textbooks have been dumbed down over the last fifty years in
“Have the texts of beginning reading been dumbed down over the past 50 years?” [6]. Using readability indeices, she concludes that
textbooks used in early elementary school are in fact more difficult than they were twenty years ago. The normal practice for employing these readability indices is to have a site generate the five primary readability indices and to report on the average of those measures.
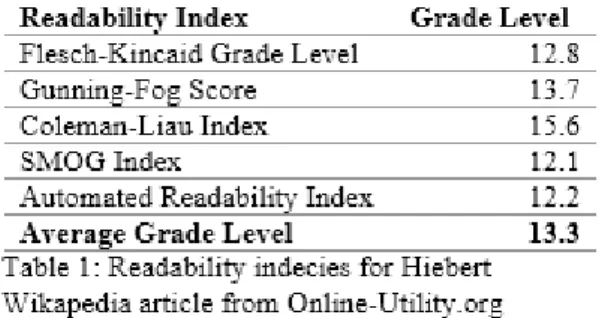
Table 1 contains the five primary readability measures along with an average grade level reported for this text as reported from the website. This particular article comes out at the thirteenth grade level, i.e., college freshman, which makes sense.
Nonetheless, it is interesting to note that the range of grade levels reported from the different measures is 3.5 years, which is in effect saying that the writing in this article is somewhere between that of a first month high school senior and a second semester college junior.
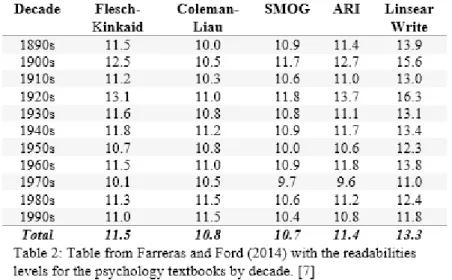
Apparently, calculating readability levels is not an exact science. While this level of variability is somewhat unexpected, it has been documented before. In their 2014 investigation of sixty-six textbooks used over the last century reported at Cheiron,
Farreras and Ford, calculated the readability indices for the textbooks and their study (Table 2). They reported, “As a result, we
can conclude little from these results beyond the fact that the validity of the reported grade levels of commonly used readability
Introduction
The idea that education in America is deteriorating is emotionally charged and controversial. Anyone with just a passing daily exposure to national news cannot avoid hearing about issues raised with respect to educational funding, teachers´ unions, novel approaches to education, and even about the content of curriculum, i.e., school textbooks. While there is no disputing that education levels in the United States continue to rise, there is also a pervasive notion that this was accomplished, in part, by gradually reducing the readability level and general difficulty of textbooks. At the high school level, literacy is a large focus since over half of students graduating from high school are required to complete remedial coursework upon beginning a 2- or 4-year college or university program [1]. A simple search of the terms “dumbing down” and “education” on Amazon turns up dozens of
books on the subject. And that’s just one way to express this idea. There are, literally hundreds of books on the subject of
educational deterioration in our country. Moreover, this is not a recent idea. We found an article on the subject in the LA Times from 22 years ago [2]. There is little doubt that we could find several more such articles stretching decades back in time. Adding energy to this discussion is the fact that it is now become common knowledge that the cost of higher education has been accelerating exponentially over the last 25 years [3]. Such awareness has brought about a shift in perception over the same time. Twenty-five years ago parents were satisfied when their children could even gain entry into reputable colleges and universities so
that they were in a position to have the opportunity to enter the ranks of the “college educated”. Today, however, parents and
students alike are often viewing themselves as consumers where they repeatedly asked the question, “What exactly are we getting for our money here?” [4] And now, as we enter into a cycle of presidential campaigns, more than one candidate is echoing the
sentiment.
How can educators even begin to defend themselves against such attacks? In the past decade, we have seen an intensification of several strategies. One such strategy has been to change the goals and techniques of higher education. Today it is not
uncommon to hear educators talking about competency-based education and interdisciplinary approaches to learning. Also, the terms experiential learning and assessment have found their way into almost every discussion of education along with the ideas about how we might increase standardization. There is no doubt about it, education today is under attack and as a result finds itself in a state of intense self-evaluation.
One tool often employed in the defense of education is the employment of readability indices in the evaluation of textbooks. There are a variety of these readability indices that serve the purpose of indicating a grade level for a particular piece of writing
[5]. It’s relatively easy to find dozens of sites where a teacher or interested person can submit text or a URL with the purpose of
finding out the reading level expressed as a grade level for a particular piece of text. Most sites report on five different indices. The different techniques are calculated using a variety of components ranging from word and sentence length to a calculation of percentage of words with higher syllable counts. Educators do not hesitate to reference these readability measures when
defending the current state of American education.
Educational researcher Dr. Freddy Hiebert answers the charge that textbooks have been dumbed down over the last fifty years in
“Have the texts of beginning reading been dumbed down over the past 50 years?” [6]. Using readability indeices, she concludes that
textbooks used in early elementary school are in fact more difficult than they were twenty years ago. The normal practice for employing these readability indices is to have a site generate the five primary readability indices and to report on the average of those measures.
Table 1 contains the five primary readability measures along with an average grade level reported for this text as reported from the website. This particular article comes out at the thirteenth grade level, i.e., college freshman, which makes sense.
Nonetheless, it is interesting to note that the range of grade levels reported from the different measures is 3.5 years, which is in effect saying that the writing in this article is somewhere between that of a first month high school senior and a second semester college junior.
Apparently, calculating readability levels is not an exact science. While this level of variability is somewhat unexpected, it has been documented before. In their 2014 investigation of sixty-six textbooks used over the last century reported at Cheiron,
Farreras and Ford, calculated the readability indices for the textbooks and their study (Table 2). They reported, “As a result, we
can conclude little from these results beyond the fact that the validity of the reported grade levels of commonly used readability
indices is questionable.” [7]
However, for that study the authors did not run their analyses on the full length of the textbooks investigated in that research but rather took samples and ran them through the readability analyses. This led to the question of if the measures they reported may have been a bit more consistent and might have resulted in more reliable results between measures had they in fact processed all of the textbooks in their analyses
In 2015, Ford and Farreras reported in another study that they had in fact found a marked decrease in the use of complex prepositional phrases across the decades represented by their textbooks. This led to further questioning the consistency of the measures from different sites. The authors reported a pretty dramatic decrease in the use of complex prepositional phrases, a decrease in adjectives and adverbs, and a decrease in the use of personal pronouns. The authors concluded that all of these measures indicated that the sentence the complexity was moving to a simpler form over the course of time [8].
This decrease in sentence complexity certainly was not indicated in the readability indices they reported for their textbooks in the earlier study. This brought into question those results. On the surface, one of two explanations seem plausible. Either the amount of text that they process through those indices was not sufficient to give a proper result or the readability indices themselves are not reliable.
The purpose of this study was to revisit the readability issue broached by Farreras and Ford in their analysis of their sixty-six textbooks written over eleven decades. An online readability service, Online-Utility.org (https://www.online-utility.org/english/readability_test_and_
improve.jsp), that could process the total text from their files were found their analysis was rerun using the complete texts. Moreover, a second online resource, CheckText.org (http://www.checktext.org/), was found that also reported on readability indices for total text and the complete texts were run through that site also with the intent of establishing inter-site reliability for the indices.
Method
The sixty-six textbooks used in this study were chosen as the books that were used in the Cheiron, Farreras and Ford paper [7]. The two readily available websites for processing the text in our study were site #1 and site #2. Both of these sites offered the ability to process complete bodies of text without the often seen 500 or so word limit.
In order to process the content of the text files from the sixty-six books, the files were individually copied and pasted into two sites (this operation was repeated 132 times) and then the web services were activated to derive the readability indices. This operation was performed by two different experimenters. Several of the files were spot checked by both experimenters and a third person in order to ensure that the results reported were consistent for those sites.
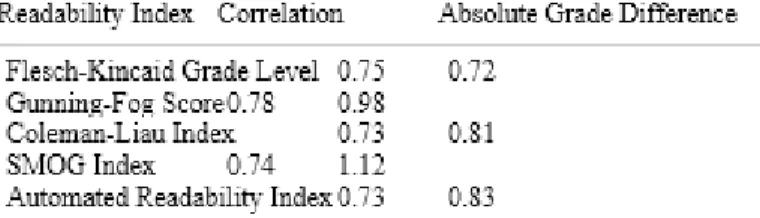
Upon completion of this process there were 660 data points, i.e., for the sixty-six books times the two sites times five different readability indices. The average readability level for each textbook across the five measures for each site, and correlation coefficients between the same index for both sites in addition to correlations between readability indices were calculated. In addition, the absolute values for differences between the same measure on the two different sites were calculated as shown in Table 3.
984 Author name / Procedia Computer Science 00 (2017) 000Mary Beth Backus et al. / Procedia Computer Science 118 (2017) 95–99–000
Table 3: Correlation coeffiecients and absolute grade level differences between the five readability indices for the two websites.
Results
In order to determine that the data from the two sites were reliable the correlation coefficient was calculated. It was expected that the correlation coefficient would be calculated to be about 1.00 since the same data was collected just from two different sites. However, the correlation coefficient for the Flesch-Kincaid index for the two different sites was 0.75. The grade level comparison between the two sites for this index differed by 0.72 years on average. The correlations and grade level differences for the other four measures of readability did not fare much better than that of the Flesch Kincaid index.
Discussion
It was suprising to find that there was not better agreement for the same measure between the sites. Since the files were rather large and the same index was being calculated, that leads to questioning further questioning of why the correlation was so low. Several of the files were rerun through the same sites repeatedly in order to verify the initial data points calculated to ensure the data was accurate. The differences between sites must be related to how the measures were being calculated on each.
It was the intention of this project to procide more reliable results in a readability analysis for textbooks across decades. Instead, it was discovered that the reliable results were unable to be determined even for the same measure on two different sites. At this point in time, it would bear further study to pull in a third site and see if that provides better agreement. Preliminary comparisons have already indicated otherwise since when the different indices for the same site were compared the correlations were quite high. The correlation between the smog and the ARI for one site for example was 0.97. Yet, there were still almost a one year difference between the grade level reported between those two measures. The high correlation in spite of this difference indicates that readability measure between the fog and the ARI was differing on a linear scale and therefore gave an indication of high reliability. This is irrelevant given that the great difference reported between those two measures was off by a year. Moreover, none of the readability indices even came close to giving an indication of the drop in complexity and sentence structure that Ford and Farreras reported in 2015 when they looked at the components of the sentence structure itself. If one looks at how these different indices are calculated there is no direct measure of sentence complexity. The assumption inherent in all of these readability indices is that the differences and readability can be traced back to number of words per sentence and word length, whether calculated via syllables or letters. While there is certainly a correlation, there must be questions as to whether or not the very nature of a readability is determined at the granular level of words versus the construction of sentences. Putting complexity aside for the moment, word familiarilty must also be considered when talking about readability. Is it even possible to have a measure of readability without taking into account the average vocabulary for students in a particular grade level? It seems that much of what is considered in a readability index is wishful thinking. That is to say, it is assumed that long words and long sentences are negatively correlated with readability. Rather than return to the analysis in an attempt to uncover the sources of unreliability between and from within the standard indices of readability, it would more sense to rethink just how we should be going about accomplishing this task.
References
1. The National Center for Public Policy and Higher Education (NCPPHE). (2010). Beyond the rhetoric improving college readiness through coherent state policy. Retrieved from
http://www.highereducation.org/reports/college_readiness/CollegeReadiness.pdf
2. Dumbing Down' of Textbooks. (1988, September 26). Los Angelos Times. Retrieved from http://articles.latimes.com/1988-09-26/local/me-1738_1_textbooks-english-class-teaching 3. Rampell, C. (2012, March 2). Why Tuition Has Skyrocketed at State Schools. Retrieved from
http://economix.blogs.nytimes.com/2012/03/02/why-tuition-has-skyrocketed-at-state-schools/?_r=0
Author name / Procedia Computer Science 00 (2017) 000–000 5
4. Weiner, J. (2014, August 22). Do the benefits of a college education outweigh the cost? Retrieved from https://www.washingtonpost.com/blogs/she-the-people/wp/2014/08/22/do-the-benefits-of-a-college-education-outweigh-the-cost/
5. Kincaid, J., Fishburne Jr, R., Rogers, R., Chissom, B. (1975). Derivation of new readability formulas (automated readability index, fog count and flesch reading ease formula) for navy enlisted personnel. Retrieved from http://www.dtic.mil/cgi-bin/GetTRDoc?AD=ADA006655
6. Hiebert, F. (2010, June 11). Have the texts of beginning reading been dumbed down over the past 50 years? Retrieved from: http://textproject.org/library/frankly-freddy/have-the-texts-of-beginning-reading-been-dumbed-down-over-the-past-50-years/
7. Ford, W. R., & Farreras, I. G. (2014, June). The evolution of a discipline: How the syntax of Introductory Psychology textbooks have changed over the last century. Paper presented at Cheiron 2014, Frederick, MD
8. Ford, W. R., & Farreras, I. G. (2015, March). An analysis of how noun phrases have changed in Introductory Psychology textbooks. Paper presented at the 86th annual meeting of the Eastern Psychological Association, Philadelphia, PA