Basic Systems Engineering concepts
Before we delve into the world of Systems Engineering, we first need to get to know some basic concepts. What is Systems Engineering? What tools does it have? And what is a market?
1
Introduction to Systems Engineering
1.1
What are Systems?
A system is a combination of elements. These elements interact with each other to accomplish an objective. Systems can be very big (like the Apollo Project) or very small (like a USB-stick).
There is also a distinction between closed and open systems. Aclosed systemhas no relationship with the environment at all. On the other hand, a open system does have influence on/gets influenced by the environment.
Finally, we can distinguish systems, based on their behaviour. Deterministic systemsbehave in a fully predictable way. We can always predict what they will do. Stochastic systems, on the other hand, have an element of chance in them. We can only estimate the probability that a certain output will occur. Finally, when dealing withemergent systems, we can not predict anything. Nothing is known about the behaviour of such systems.
1.2
What is Systems Engineering?
InSystems Engineering(SE) we examine how we can make succesful systems. There are a lot of tools that can be used for that. We will examine several in this summary.
Over the past decades, quite some good ideas have come forth from Systems Engineering. Processes like
Parts Traceability(knowing where parts come from) and Formal Interface Control(making sure parts fit together) are all part of the SE toolbox.
1.3
System Hierarchy Diagram
As we just saw, a system consists of elements. These elements often again consist of subsystems. Below these subsystems, we can distinguishassemblies,subassemblies,componentsandparts. The parts are the lowest level of separately identifiable items. There are often also links between elements. These links are calledrelations.
The set of relations between the system, its elements, the subsystems, etcetera, is called the System Hierarchy. This hierarchy is often displayed in aSystem Hierarchy Diagram(SHD). An example System Hierarchy Diagram of a camera can be seen in figure 1.
2
Systems Engineering tools
2.1
The Project Objective Statement
Systems Engineering has several tools, with which systems can be evaluated. The first tool we examine is theProject Objective Statement(POS).
Let’s suppose we’re developing a system. It would be nice to know what this system should do, and how it should do this. This is where the POS comes in. The POS mentions, in about 25 words. . .
Figure 1: A System Hierarchy Diagram for a camera.
• theexpected result.
• theavailable resourcesto reach this result.
• thetime spanin which the result should be reached.
An example POS for the Delfly is: Impress the jury of the first US-European Micro UAV Competition by designing a flapping wing, vision based MAV, using commercially off the shelf products within a budget of 5000 euro, by 11 students in 10 weeks time.
Something similar to the POS is the Mission Need Statement (MNS). The MNS states what the system (product) should do.
2.2
The Work Flow Diagram
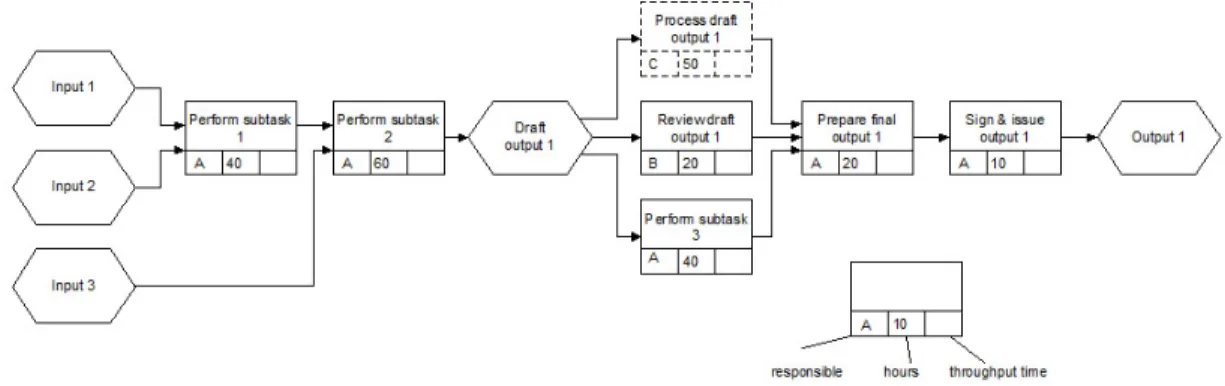
A system usually has a certain input. By using this input, the system should give a certain output. To do this, the system often needs to do quite a lot of things. The steps necessary to get the output can be visualized in aWork Flow Diagram(WFD). A general example of such a diagram can be seen in figure 2.
Figure 2: A general example of a Work Flow Diagram.
In a WFD, we always start with the input, given in hexagonal blocks. The work steps are indicated by rectangle blocks. At every work step, there is an indication of the responsible person, the effort (in hours) necessary to perform the step, and the throughput time. Eventually, we arrive at the output of the system, which is again in an hexagonal block.
2.3
The Work Breakdown Structure
A Work Flow Diagram contains several tasks that need to be done. Sometimes, these tasks require further clarification. They can thus be examined more closely. AWork Breakdown Structure(WBS) is useful for this.
Figure 3: An example of a Work Breakdown Structure.
In a WBS, a task is split up into several ‘sub-tasks’, calledwork packages. Every single work package must be completed, before the actual task is completed. (The WBS is therefore an ‘and’-tree. Only when all sub-tasks have been completed, will the task itself be completed.) An example of a WBS can be seen in figure 3.
3
Examining markets
3.1
What is a market?
Amarketis a place where the demand and the supply of a product come together. This isn’t always a physical place. The internet can be considered a market too.
So how do we describe a market? To do that, we have to look at certain properties. Every market has certain customers. It also has certain products. We could split this up even more. Because every product also has a certainfunctionand a certaintechnologyin it.
Splitting up a market like this is calledmarket segmentation. Every sub-group of the market is called amarket segment. Companies often apply different marketing strategies to different market segments.
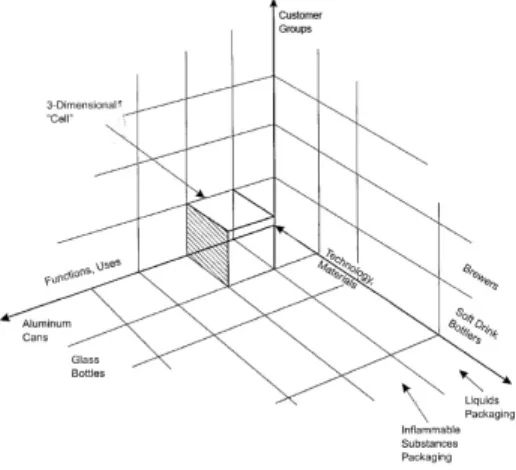
There is a nice method to visualize market segments. It is called the Multidimensional Market Definition(MMD). It consists of a 3D graph. The three axes of this graph indicate the customer, the function, and the technology/material of the product. An example of an MMD (applied for the bottling market) can be seen in figure 4.
Let’s take a closer look at the MMD. The positions in the graph are so-calledcells. Each cell indicates a certain combination of customer, function and technology. A cell, or a combination of cells, thus indicates a market segment.
3.2
The Supply Chain
Products don’t just arrive at the market. They have to be supplied to it. This supplying can be visualized by aSupply Chain. An example of such a Supply Chain can be seen in figure 5.
Figure 5: An example of a Supply Chain.
In a Supply Chain, the steps a product goes through, before it reaches the market, are displayed. First we start at theraw material suppliers. The raw materials are then turned into basic parts bypure manufacturers. These basic parts are eventually assembled, and ready to be supplied to the market.
3.3
Market Analysis
Let’s suppose we know what our market looks like. Now we want to position our product onto the market. To do that in an optimal way, we need to perform aMarket Analysis.
An important tool to perform a market analysis, is theSWOT analysis. We want to give our product a certain position on the market. In a SWOT analysis, we look at the Strengths, the Weaknesses, theOpportunitiesand theThreatscaused by this. If we know these four things, we might be able to improve the position of our product on the market.
There is another way to examine the position of our product in the market. We can also look at the
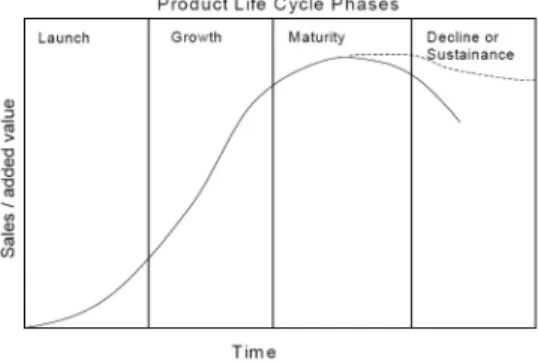
Product Life Cycle(PLC). This cycle describes the sales of the product, while it is on the market. An example of a Product Life Cycle graph can be seen in figure 6.
Let’s take a closer look at the PLC. Initially, in theintroduction/launch stage, sales are low. However, growth is accelerating, and soon we reach thegrowth phase. When this growth is starting to halt, we reach thematurity phase. Finally, the product either leaves the market (decline) or will have a steady sale level (sustenance).