ForceAtlas2, A Graph Layout Algorithm for
Handy Network Visualization
Mathieu Jacomy,
Non member
Sebastien Heymann,
Non member
Tommaso Venturini,
Non member
and Mathieu Bastian,
Non member
MM. Jacomy and Venturini are with Sciences Po, medialab.
M. Heymann is with LIP6 - CNRS - Universite Pierre et Marie Curie. M. Bastian is with the Gephi Consortium.
Abstract
ForceAtlas2 is a force vector algorithm proposed in the Gephi software, appreciated for its simplicity and for the readability of the networks it helps to visualize. This paper presents its distinctive features, its energy-model and the way it optimizes the “speed versus precision” approximation to allow quick convergence. We also claim that ForceAtlas2 is handy because the force vector principle is unaffected by optimizations, offering a smooth and accurate experience to users.
Index Terms
Force Vector, Gephi, Spatialization, Network Visualization, Social Networks Analysis
I. INTRODUCTION
In 2008, we started to develop the Gephi software1, a tool to visualize and manipulate networks [1]. We were working with researchers in social sciences at the Maison des Sciences de l’Homme in Paris2, and our goal was equipping them with network analysis without imposing them to learn graph mathematics. In particular, we wished to explain how to use and interpret the technique of network visualization.
These earliest Gephi users were not fully satisfied3 with existing spatialization tools4. We worked on empirical improvements and that’s how we created the first version of our own algorithm, ForceAtlas. Its particularity was a degree-dependant repulsion force that causes less visual cluttering. Since then we steadily added some features while trying to keep in touch with users’ needs. ForceAtlas2 is the result of this long process: a simple and straightforward algorithm, made to be useful for experts and profanes.
Useful means clear: the goal is to produce a readable spatialization and devise an energy-model that could be easily understood by users. Useful means efficient: the algorithm maintains an optimal balance between speed and precision at the node level, allowing a quick convergence
1http://gephi.org
2ICT and Migrations program, directed by Dana Diminescu [2]. http://ticmigrations.fr
3The main complaints were about too much visual cluttering, too complicated settings, and difficulties to understand the
principle of a force-directed layout.
4
We push here the word “spatialization”, that is “the projection of the data onto a space”. We want to emphasize the projection as a specific step of the visualization.
to the balanced state. Useful means versatile: different options allow users to tune the shape of their network. And useful means simple: ForceAtlas2 is made to foster interactions with the graph, as allowed by Gephi. It encourages users to learn the technique by their own experience.
II. ANATOMY OFFORCEATLAS2
ForceAtlas2 is a force directed layout: it simulates a physical system. Nodes repulse each other (like magnets) while edges attract the nodes they connect (like springs). These forces create a movement that converges to a balanced state. This final configuration is expected to help the interpretation of the data.
The force-directed drawing has the specificity of placing the nodes function of the other nodes, and not contingents on their only characteristics. There is at least one issue with this strategy: graphs do not all always converge to the same final configuration. The result depends on the forces applied but also the initial state and even the approximations of the algorithm. The process is not deterministic, and the coordinates of each point do not reflect any specific variable. The result is very different from a Cartesian projection. You cannot read the position of a node, you have to compare its position to the others. Despite this issue, the technique has a unique advantage: it greatly enhances the visual interpretation of the graph. Its very essence is to turn structural proximities into visual proximities, facilitating the analysis and in particular the analysis of social networks (SNA). Noack [3] has shown that the proximities express communities5.
ForceAtlas2 differenciates from other force-directed layout algorithms because of two main features:
1) The identity of a force directed layout resides first of all in its “energy model”, that is: the way it computes repulsion and attraction forces. Different formulas exist and each one produces different shapes for the same graph. Our energy model is positioned between Noack’s LinLog [6] and the algorithm of Fruchterman and Rheingold [7], with a major twist: the repulsion depends on the degree of nodes.
5
Noack relies on the very intuitive approach of Newman [4], [5]: actors have more relations inside their community than outside, communities are groups with denser relations. Newman proposes an unbiased measure of this type of collective proximity, called “modularity”. Noack [3] has shown that force-directed layouts optimize this measure: communities appear as groups of nodes. Force-directed layouts produce visual densities that denote structural densities.
2) In a force-directed algorithm, the layout applies step by step to the graph. These steps approximate the movements that lead to the balance. At each step forces are computed, and nodes are displaced as a result of such forces. This technique implies a “speed versus precision” trade-off. In order to reach the balance more quickly we can accelerate the movement of nodes, but this also creates inaccuracies, like nodes swinging and being unable to reach a balanced position. ForceAtlas2 continuously estimates the situation to maximize speed and minimize the swinging.
Despite these two innovations and other presented below, ForceAtlas2 sticks to the traditional design of force-directed layouts. It runs continuously and homogeneously until the user stops it. Unlike other recent algorithms6, it respects the feeling of a physical system, insufflating life in the network like a physics engine in a video game. This way users can comprehend a network by “playing” with it. At the end of this paper we will expose why this matters in the interpretation process.
A. Energy Model
Every force-directed algorithm relies on a certain formula for the attraction force and a certain formula for the repulsion force. The “spring-electric” layout [10] is a simulation inspired by real life. It uses the repulsion formula of electrically charged particles (Fr =k/d2) and the attraction
formula of springs (Fa =−k.d) involving the distance7 dbetween two nodes8. Fruchterman and
Rheingold [7] created an efficient algorithm using custom forces9.
Sixteen years later, Noack [6] explained that the most important difference among directed algorithms is the role played by distance in graph spatialization. As we said,
force-6
The OpenOrd algorithm of Martin et al. [8] has 5 different phases and stops at the end. It is neither continuous nor homogeneous. The algorithm of Yifan Hu [9] has an auto-stop and a graph coarsening feature. It is continuous only with these options disabled.
7
In this paper, the “distance” is always the geometric, cartesian distance, in the plane where the network is drawn. We will not write about the geodesic distance (shortest path length).
8Actually, non-realistic forces were used since the beginning, noticeably by Eades [10] in its pioneer algorithm. Fruchterman
and Rheingold were inspired by Eades’ work, and they notice that despite using the spring metaphor to explain his algorithm, the attraction force is not the one of a spring.
9Fruchterman and Rheingold’s algorithm uses the attractionF
a=d2/kand the repulsionFr =−k2/d. Their parameterk adjusts the scaling of the network.
directed algorithms work by simulating a physical system of attraction and repulsion forces. As in physical systems, such forces are proportional to the distance between the interacting entities: closer entities attract less and repulse more than farther entities and vice versa. The proportion-ality between distance and forces can be linear, exponential or logarithmic. The Spring model, for example, replicates precisely the physical forces to which it is inspired, thereby establishing a linear proportionality between the distance and the force (as for the spring attraction) and as a square proportionality between the distance and the force (as for electromagnetic repulsion). He defines the energy model or (attraction,repulsion)-model of a layout as the exponent taken by distance in the formulas used to calculate attraction and repulsion (the log being considered as the 0th power). For example, the model of the spring-electric layout is (1,−2).
The (attraction,repulsion)-model of ForceAtlas (1,−1) has an intermediate position between Noack’s LinLog (0,−1)and the algorithm of Fruchterman and Rheingold (2,−1).
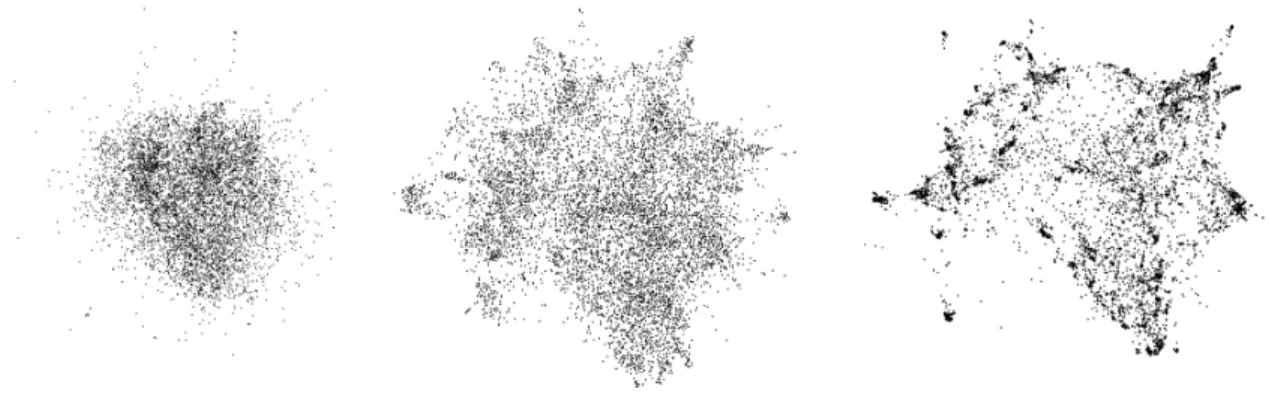
Noack [3] states that “Distances are less dependent on densities for large a −r, and less dependent on path lengths for small a”. It means that visual densities (where nodes gather) denote structural densities (densely connected subgraphs10) when a−r is low, that is when the attraction force depends less on distance, and the repulsion force depends more. ForceAtlas2 is clearly better than Fruchterman and Rheingold’s algorithm and worst than LinLog to show clusters11 in the graph (figure 1).
Fig. 1. Layouts with Fruchterman-Rheingold (a−r = 3), ForceAtlas2 (a−r = 2) and the LinLog mode of ForceAtlas2 (a−r= 1).
10
In graph theory, the density is the ratio of actual edges on possible edges.
11
A cluster is a subset of nodes that are more connected together than with the rest of the graph. A simple way to quantify the connectivity is to measure the density of edges.
B. A classical attraction force
The attraction force Fa between two connected nodes n1 and n2 has nothing remarkable.
It depends linearly on the distance d(n1, n2). We will explain later why there is no constant
adjusting this force.
Fa(n1, n2) = d(n1, n2) (1)
C. Repulsion by degree
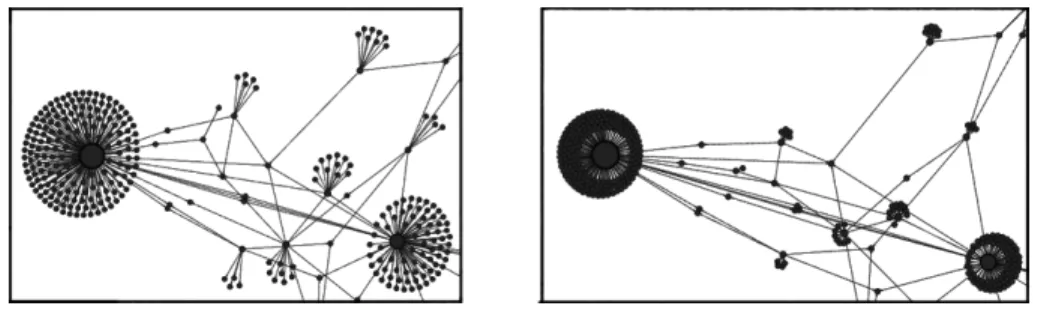
We designed ForceAtlas2 to interpret web graphs and social networks. A common feature of these networks is the presence of many “leaves” (nodes that have only one neighbor). This is due to the power-law distribution of degrees that characterizes many real-world data. The forest of “leaves” surrounding the few highly connected nodes is one of the principal sources of visual cluttering. To improve the readibility12 of these graphs, we modified the repulsion force.
Fig. 2. Fruchterman-Rheingold layout on the left (regular repulsion) and ForceAtlas2 on the right (repulsion by degree). While the global scheme remains, poorly connected nodes are closer to highly connected nodes.
The idea is to bring poorly connected nodes closer to very connected nodes. Our solution is to tweak the repulsion force so that poorly connected nodes and very connected nodes repulse less. As a consequence they will end up being closer in the balanced state (see figure 2). Our repulsion force Fr is proportional to the produce of the degrees plus one (deg+ 1) of the two
nodes. The coefficient kr is defined by the settings.
Fr(n1, n2) = kr
(deg(n1) + 1)(deg(n2) + 1)
d(n1, n2)
(2)
12
We do not measure here the readibility of a graph. We just mean that “leaves” are not the most interesting nodes, and should not have a great visual importance.
This formula is very similar to the edge repulsion proposed by Noack [6] except that he uses degree and not the degree plus one. In our formula the +1 is important as it ensures that even nodes with degree zero still have some repulsion force. We believe that this calibration of the repulsion force (that constituted the identity of ForceAtlas since the beginning) is at least as important as the (attraction,repulsion)-model implemented in ForceAtlas2 (and probably more as it has a dramatically increase of graphs interpretability). It is so appreciated by users that we do not propose to disable it.
III. AUTOMATIC“SPEED VERSUS PRECISION”APPROXIMATION
A. The issue of speed
When employing a force-based layout, users have to deal with the speed/precision trade-off. In a classical force-directed algorithm, increasing the speed makes the precision drop. The effect of the approximation is that some nodes (sometimes the whole graph) become unable to find a stable position and start swinging around their balancing position (see figure 3). Theoretically, the speed of spatialization should be chosen according to the size and properties of the graph, as well as on the time available and the goal of the spatialization. In practical terms, it is possible to find the right speed by increasing it up to the moment where accuracy problems appear. Unfortunately most users do not use this technique, mostly because they misinterpret the effects of the loss of precision. ForceAtlas2 has been developed to perform this technique automatically without requiring any intervention by the user.
Fig. 3. Fruchterman-Rheingold layout at speeds 100, 500 and 2500 (superposition at two successive steps). The swinging of nodes increases with speed.
and the speed is constantly computed to meet this requirement. In Gephi’s implementation, we set three default values for the “Tolerance (speed)” parameter: 0.1 under 5000 nodes, 1 up to 50000 nodes and 10 above. We will now describe how the speed optimization works.
B. Adapting the local speed
In order to minimize the swingingswg(n)of each node, we define swinging as the divergence between the force applied to a node at a given step and the force applied to the same node at previous step. Intuitively, the more the node is asked to change direction, the more it swings.
F(t)(n) it the result force applied to n at step t.
swg(t)(n) = |F(t)(n)−F(t−1)(n)| (3)
For a node moving towards its balancing position swg(n) will remain close to zero. A node that is not converging, on the contrary will have high values of swinging and its movement will have to be slowed down to help it finding its balancing position. The speed s(n) of a node n determines how much displacement D(n) will be caused by the resultant force F(n):
D(n) = s(n)F(n). The resultant force is the sum of all forces applied to each node (attraction, repulsion and gravity: F =Fa+Fr+Fg). While in most of the other force-directed algorithms
the speed is usually generic and set by the user, in ForceAtlas2 the speed is different for every node, and computed as follows:
s(n) = kss(G)
(1 +s(G)qswg(n)) (4)
s(G) is the global speed of the graph (see below). ks is a constant set to 0.1 in Gephi’s
implementation.
The more a node swings, the more it is slowed. If there is no swinging, the node moves at the global speed. As a protection, we implemented an additional constraint that prevents the local speed from being too high, even in case of very high global speeds.
s(n)< ksmax
|F(n)| (5)
C. Adapting the global speed
At each step, two global values are computed and used to set the global speed: the global swinging and the global effective traction.
The global swingingswg(G)represents the quantity of erratic movement present in the global movement of the graph. It is the sum of local swinging values, weighted by the degree of each node as in our repulsion force (degree+1).
swg(G) =X
n
(deg(n) + 1)swg(n) (6) The effective traction tra(n) of a node is the amount of “useful” force applied to that node. It represents the contrary of the swinging, the convergence of the movement. It is defined as an average:
tra(t)(n) =
|F(t)(n) +F(t−1)(n)|
2 (7)
If a node keeps its course, then tra(n) = F(n). If it goes back to its previous position (a perfect swinging) then tra(n) = 0.
The global effective traction tra(G) is the weighted sum of effective tractions of nodes:
tra(G) =X
n
(deg(n) + 1)tra(n) (8) The global speeds(G)keeps the global swingingswg(G)under a certain ratioτ of the global effective traction tra(G) and is defined as follows:
s(G) =τ tra(G)
swg(G) (9)
The ratio τ represents the tolerance to swinging and is set by the user.
NB: During our tests we observed that an excessive rise of the global speed could have a negative impact. That’s why we limited the increase of global speed s(t)(G) to 50% of the
D. Performance improvement
The strategies to optimize local and global speed just described have a dramatic effect on spatialization performances, without impacting the quality of the result. For some networks, ForceAtlas2 is the fastest and highest quality force-directed layout implemented in Gephi. Applied to graphs of whatever size it converges to a balanced state more quickly, while remaining fluid and continuous (see paragraph 5) and producing more accurate and stable layouts.
We can compare how different algorithms achieve spatialization by measuring the quality of the layout at each iteration. The “normalizedendv atedge length” proposed by Noack [11] is an appropriate quality measure. It measures that edges are the shortest possible, being normalized to the size and density of the graph. The lower it is, the better is the spatialization. Noack’s LinLog layout is designed to minimize this measure. The evolution of quality during the spatialization process indicates how many iterations are needed to obtain a “good” result, as well as the quality finally obtained.
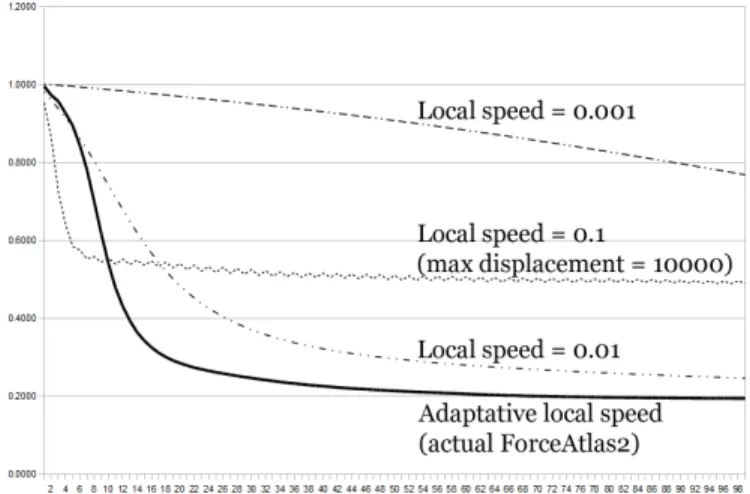
Fig. 4. Evolution of the quality of the ForceAtlas2 layout at each iteration (the lower the better), with different values of the local speed. The adaptative local speed achieves the best compromise between performance and quality.
We explain how the “speed versus precision” optimization impacts the performance. In figure 4 we plot what happens if the speed of each node is set to an arbitrary number with ForceAtlas2. If the speed is too low (0.001), the convergence is slow. But if the speed is too high, the quality is bad. In our example, it happens with a local speed of 0.1. Up to the 10th step, the modified
swinging it finally stops converging at a low quality state. Note that the swinging appears as an oscillation of the quality curve13.
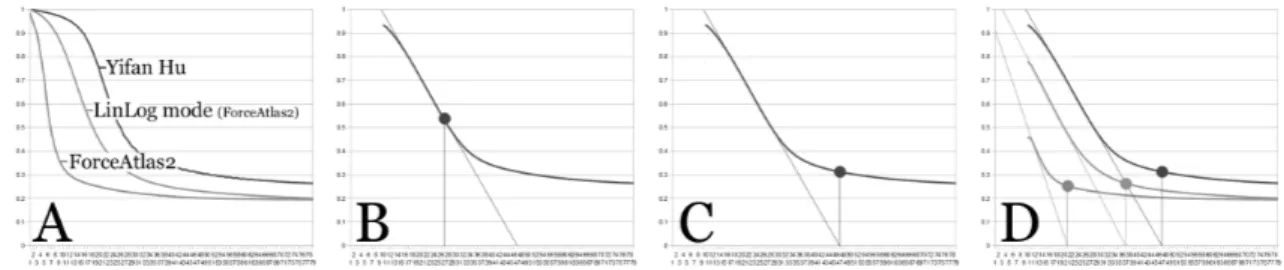
The “speed versus precision” optimization not only relieves users of researching the right setting, but also provides more performance and quality. We now compare ForceAtlas2 (normal and LinLog mode) to other algorithms (Yifan Hu [9], Fruchterman Rheingold [7]). As we see in figures 4 and 5, the spatialization process has 3 different stages. In the early iterations, quality improves slowly (this stage is sometimes very short). Then in the following iterations, the spatialization reaches its best rate. Finally the quality stops improving and slowly reaches its final state. The second stage charaterizes the balance between performance and quality. We can detect this stage thanks to the inflexion, but the inflexion point itself is not a good landmark. That’s why we rely on the tangent at this point to measure the performance and quality of the curve.
The figure 5 illustrates our method. To detect a global inflexion, we smooth the curve (we average from -10 to +10 iterations). Then we detect the inflexion point14 (fig 5.B). The inflexion point and the tangent define an “ideal” rate. Our performance indicator is the iteration where the best quality (0) would be achieved at this “ideal rate” (the point where the tangent crosses the X axis, see fig 5.C). We call this step the “ideal convergence”. We associate it to a quality measure, that is the quality actually reachen at the “ideal convergence” step (the “short-term quality”). These measures represent what you obtain, and in how much time, if you stop the algorithm after its most efficient phase. To represent what you get with more time available, we also show the quality reachen after 750 iterations (“long-term quality”).
We applied this method to 10 different datasets. The result is presented as charts in figures 6, 7 and 8. The figures are available in annex, with details on the datasets used. Note that the settings are adjusted so that spatialized networks always have the same size. For ForceAtlas2 and Fruchterman Rheingold, the gravity was set to zero. The speed was set to 20 for Fruchterman Rheingold (the best empirical value for these datasets). These indicators measure performance and quality:
13
We had to implement a “max displacement” limit to prevent divergence. Without this limit, very close nodes would be repulsed arbitrary far, destroying performances. With a high limit, the quality is bad (this behavior is plotted in figure 4). With a low limit, it behaves like low speeds and the performance is bad.
14
Fig. 5. Evolution of the quality of 3 different algorithms during spatialization (A). The tangent at the inflexion point (on smoothed curves) (B) defines the most efficient rate of convergence. When this tangent crosses the X axis, the actual quality reachen on the curve (C) defines what you get if you stop the algorithm after its most efficient phase. This characteristic spot allows to compare quality as well as performance between algorithms (D). The earlier it happens, the most performant the algorithm.
• “Iterations performance” measures how much iterations the layout would need to reach the
0 quality if it was progressing at its best rate.
• “Short-term quality” is the quality reachen just after the most efficient phase of the layout.
This moment is the one used to measure iterations performance.
• “Long-term quality” is measured at the 750th iteration. This value was empirically chosen
so that all layouts have time to fully improve quality.
ForceAtlas has both a better “iterations performance” and a better “short-term quality” than Yifan Hu and Fruchterman Rheingold algorithms for 7 datasets over 10. It has a better “long-term quality” for all but one dataset with default settings, and achieves an even better “long-“long-term quality” in all cases with the LinLog mode enabled. We empirically observed that ForceAtlas2 is at its best with strongly clustered networks.
Fig. 6. Performance of the layouts on various datasets: Yifan Hu (YH), ForceAtlas2, by default (FA2) and with LinLog mode enabled (FA2 LinLog) and Fruchterman Rheingold (FR). The lower the better. ForceAtlas2 needs most of the time a little less iterations than Yifan Hu.
Fig. 7. Short-term quality of the layouts on the datasets. The lower the better. ForceAtlas2 has often the best quality.
Fig. 8. Long-term quality of the same layouts for the same datasets. The lower the better. ForceAtlas2 in LinLog mode is clearly the best in the long-term. Noack’s LinLog was designed to optimize this quality measure. Even in normal mode, FA2 clearly has a better long-term quality than YH.
ForceAtlas2 needs few iterations to reach a significant quality. Each iteration is also computed in a short amount of time. In Gephi, it is often 4 times more efficient than Yifan Hu (figure 9). ForceAtlas2 benefits here from the Barnes Hut optimization (see next section) and a multithread implementation.
Dataset (nodes) (edges) ForceAtlas2 Yifan Hu Fruchterman Rheingold Internet 22 963 48 436 403 ms 1 713 ms N/A
SiSWordsFR 6 704 71 744 137 ms 539 ms 4 858 ms
Diseasome 1 419 3 926 19 ms 80 ms 112 ms
KarateClub 34 78 0.8 ms 0.97 ms 0.07 ms
Fig. 9. Iteration time, the lower the better. The measure is the average computation time for the 30 first iterations of different layouts applied to different datasets. ForceAtlas2’s implementation is multithreaded and uses 3 simultaenous threads. The CPU of the computer is a quad-core “Intel Q9000” running at 2.00 GHz. ForceAtlas2 iterations are 4 times faster than Yifan Hu’s.
IV. SETTINGS
We detail here the various parameters proposed by ForceAtlas2. They allow the users to affect the spatialization and thereby vary the shape of the network. The goal is both increasing the number of views on the data and to allow users to enhance their visualizations.
A. LinLog Mode
We much appreciated the work of Andreas Noack on force-vector algorithms. We consider its edge-repulsion15 as a must-have and we think that the LinLog energy model gives wonder-ful results16. That’s why we implemented a linear-logarithmic energy model as an option of ForceAtlas2.
The LinLog mode just uses a logarithmic attraction force.
Fa(n1, n2) =log(1 +d(n1, n2)) (10)
We have already seen that this energy model has a strong impact on the shape of the graph, making the clusters tighter (see figure 1). We also observed that it converges slower in some cases. Switching from regular mode to LinLog mode needs a readjustment of the scaling parameter. This energy model is also working well with our automatic “speed versus precision” approximation, and our other features.
B. Gravity
A common improvement of force-vector algorithms is gravity. This force Fg(n) prevents
disconnected components (“islands”) to drift away. It attracts nodes to the center of the graph space. Actually its main purpose is to compensate repulsion for nodes that are far away from the center. In our case it needs to be weighted like the repulsion:
Fg(n) = kg(deg(n) + 1) (11) 15
Andreas Noack applied repulsion to edges instead of nodes (that is, to the nodes at the start and end of the edge). It is mathematically equivalent to dividing the traditional repulsion applied to a node by this node’s connected edges.
16ForceAtlas was already implemented in Gephi when we read Noack’s works. Because it is a landmark of Gephi, we kept
ForceAtlas’ identity and main features in its second version, and improved its “speed versus precision” optimization, while implementing a “lin-log” mode that also benefits from it. Users feedbacks confirmed that some prefer the “lin-log” shape while others prefer the original “lin-lin” shape.
kg is set by the user.
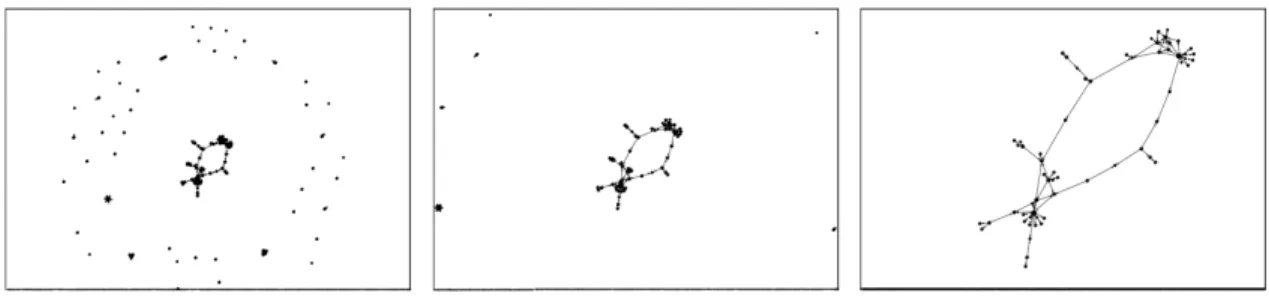
Fig. 10. ForceAtlas2 with gravity at 2 and 5. Gravity brings disconnected components closer to the center (and affects a little the shape of the components as a side-effect).
C. Scaling
Most force-directed algorithms contain a couple of constants ka and kr playing an opposite
role in the spatialization of the graph. The attraction constant ka reduces the size of the graph
while the repulsion constant kr expands it. In the first version of ForceAtlas, user could modify
the value of both variables. For practical purposes, however, it is better to have only one single scaling parameter. In ForceAtlas2, the scaling is kr while there is no ka. The higher kr, the
larger will be the graph.
Fig. 11. ForceAtlas2 with scaling at 1, 2 and 10. The whole graph expands (note that the size of the nodes remains the same; scaling is not zooming) as scaling affects the distance between components as well as their size.
D. Edge weight
If the edges are weighted, this weight be taken into consideration in the computation of the attraction force. If the setting “Edge Weight Influence” δ is set to 0, the weights are ignored. If it is set to 1, then the attraction is proportional to the weight. Values above 1 emphasize the weight effects. This parameter is used to modify the attraction force according to the weight
w(e) of the edge e:
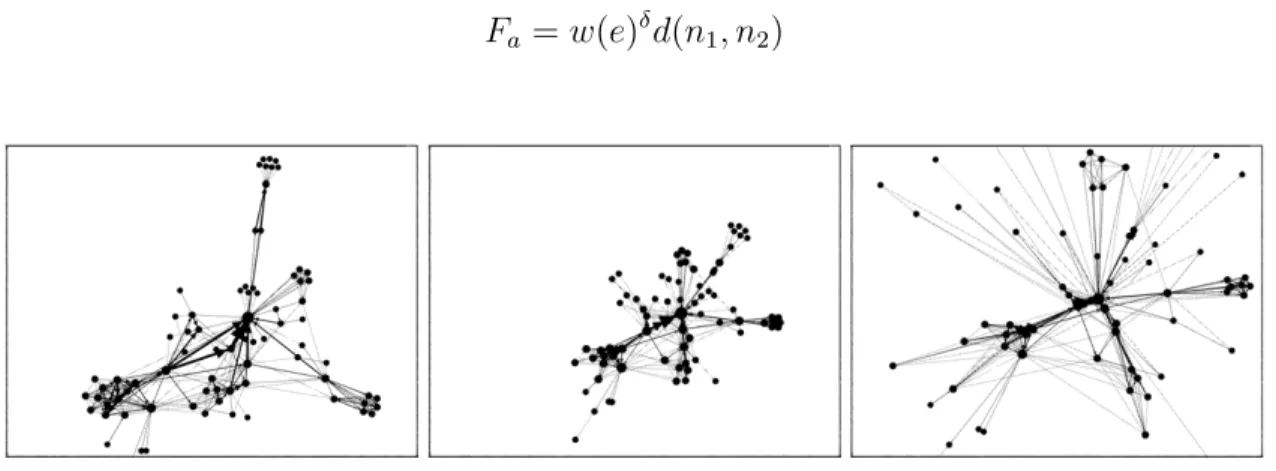
Fa =w(e)δd(n1, n2) (12)
Fig. 12. ForceAtlas2 with Edge Weight Influence at 0, 1 and 2 on a graph with weighted edges. It has a strong impact on the shape of the network.
E. Dissuade Hubs
ForceAtlas2 has a “Dissuade Hubs” mode that, once activated, affects the shape of the graph by dividing the attraction force of each node by its degree plus one for nodes it points to. When active, the attraction force is computed as follows:
Fa(n1, n2) =
d(n1, n2)
deg(n1) + 1
(13) This mode is meant to grant authorities (nodes with a high indegree) a more central position than hubs (nodes with a high outdegree)17. This is particularly interesting with social networks or web networks and in general in all directed networks where it is harder to be linked than
17
We improperly use the concepts of Hub and Authority defined by Kleinberg [12]. We do not actually compute the HITS algorithm for performance issues.
to link. “Dissuade Hubs” tends to push hubs to the periphery while keeping authorities in the center of the graph.
F. Prevent Overlap
With this mode enabled, the repulsion is modified so that the nodes do not overlap.
The idea is to take in account the size of the nodessize(n)in computing the distanced(n1, n2)
both in the attraction force and in the repulsion force.
• d0(n1, n2) = d(n1, n2)−size(n1)−size(n2) is the “border-to-border” distance preventing
overlap.
• if d0(n1, n2)>0 (no overlap) then we use d0 instead of d to compute forces:
Fa(n1, n2) =d0(n1, n2)
Fr(n1, n2) = kr
(deg(n1) + 1)(deg(n2) + 1)
d0(n
1, n2)
• if d0(n1, n2)<0 (overlap) then no attraction and a stronger repulsion:
Fa(n1, n2) = 0
Fr(n1, n2) = k0r(deg(n1) + 1)(deg(n2) + 1)
• if d0(n1, n2) = 0 then there is no attraction and no repulsion
In Gephi’s implementationkr0 is arbitrary set to 100. Note that the swinging measure is biased due to this option, that’s why we also implemented a malus on the local speed (dividing it by 10).
It is important to notice that this mode adds a considerable friction in the convergence move-ment, slowing spatialization performances. It is preferable to apply it only after the convergence of graph spatialization.
G. Approximate Repulsion
In order to improve spatialization performances on big graphs, we implemented the opti-mization of Barnes Hut [13] in the Gephi version of ForceAtlas2. Relying on an approximate computation of repulsion forces, such optimization generates swinging and it might be annoying when a maximum quality is required and useless on little and medium size graphs. That’s why the user can disable this feature. Without the Barnes and Hut optimization, the complexity time is
o(n2)wherenis the number of nodes. With the optimization, the complexity time iso(nlog(n)). In the following table are actual measures of the performance gain (the same benchmark as in figure 9, average iteration time for the first 30 iterations).
ForceAtlas2 ForceAtlas2
Dataset (nodes) (edges) with without gain
approximation approximation
Internet 22 963 48 436 403 ms 41 161 ms 102 times faster SiSWordsFR 6 704 71 744 137 ms 2 695 ms 20 times faster
Diseasome 1 419 3 926 19 ms 56 ms 3 times faster
KarateClub 34 78 0.8 ms 1.1 ms 1.4 times faster
V. DISCUSSION: THE NATURAL FEELING OF A PURE FORCE-VECTOR
In our efforts to foster network visualization, we are confronted to a common mistake: those who are new to graphs read spatialized networks as if they were geographical maps. In geographical representations, the space is defined ex ante by the way horizontal and vertical axes are constructed. Points are projected on such pre-existing space according to a set of rules that assign them a pair of coordinates and thereby a univocal position. The same is true for any Cartesian coordinate system, but not for our graphs. In a graph, the position of a node is not defined by the projection of its coordinates in a pre-existing space. It is, on the contrary, the space of the graph that is defined by the nodes and the relations that it contains. When we spatialize a graph, we do not reveal its natural shape, we construct its shape. Such construction is based on the relation(s) defining the network, but is also heavily dependent on features the spatialization algorithm that we employ. Not only users can choose among a myriad of different algorithms but they all have plenty of parameters and options, each one leading to different results.
Far from being an automatic process, the visualization of a network involves hundreds of design choices and users have to be aware of the consequences of each one. The strategy we adopted in Gephi is to let users see in real time the consequences of their choices, learning from their trials as well as from their errors. Interaction, we believe, is the key to understanding.
While developing the Gephi interface, we strongly wanted the process of network spatialization to be displayed “live”. Most other tools display the result of the force-directed layout without showing the process of spatialization18. This may lead the users to believe that the result is unique or optimal. That is why it is important to see the spatialization process and even to interfere with it. Manipulating a graph while it spatializes helps to understand the difference between a graph layout and a Cartesian projection.
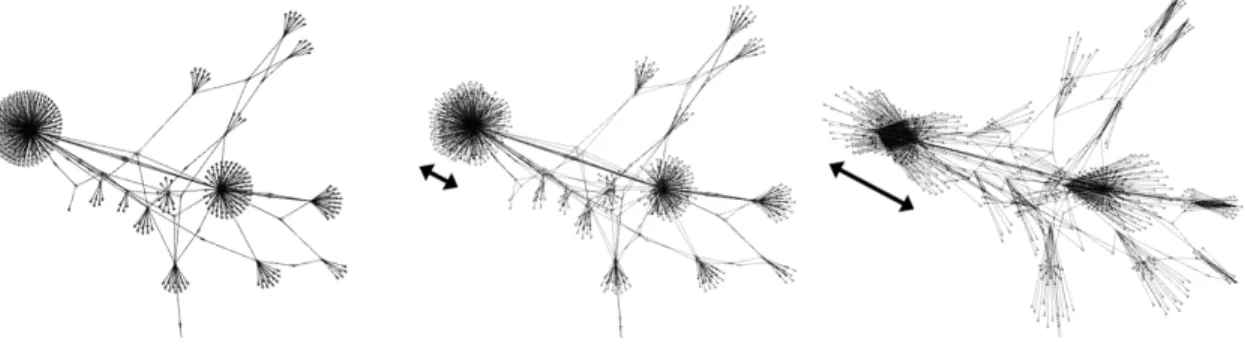
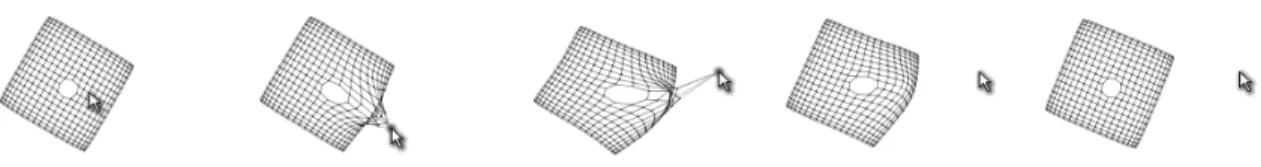
Fig. 14. A sample network manually stretched and released while ForceAtlas2 is running. The goal is to experience what does mean “the balanced state”.
For this reason we deliberately decide to avoid spatialization techniques that proceed through distinctive phases (OpenOrd [8] or the multilevel implementation of Yifan Hu [9]), ForceAtlas2’s action is fluid and continuous. Once launched, ForceAtlas2 starts applying the forces that displace the nodes and keeps applying them even after the convergence is reached. Thanks to this feature, users can live check the consequences of changing a setting or moving a part of the graph. Even more important, users can act on the graph topology by changing the ranking of the nodes, or filtering nodes and edges, even creating new entities. ForceAtlas2 will take into account modifications in real time, re-computing attraction and repulsion forces and continuously changing the shape of the graph.
Besides being encouraging users to manipulate their graphs, this feature also allows ForceAt-las2 to spatialize dynamic graphs (graphs whose nodes and edges change in time). This is
18
particularly interesting for graphs that derive from streaming data19. ForceAtlas2 does not only show the different stages of a dynamic graph, but also how the network evolves from one stage to the other.
Continuity is also useful to cope with the “quality versus available time” trade off. With such a continuous algorithm you can observe that spatialization improves over time.
ForceAtlas2 is “pure” in the sense that no optimization biases its equations (except Barnes Hut, but it can be disabled). It converges fluently to a very stable arrangement, and thus can be used on small networks (less than 100 nodes) where quality is required. But the Barnes Hut optimization still allows performance on larger networks (more than 10.000 nodes). The stable state reached always conforms to the pseudo-physical forces involved. The result is trusty and can be interpreted as an optimal spatialization. Stretching the network and observing it moving back to its stable state confirms the relevance of this strategy.
VI. CONCLUSION
As more and more people deal with relational data, network visualization assumes a key importance. ForceAtlas2 is our contribution to make force-directed algorithms easy to use and understand. By its design and features, it aims at offering its users the most.
• Energy model: Simple and efficient, the linear attraction and linear repulsion by degree
produces readable spatial arrangements.
• Performance: The automatic “speed versus precision” approximation allows a constant
accuracy on networks from 10 to 10.000 nodes. Default settings provide users with both the best quality and the best performance.
• Design: The force-based principle is fully respected. Gephi’s users can interact with the
network while it spatializes, thereby fostering a better and experience-based understanding of this type of algorithm.
• Features: Different options allow users to try different energy-models (LinLog) or just to
tune the properties of the spatialized network so that it fits their needs (scaling, gravity, edge weight and preventing nodes overlapping).
19
for an example see the dynamic visualization of a Twitter conversation, http://gephi.org/2011/the-egyptian-revolution-on-twitter
REFERENCES
[1] M. Bastian, S. Heymann, and M. Jacomy, “Gephi: an open source software for exploring and manipulating networks,” in
International AAAI Conference on Weblogs and Social Media. Association for the Advancement of Artificial Intelligence, 2009.
[2] D. Diminescu, “The connected migrant: an epistemological manifesto,” Social Science Information, vol. 47, no. 4, pp. 565–579, 2008.
[3] A. Noack, “Modularity clustering is force-directed layout,”Physical Review E, vol. 79, no. 2, 2009. [4] M. E. J. Newman, “Analysis of weighted networks,” 2004, arxiv:cond-mat/0407503.
[5] ——, “Modularity and community structure in networks,”Proceedings of the National Academy of Sciences, vol. 103, no. 23, pp. 8577–8582, 2006.
[6] A. Noack, “Energy models for graph clustering,”J. Graph Algorithms Appl., vol. 11, no. 2, pp. 453–480, 2007. [7] T. M. J. Fruchterman and E. M. Reingold, “Graph drawing by force-directed placement,”Softw: Pract. Exper., vol. 21,
no. 11, pp. 1129–1164, Nov. 1991.
[8] S. Martin, W. M. Brown, R. Klavans, and K. W. Boyack, “OpenOrd: an open-source toolbox for large graph layout,” in
Society of Photo-Optical Instrumentation Engineers (SPIE) Conference Series, ser. Society of Photo-Optical Instrumentation Engineers (SPIE) Conference Series, vol. 7868, Jan. 2011.
[9] Y. F. Hu, “Efficient and high quality force-directed graph drawing,”The Mathematica Journal, vol. 10, pp. 37–71, 2005. [10] P. Eades, “A heuristic for graph drawing,”Congressus Numerantium, vol. 42, pp. 149–160, 1984.
[11] A. Noack, “Unified quality measures for clusterings, layouts, and orderings of graphs, and their application as software design criteria,” PhD thesis, Brandenburg University of Technology, Cottbus, Germany, 2007.
[12] J. M. Kleinberg, “Authoritative sources in a hyperlinked environment,”J. ACM, vol. 46, pp. 604–632, September 1999. [13] J. Barnes and P. Hut, “A hierarchical o(n log n) force-calculation algorithm,”Nature, vol. 324, no. 6096, pp. 446–449,