A Detailed Study of the Generation of
Optically Detectable Watermarks using the
Logistic Map
Aidan Mooney
a, John G. Keating
a, Daniel M. Heffernan
b,c aDepartment of Computer Science, NUI Maynooth, Co. Kildare, Ireland bDepartment of Mathematical Physics, NUI Maynooth, Co. Kildare, Ireland cSchool of Theoretical Physics, Dublin Institute for Advanced Studies, Dublin 4,Ireland
Abstract
A digital watermark is a visible, or preferably invisible, identification code that is permanently embedded in digital media, to prove owner authentication and provide protection for documents. Given the interest in watermark generation using chaotic functions a detailed study of one chaotic function for this purpose is performed. In this paper, we present an approach for the generation of watermarks using the logis-tic map. Using this function, in conjunction with seed management, it is possible to generate chaotic sequences that may be used to create highpass or lowpass digital watermarks. In this paper we provide a detailed study on the generation of opti-cally detectable watermarks and we provide some guidelines on successful chaotic watermark generation using the logistic map, and show using a recently published scheme, how care must be taken in the selection of the function seed.
1 Introduction
Digital Watermarking provides a means of inserting additional information into digital documents [1]. This extra information may be used to provide a certain degree of protection to the document from malicious attack. This in-formation is usually a piece of identifying inin-formation which may be used at a later date to prove ownership. Watermarking in contrast to steganography
Email addresses: [email protected](Aidan Mooney),
[email protected](John G. Keating),[email protected](Daniel M. Heffernan).
has the additional notion of resilience against attempts to remove the hid-den data [2]. The original document owner can prove ownership of copies by proving that it contains their original watermark.
Numerous watermark generation techniques have been proposed to date, rang-ing from the use of personal logos to the use of pseudorandom sequences of numbers [1]. The use of chaotic functions for the generation of watermarks has also been proposed by Pitaset al.[3–5] where the Markov Maps and Bernoulli Maps are used as the chaotic functions. These types of watermark generation schemes require two values, the initial value and the function seed, in order to recreate the same watermark at a later stage. An advantage of these water-marks is the ability to analyse and control their spectral properties. Typically these watermarks are distributed over the full cover image using an additive or multiplicative technique.
Pitas et al.have described in detail the use of chaotic functions in watermark generation [3,5] and provide analysis of the functions and techniques used. A similar analysis for the logistic map does not exist and we believe that an understanding of it would be significant in the generation of chaotically generated watermarks. In this paper we deal with optical watermarks, which we consider to be watermarks which may be detected with optical correlation techniques. Previous watermarking schemes have proposed the use of optical devices such as photocopiers to retrieve the embedded watermarks [6,7] but no scheme has proposed the use of optical hardware to perform the task of watermark detection.
2 Relevant properties of the logistic map for the generation of optically detectable watermarks
In this paper, we utilise watermarks that are generated using a deterministic chaotic map. One motivation for using such chaotic functions to generate a watermark is that a single variable, seeding the chaotic function, will always result in the same output (mapping) when certain constraints or initial condi-tions are placed on the mapping. The primary advantage, however, is that it is possible to investigate the spectral properties of the resulting watermark [3– 5]. The function used in this paper for the generation of sequences which are transformed into watermarks is the logistic difference equation, sometimes referred to as the logistic equation or mapping:
yn+1 =ayn(1−yn) (1)
where a is the ‘function seed’ and yn is the current value of the mapping in
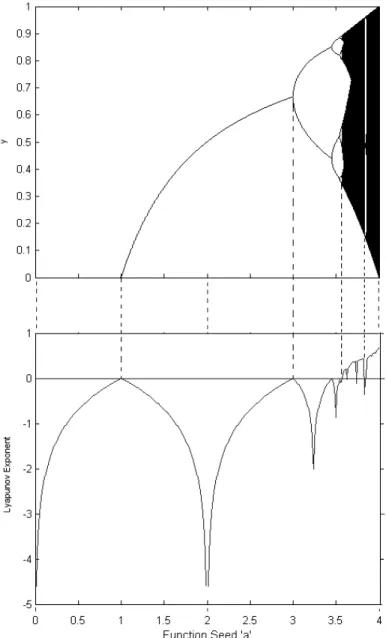
thoroughly studied and are well classified. The complicated but deterministic properties of the map make it ideally suited for watermark generation. The valueyn+1 is dependant on its current valueyn. For low values of a, yn
even-tually converges to a single number as n → ∞. When a = 3.0, yn no longer
converges – it oscillates between two values. This characteristic change in be-haviour is called a bifurcation, and can be seen in the bifurcation diagram shown in Fig. 1. Increasing the value of a(> 3.0) causes yn to oscillate
be-tween not two, but four values. As a increases, yn goes through bifurcations
of period 2n and eventually becomes chaotic. When the value of a ≈3.55699
(the accumulation point),ynneither converges or oscillates – its value becomes
random. For values of a >3.5699, the behaviour is largely chaotic [8].
The degree of randomness of any map F(x) can be seen from the variation of the Lyapunov Exponent for the map with respect to the value of a. We can calculate the Lyapunov Exponent, λ, for the logistic equation from [9]:
λ= lim N→∞ 1 N log ¯ ¯ ¯ ¯ ¯ d dxF n(y) ¯ ¯ ¯ ¯ ¯ y0 (2)
which, on applying the chain rule
dFn dy ¯ ¯ ¯ ¯ ¯ y0 = NY−1 i=0 dF dy ¯ ¯ ¯ ¯ ¯ yi (3) reduces to λ(y0) = lim N→∞ 1 N NX−1 i=0 log|F0(y i)| (4)
where yi are points on the orbit. The map is dissipative for almost all y0 and
gives rise to the sameλfor a fixed value ofa. For one-dimensional motion,λis equal to the Kolmogorov-Sinai entropy (KSE). The KSE marks the transition from regular to chaotic behaviour with the notion that a positive KSE is a sufficient condition for chaos [10].
The Lyapunov Exponent is useful for distinguishing between the various types of orbits. Whenλ ≤0 the logistic map exhibits periodic behaviour, and when
λ >0 the logistic map exhibits chaotic behaviour [11,12]. Fig. 1 illustrates the Lyapunov Exponent for the range [0,4] for the logistic equation. Whenever an orbit containsyn = 12, λ=−∞, and every 2n periodic orbit has this as one of
its periodic points.
For the logistic map there are two distinct regimes: (1): the periodic or bi-furcation regime. Here 0 < a < a∞ and λ is negative, and, (2): the chaotic
Fig. 1. The bifurcation diagram for the logistic map and the corresponding Lyapunov Exponent.
regime, for which a∞ < a≤ 4 and λ is mostly positive. The periodic regime
is characterised byan where the number of fixed points changes from 2n−1 to
2n and the a
n scale according to Feigenbaum’s δ and α, where δ = lim n→∞ an−an−1 an+1−an = 4.669201 (5) and α= lim n→∞ dn dn+1 = 2.502907 (6)
wheredn are the distances of points in a 2n super cycle which is closest to the
superstable point y= 1
2, which is contained in every orbit.
In the chaotic regime, the chaotic intervals move together by inverse bifurca-tion as a is increased from a∞ to 4 until the iterates become distributed over
the whole interval [0,1] at a = 4. Within the chaotic intervals are a-windows which are characterised by p-cycles (P = 3,5,6, . . .) with successive bifur-cations P, P.21, P.22, . . .. The corresponding a values scale as in Eq.5. There
are also period tripling P.3n and quadruplings P.4n, etc. which occur at ¯a n
and give rise to constants ¯δ and ¯α which are again universal. For example, ¯
δ= 55.247 and ¯α= 9.277 for P.3n [13,14].
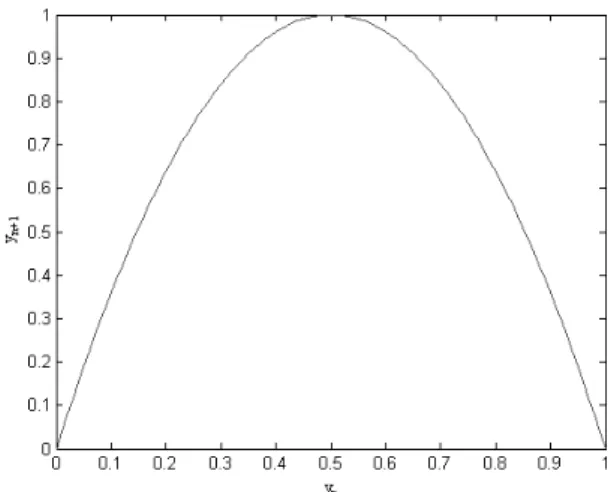
The logistic map maps the closed interval [0,1] onto itself and examination of one such transformation (when a = 4) illustrates this, as shown in Fig. 2 and may also be observed by examining Fig. 1 at a = 4. By choosing an initial value y0 ∈ [0,1] the successive states of the system are given by the
trajectory [15]:
y0, F(y0), F2(y0) =F(F(y0)), . . . (7)
Fig. 2. Cross sectionyn+1 versus yn whena= 4.
Sections 3−6 describe watermark generation, embedding and detection schemes along with unique properties of the logistic map which are useful in the gen-eration of chaotic watermarks, in particular the choice of function seed.
3 Watermark Generation
When the logistic equation, shown in Eq.1 is seeded with a value 3.5699≤a ≤
the logistic equation that is utilised to generate watermarks. The trajectories produced will differ greatly even for small differences in the seed value. The dense set of chaotic periodic orbits of the mapping are used for the generation of watermarks.
A chaotic binary sequence is quantified from the real sequence generated from iterating the logistic map using:
xn= 0 yn≤0.5 1 yn>0.5 (8)
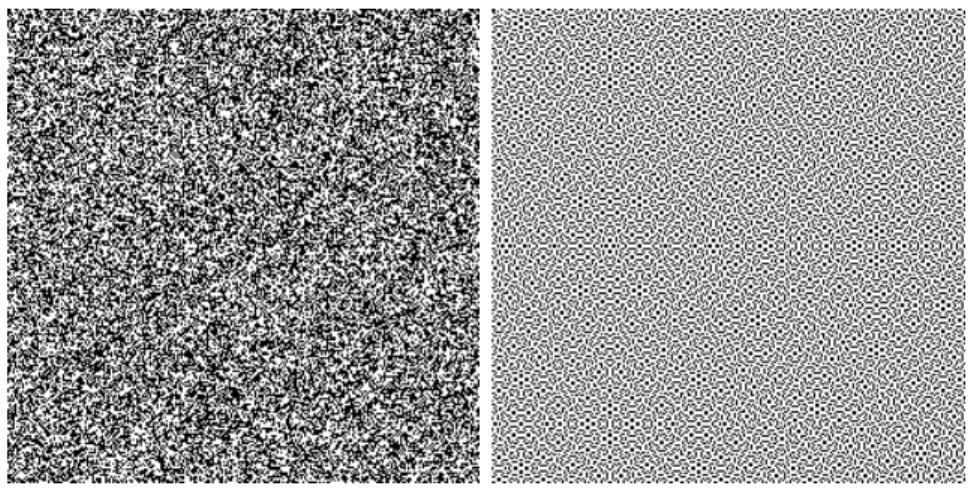
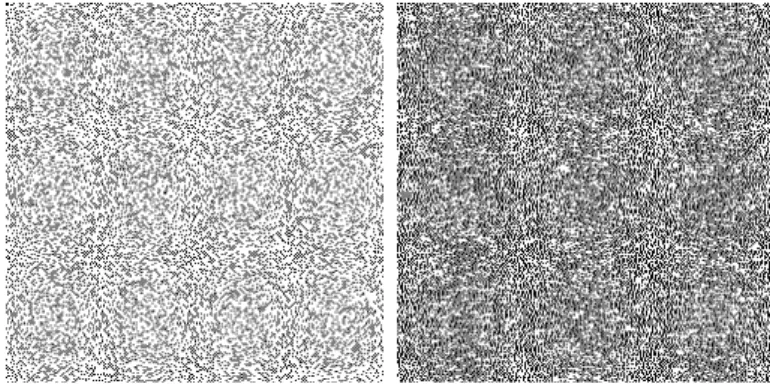
This sequence is then converted into a 2D image which may be used as a watermark. Usually, watermarks are generated which are the same size as the image which will contain the watermark, as this ensures the watermark is spread across the entire image. A scanning technique, known as Peano Scan-ning [16], may be used to determine watermark pixel ordering in the 2D image and is preferable to the conventional Raster Scanning technique in that scan-ning is not predictable, and can produce many variations within the same image. A drawback with using Peano Scanning, however, is that it will only operate on images whose height and width are multiples of two. The scan-ning order always moves to a neighbouring pixel, but the pattern may appear in different orientations depending on the starting pixel within the scanning routine [17,18]. An example of a watermark generated using this technique is shown in Fig. 3(a). In this case, the logistic function was seeded with a value
a= 4 and an initial starting value of y0 = 0.001.
Watermarks produced using chaotic functions are desirable, with only the initial starting value and seed needed to regenerate a sequence of numbers. This ensures that the sequence can only be reproduced if seeded with the corresponding initial starting value and also the function seed. Given that the logistic map is not invertible, there is added security over pseudorandom sequences. Chaotic watermarks are preferable to the more conventional pseu-dorandomly generated watermarks, in that their spectral properties can be controlled, which is discussed below.
An important property of the logistic map is that there are certain regions of the logistic map where chaotic behaviour is not observed. It should be obvious that no chaotic behaviour is observed for values of the seed less than the accumulation point, see Fig. 1. Beyond this point periodicity witnessed previously gives way to chaos. Within this chaotic region there are non chaotic regions present. These occur at the bifurcation zones of the chaotic region of the map, for example, sizeable regions exist when 3.627 ≤ a ≤ 3.634 (6 bifurcations −P.6n), 3.739 ≤ a ≤ 3.744 (5 bifurcations −P.5n) and 3.829 ≤ a≤3.856 (3 bifurcations −P.3n).
Fig. 3. Watermark generated by iterating the Logistic Map with an initial value of 0.001 and (a):a= 4 (b):a= 3.83.
The latter of these regions, known as a period-tripling region, within this re-gion the logistic map can be in one of three states independent of y0. Using
a seed for the function within this zone will result in the orbit of the map taking on only one of three values. The sequences produced are non chaotic, and also predictable and therefore are not suitable for watermark generation. A sample of a watermark generated when a = 3.83 is shown in Fig. 3(b). In this case Peano Scanning is used to determine the scanning order of the pix-els. This figure illustrate that non-chaotic predictable sequences are produced even in the chaotic region. It can be seen that there is a pattern developing within the watermark and this is due to the predictability of the map at this location. Similar results are found for each of the non-chaotic regions of the map, indicated previously.
4 Probability Density
It is often useful to examine the frequency with which each state along a trajectory falls into a certain region of the state space. This is known as the probability density, or the invariant measure, and is calculated as follows: As-sume that state space [0,1] is divided intondiscrete non-intersecting intervals, so the ith interval is (neglecting the end point 1):
[(i−1)/n, i/n) i= 1, . . . , n (9)
Next, an initial state y0 is chosen and a trajectory of length N (N À n)
calculated by:
The fraction, fi, of the N system states that are in the ith interval is given by [15] fi = n N{number of F j(y 0)∈[(i−1)/n,i/n),j = 1, . . . ,N} (11)
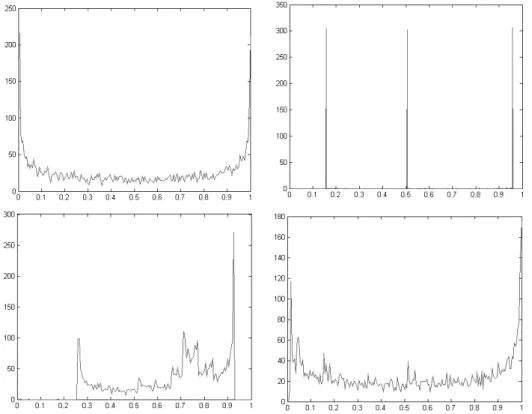
Fig. 4(a) and (b) shows the calculated probability density when a = 4 and whena= 3.83 for 5000 iterations, and 200 possible states. It can be seen that in the case wherea= 4 there is symmetry with most states concentrated near 0, and near 1 with a minimum at 1
2. In the case ofa= 3.83 it can be seen that
the system can be in only one of three possible states. This is not surprising since when a= 3.83 the logistic mapping is within a stable state, the period tripling state, referred to earlier.
Fig. 4. Probability Density when (a):a= 4 (top left), (b):a= 3.83 (top right), (c):
a= 3.7 (bottom left), and (d):a= 3.99 (bottom right).
Fig. 4(c) and (d) shows the cases where the above procedure was repeated with
a = 3.7 and with a = 3.99. It can be observed that in the case of a = 3.99 there is a greater spread of states. There is a balance between the number of 0 pixels (white) and 1 pixels (black). In the case ofa= 3.7 it can be seen that the trajectory ends up in states greater than 0.5 substantially more times than in states less than 0.5. This means that in the watermark there will be more 1 pixels than 0 pixels, i.e. more white than black pixels. In the case ofa= 3.99 there is much less density variation in watermark produced than in the case of the watermark generated when a = 3.7. This means that the watermark
produced when a= 3.99 is more lowpass than the watermark produced when
a= 3.7 and has shown to be the case [19].
There are, however, other stable states within this region which are not suit-able for use in watermark generation. These stsuit-able states occur when a trajec-tory arrives at a fixed point of the logistic map, i.e. whenyn+1 =yn. Therefore,
the fixed points may be obtained by solving
y[1−a(1−y)] =y(1−a+ay)
=ay[y−(1−a−1)] = 0 (12)
Thus
y0 = 0 and y0 = 1−a−1 (13)
For the case ofa = 4 the two fixed points which satisfy Eq. 13 arey0 = 0 and
y0 = 34 [15].
When the mapping is seeded with a value leading to a fixed point, the map is in a periodic state. Watermarks produced in this case are not suitable for watermark embedding as there is no variation in the pixels within the water-mark (either all black or all white pixels). This would result in no variation in the image to be watermarked after watermark embedding and thus render detection impossible.
5 Watermark Embedding and Detection
Watermark embedding refers to the process of inserting the generated wa-termark robustly into some cover data, for example images, video or music. The concept of robustness refers to the ability to detect the watermark after common signal processing operations [20]. The generated watermark is usually embedded in the spatial domain or in some transform domain (DCT, DFT, DWT) in a multiplicative manner
mn =jn+γjnxn (14)
where mn is the nth pixel of the watermarked image M, jn is the nth pixel
of the cover image J, xn is the nth pixel of the watermark X. The constant γ is known as the embedding factor and controls the watermark strength. The multiplicative watermark embedding rule relies on “Weber’s Law”, which
indicates that the change in a stimulus that will be just noticeable is a constant ratio of the original stimulus [21], and may be expressed as
∆I
I =k (15)
whereIrepresents the initial intensity of a pixel, ∆Ithe change in the intensity of the pixel. k signifies that the proportion on the left hand side remains constant despite the value of I changing. In Eq. 14, γ controls the trade-off between watermark visibility and watermark robustness within the image. The lower the value of γ the less noticeable a watermark is within an image and therefore does not noticeably alter the perceived quality of the image [20]. Watermark Detection is the process of determining whether an image is wa-termarked with a certain watermark. In some watermarking applications, the original, unwatermarked image is available during detection, this process is referred to as informed detection. However, detection must generally be per-formed without access to the original image, known as blind detection. The majority of watermark detection techniques use a form of correlation detection. Correlation has been shown to be an effective and relatively simple technique for comparison of signals, and thus is very popular in watermark detection systems. An example of a correlation detector given by
ρ= 1 3NM N X i=1 M X j=1 I0(i, j)w(i, j) (16)
where N is the image width,M is the image height, I0 is the possibly
water-marked image and wis the watermark sequence [22]. This correlation value is compared to a suitably selected thresholdT and if the value of the correlation is greater than the threshold positive detection of the watermark is assumed. The motivation for the use of an optical detection technique is that optical processing is faster than a similar digital technique due to the inherent par-allelism of the system [23]. One technique to perform optical correlation is Matched Filtering [24,25] which has been shown to be an effective technique for watermark detection. For the optical detection system, the possibly water-marked image together with the watermark whose presence (or absence) in the image one wishes to determine are used as inputs to the detector. The water-mark is used as the filter for the matched filter detector. The optical detection technique returns an output image which is the correlation between the possi-bly watermarked image and the watermark. The presence of the watermark in the image is represented by a sharp correlation peak in the centre of the out-put plane. This correlation peak is compared to a threshold to determine the presence or absence of the watermark. For more detail on the optical detection scheme employed one may consult earlier work by the authors [26,27,19].
6 Power Spectrum
Pitas et al. have used the power spectrum or power spectral density (PSD) to determine if a particular generated watermark sequence is lowpass or high-pass in characteristics [3]. The power spectrum of a function is defined as the modulus-squared of the discrete Fourier Transform of some finite sampled section of it and is given by
P(u, v) =|F T[I(u, v)]|2 (17)
where P(u, v) is the power of a pixel (u, v), F T is the Fourier Transform and
I(x, y) is the image pixel whose power spectrum one is calculating. The power spectrum of the logistic map is
P(yn) =|F T[yn]|2 (18)
Examination of the power spectrum of the logistic map in the chaotic region, has shown that the general trend is a decrease in the power spectrum with increasing seed values. This suggests that more lowpass watermarks are gen-erated with higher values of the seeda, for example, the watermark generated when a = 3.7 is more highpass in nature than a watermark generated when
a= 3.9. [19], as can be seen in Fig. 5.
Fig. 5. Watermark produced when (a):a= 3.7 and (b):a= 3.9.
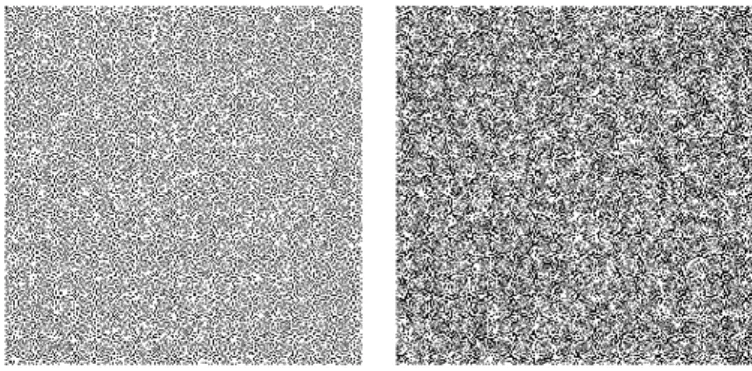
The power spectrum of other chaotic maps, for example the Markov map, may be used solely to determine the spectral properties of the map. However, the PSD can not be used in isolation for the logistic map for certain values of
a. One might expect that watermarks generated on either side of a periodic region within 3.57 ≤ a ≤ 4 would have similar spectral properties. However, by examining the PSD’s and also the generated watermarks it can be seen that this is not the case. Fig. 6 shows watermarks generated by a = 3.828 and a = 3.859 (either side of the period tripling region). It can be seen that there is a difference in the density variations in the watermark pixels and little similarity as their PSD’s suggest. Therefore, unlike other well behaved chaotic
maps the PSD alone may not be used to determine the lowpass and highpass properties of watermarks generated from the logistic map.
Fig. 6. Watermark produced when (a): a= 3.828 and (b):a= 3.859.
The watermarks generated using the logistic function have also been “at-tacked” using JPEG compression and noise addition. JPEG is a lossy com-pression technique designed to exploit known limitations of the human visual system, notably the fact that small changes in the image will go unnoticed when viewed by a human. Images processed by an optical system are often degraded by some random errors – this degradation is referred to as noise and may occur during image capture, transmission or processing [28]. Our stud-ies have shown [27,19,29] that, in general, as the watermarks used had more lowpass characteristics, determined using the PSD, increased robustness to JPEG compression was observed. This is what is expected as lowpass water-marks have increased robustness with respect to image distortions that have lowpass characteristics (filtering, nonlinear filtering such as median filtering, lossy compression etc.) [30]. The maximum level of noise corruption which the detector can detect the embedded watermark was determined for numerous seed values of the logistic map in [27]. It was found that lowpass watermarks generated in the chaotic region of the logistic function perform much better in the presence of noise than highpass watermarks.
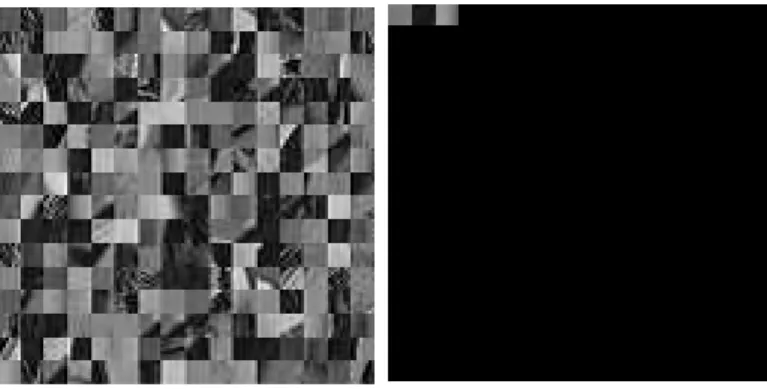
As a case study let us look at a previous study in “Chaos, Solitons and Frac-tals” by Dawei et al., [31], which used the logistic map in the generation and embedding of watermarks. Watermark embedding takes place locally in the wavelet domain and watermark detection is performed using a correlation technique between the watermarked pixels and the watermark pixels. In this study the logistic map is used in two instances. The logistic map is used to se-lect unique pixel blocks which will form a subimage. It is to this new subimage that the watermark is embedded before being replaced in the original image. Blocks of pixels of size 8×8 are selected from the original image based on the output from the iteration of the logistic mapping as shown in Fig. 7(a). The logistic map is also used to generate the watermark in a similar format to that presented in this paper in Eq. 8. The chaotic watermark is embedded into part of the subbands of the wavelet domain representation of the image, after
a three level wavelet decomposition. This watermarking algorithm is novel, efficient and is successfully robust against attacks.
However, if the user of this algorithm is unaware of the properties of the logistic map, watermark generation and embedding fails. When the map is seeded with a value which results in the map entering a periodic orbit, the algorithm breaks down as can be seen, for example, in Fig. 7(b). In this case the logistic map was seeded with a = 3.83, for use in the selection of pixel blocks, and it can be seen that only three blocks of pixels are selected for use as the subimage to be watermarked. Similar results are obtained for any of the periodic regions of the logistic map if a periodic orbit is generated. If the logistic map is seeded with a value which results in the orbit being periodic, for the purpose of watermark generation, similar watermarks are produced to those shown in Fig. 3(b). Users must be fully aware of the properties of the logistic map before using this robust watermarking application.
Fig. 7. Sample subimage generated from sequences of the logistic map where (a):
a= 3.924 and (b): a= 3.83.
7 Conclusion
In this paper, we have provided a detailed study of the generation of water-marks using the logistic map. The relevant properties of the logistic map were presented for the generation of optically detectable watermarks. It was shown how care must be taken in the selection of the function seed in the generation of chaotic watermarks. Reliance on the power spectrum alone is not enough to determine the spectral properties of the watermarks generated from the logistic map, unlike other well behaved chaotic maps, and has been presented here. A case study was presented based on another watermarking algorithm using the logistic map. We show that although this technique is an efficient robust watermarking technique but fails if the user is careless in the selection of the function seed of the logistic map.
References
[1] I. J. Cox, J. Killian, T. Leighton, and T. Shamoon, “Secure spread spectrum watermarking for images, audio, and video,” Proceedings of International Conference on Image Processing (ICIP’96)III, pp. 243–246, 1996.
[2] N. F. Johnson, Z. Duric, and S. Jojodia, Information Hiding: Steganography and Watermarking - Attacks and Countermeasures, Kluwer Academic, London, 2000.
[3] A. Tefas, A. Nikolaidis, N. Nikolaidis, V. Solachidis, S. Tsekeridou, and I.Pitas, “Markov chaotic sequences for correlation based watermarking schemes,”
Proceedings of Chaos, Solitons and Fractals17, pp. 567–573, 2003.
[4] A. Nikolaidis and I. Pitas, “Comparison of different chaotic maps with application to image watermarking,” Proceedings of IEEE International Symposium on Circuits and Systems, Geneva, pp. 509–512, 2002.
[5] S. Tsekeridou, V.Solachidis, N.Nikolaidis, A.Nikolaidis, A. Tefas, and I.Pitas, “Bernoulli shift generated watermarks: Theoretic investigation,”Proceedings of IEEE Int. Conf. on Acoustics, Speech and Signal Processing , pp. 1989–1992, 2001.
[6] Q. B. Sun, P. R. Feng, and R. Deng, “An optical watermarking solution for authenticating printed documents,” Proceedings of International. Conference on Information Technology: Coding and Computing , pp. 65–70, 2001.
[7] A. Herrigel, S. Voloshynovskiy, and Z. Hrytskiv, “An optical/digital identification/verification system based on digital watermarking technology,”
Proceedings of SPIE International Workshop on Optoelectronic and Hybrid Optical/Digital Systems for Image/Signal Processing, 1999.
[8] M. Marek and I. Schreiber, Chaotic Behaviour of Deterministic Dissipative, Cambridge University Press, Cambridge, 1991.
[9] D. M. Heffernan, P. Jenkins, M. Daly, B. J. Hawdon, and J. O. Gorman, “Characterization of chaos,” International Journal of Theoretical Physics 31, pp. 1345–1362, 1992.
[10] G. Belot and J. Earman, Chaos out of Order: Quantum Mechanics, the Corresponding Principles and Chaos, vol. 28, 1996.
[11] M. R. Titchener and W. Ebeling, “Deterministic chaos and information theory,”
Proceedings Data Compression Conference, 2001.
[12] W. Ebeling, R. Steuer, and M. R. Titchener, “Partition-based entropies of deterministic and stochastic maps,”Stochastics and Dynamics1, 2001.
[13] E. Ott,Chaos in Dynamical Systems, Cambridge, Cambridge, 1993. [14] H. G. Schuster,Deterministic Chaos: An Introduction, Wiley, Berlin, 1995.
[15] A. Lasota and M. C. Mackey, Chaos, Fractals and Noise - Stochastic Aspects of Dynmaics, Springer, London, 1994.
[16] G. R. Feng, L. G. Jiang, C. He, and Y. Xue, “Chaotic spread spectrum watermark of optimal space-filling curves,” Chaos, Solitons and Fractals 27, pp. 580 – 587, 2006.
[17] K. Yang and M. Mills, “Fractal based image coding scheme using peano scan,”
Proceedings of ISCAS ’881470, pp. 2301–2304, 1988.
[18] R. Stevens, A. F. Lehar, and F. Preston, “Manipulation and presentation of multidimensional image data using the peano scan,”Proceedings of IEEE Trans. Patterm Pattern Anal. Machine Intell. , pp. 520–526, 1983.
[19] A. Mooney and J. G. Keating, “The impact of the theoretical properties of the logistic function on the generation of optically detectable watermarks,”
Proceedings of SPIE, Technology for Optical Countermeasures5615, pp. 120 – 129, 2004.
[20] I. J. Cox, M. L. Miller, and J. A. Bloom, Digital Watermarking, Morgan Kaufmann, London, 2002.
[21] E. Britannica, “Encyclopaedia brittanica online.” Encyclopdia Britannica, 2005. [22] M. Barni, F. Bartolini, and A. Piva, “Improved wavelet-based watermarking through pixel-wise masking,” IEEE Trans. on Image Processing 10, pp. 783– 791, 2001.
[23] J. Rosen, “Three-dimensional optical fourier transform and correlation,”Optics Letters22, pp. 964–966, 1997.
[24] M. Shen, X. Zhang, L. Sun, P. J. Beadle, and F. H. Y. Chan, “A method for digital image watermarking using ica,” 4th International Symposium on Independent Component Analysis and Blind Signal Separation , pp. 209–214, 2003.
[25] A. Sequeira and D. Kundur, “Communication and information theory in watermarking: A survey,”Proceedings of Multimedia Systems and Applications IV, Proc. SPIE4518, pp. 216 – 227, 2001.
[26] A. Mooney and J. G. Keating, “Optical and digital technique for watermark detection,” Proceedings of SPIE, Optical Information Systems 5202, pp. 97– 105, 2003.
[27] A. Mooney and J. G. Keating, “Noisy optical detection of chaos-based watermarks,”Proceedings of SPIE, Photonics North5579, pp. 341 – 350, 2004. [28] M. Sonka, V. Hlavac, and R. Boyle,Image Processing, Analysis, and Machine
Vision-Second Edition, PWS Publishing, San Francisco, 1999.
[29] A. Mooney and J. G. Keating, “Generation and detection of watermarks derived from chaotic functions,”Proceedings of SPIE, Opto-Ireland: Imaging and Vision
[30] J. Fridrich, “Combining low-frequency and spread spectrum watermarking,”
Proceedings SPIE International Symposium on Optical Science, Engineering and Instrumentation, pp. 2–12, 1998.
[31] Z. Dawei, C. Guanrong, and L. Wenbo, “A chaos-based robust wavelet-domain watermarking algorithm,”Chaos, Solitons and Fractals22, pp. 47–54, 2004.