High-Speed Railway Lines in
Norway
Concept Evaluation,
Cost Estimate and
Uncertainty Analysis
Report 2: Quantitative results for
all corridors
Report to Jernbaneverket
Classification: None
Revision: Report 2, Rev 1.02
Date: October 31th, 2007
Analysis lead: Paul Torgersen
Co-writers: Jan Erik Eldor
Page 2
Executive Summary
Commission
Jernbaneverket has commenced an initiative, comprising three phases, to evaluate the strategy for
high-speed railway lines in Norway. Metier AS has been asked to facilitate concept evaluations and
the establishment of investment cost estimates including uncertainty analysis of the planned new
corridors in Norway.
The analysis is based on information that was gathered, assessed and scrutinized in
multidisciplinary workshops to obtain the most unbiased and complete picture of the project.
Operational and Technical Concept - Planning reference
The superior operational concepts – as a planning reference - are defined based on the objective of
“ousting air traffic on the distance at lowest cost”. Key parameters and assumptions are given in
section 1.5. The key-assumptions are:
1. Design speed 250 kph, exceptions on particular difficult parts
2. Train service: Hourly service in peak time for all corridors
3. Freight traffic: No daytime freight traffic on any of the corridors, except the corridor Oslo –
Gøteborg that can be combined with freight traffic.
4. Technology: Based on today’s technology, except for some special tunnels and special
constructions for fjord-crossings.
5. Single-track lines on all corridors, except for the corridors Oslo to Bergen and Stavanger via
Haukeli which are double-track lines.
Investment Costs
The present investment cost estimates include necessary infrastructure and trains. Unit prices are
based on prices from recently finished and ongoing comparable railway projects in Norway and
Sweden. Future price escalation is not included in the present analysis according to ordinary
planning guidelines for large public projects in Norway. The below diagram illustrates, for each
corridor, the expected cost per length of new track in addition to share of bridges, tunnels and open
line.
Page 3
Key figures and cost per length new track
0 %
10 %
20 %
30 %
40 %
50 %
60 %
70 %
80 %
90 %
100 %
Osl o - T rond heim Osl o - G øteb org Osl o - B erge n (H allin gdal ) Osl o - B erge n (H auke li) Hau keli - Sta vang er Osl o - B erge n (N um edal ) Berg en - Sta vang er Stav ange r - K ristia nsan d Kris tians and - Osl o%
s
h
a
re
o
f
to
ta
l
le
n
g
th
n
e
w
t
ra
c
k
0
50
100
150
200
250
300
350
400
450
500
C
o
s
t
p
e
r
le
n
g
th
n
e
w
t
ra
c
k
(M
N
O
K
/k
m
)
Bridges s hare (%) Tunnel share (%) Open line share (%)Cost per length new track (MNOK/km)
Figure 1 Key figures and cost per length new track
The three major uncertainties are:
• Level of planning: The project foundation is at prefeasibility level and is thus bond with high
uncertainty in general.
• Contractors and materials market: This is mainly due to the risk of major shortages in
contractor capacity. A heated world market in materials may amplify this effect.
• Project ownership: This is mainly due to the risk of a non-optimal funding program, program
deviations and owners indecisiveness.
Page 4
Table of Contents
1
INTRODUCTION... 5
1.1
C
OMMISSION
... 5
1.2
D
ISPOSITION
... 5
1.3
D
OCUMENT
B
ASIS
... 6
1.4
G
ENERAL
A
NALYSIS
A
SSUMPTIONS
... 6
1.5
P
ROJECT
/
CORRIDOR DESCRIPTIONS
... 7
2
OPERATIONAL AND TECHNICAL CONCEPT - PLANNING REFERENCE... 9
3
RESULTS ... 10
4
CONCLUSION ... 13
APPENDIX 1
STUDY APPROACH – DETAILS ... 15
APPENDIX 2
GENERIC ESTIMATE STRUCTURE... 17
APPENDIX 3
INPUT: DETERMINISTIC ESTIMATE - QUANTITIES... 19
APPENDIX 4
INPUT: DETERMINISTIC ESTIMATE - UNIT PRICES... 22
APPENDIX 5
INPUT: UNCERTAINTY ANALYSIS – BASE COST ESTIMATE ... 29
APPENDIX 6
INPUT: UNCERTAINTY ANALYSIS – UNCERTAINTY DRIVERS ... 31
APPENDIX 7
INPUT: UNCERTAINTY ANALYSIS – CORRELATIONS ... 36
Page 5
1 Introduction
1.1 Commission
Jernbaneverket has commenced an initiative, comprising three phases, to evaluate the strategy for
high-speed railway lines in Norway. Metier AS has been asked to facilitate concept evaluations and
the establishment of investment cost estimates including uncertainty analysis of the planned new
corridors in Norway.
The present report comprises the following corridors and new tracks:
•
Corridor Oslo – Trondheim: New track Sørli - Heimdal
• Corridor Oslo – Gøteborg: New track Råde – Swedish border
•
Corridor Oslo – Bergen via Hallingdalen: New track Hønefoss - Bergen
• Corridor Oslo – Bergen via Haukeli: New track Drammen - Bergen
• Corridor Haukeli – Stavanger: All new track
• Corridor Oslo – Bergen via Numedalen: New track Drammen - Bergen
• Corridor Bergen – Stavanger: All new track
•
Corridor Stavanger – Kristiansand: All new track
• Corridor Oslo – Kristiansand: New track Porsgrunn - Kristiansand
1.2 Disposition
The present report should be considered as an amendment and only be considered in conjunction
with the report: “High-Speed Railway Lines in Norway – Concept evaluation, Cost Estimate and
Uncertainty Analysis - Report 1: Basic assumptions and methodology, and calculations for the
corridor Trondheim – Oslo, Rev. 2.2, dated September 11th, 2007”.
Appendix 1 gives a brief summary of the participant of the study and the approach and
methodology used.
Detailed analysis input data is presented in the following appendices:
•
Appendix 2
Generic estimate structure
• Appendix 3
Input: Deterministic Estimate - Quantities
• Appendix 4
Input: Deterministic Estimate - Unit Prices
• Appendix 5
Input: Uncertainty Analysis – Cost Elements
• Appendix 6
Input: Uncertainty Analysis – Uncertainty Drivers
• Appendix 7
Input: Uncertainty Analysis – Correlations
Note! There might be minor result deviations between and within the reports due to different
simulation runnings.
Page 6
1.3 Document Basis
[ 1]
Feasibility Study Concerning high-speed railway lines in Norway, Report Phase 1,
2006-12-15
[ 2]
Feasibility Study Concerning High-Speed Railway Lines in Norway, WP 300:
High-Speed-Railway-Specific Conditions, 2006-12-19
[ 3]
Map, scale 1:250.000
[ 4]
High-Speed Railway Lines in Norway – Concept evaluation, Cost Estimate and Uncertainty
Analysis - Report 1: Basic assumptions and methodology, and calculations for the corridor
Trondheim – Oslo, Rev. 2.03, dated October 30th, 2007
[ 5]
High Speed Railway Lines in Norway – Power Supply Converter Stations including High
Voltage Supply - Input to Cost Estimate, Rev.000, dated august 21
st, 2007
[ 6]
Kvalitetssikring grunnerverv, memo, august 29th, 2007
[ 7]
Hengebru som jernbanebru, memo from Aas Jacobsen, september 4
th, 2007
1.4 General Analysis Assumptions
The analysis is based on the following general assumptions:
Cost Basis:
2007 Norwegian kroner
Future
Price
Escalation
(inflation):
Not included in the present analysis according to ordinary planning
guidelines for large public projects in Norway.
Metier’s comment: Price escalation for construction projects has in
recent years been larger than the regular inflation. This is basically
due to material price and salary escalations.
Finances:
Government allowances with project optimized funding and
professional ownership. Finance costs (e.g. interest on building loans
is not included).
Government Dues:
All numbers are exclusive of VAT according to prevailing regulations
for railway in Norway.
Planned
Schedule
for the investments:
Not detailed out on this planning level.
Removal
of
old
lines:
Removal of old line is not included in the cost estimate. Use of
existing lines is not decided at this planning level.
Market
and
contracts:
Balanced market (Europe) through long term market development
strategies. Unit price contracts. The implementation of such a project
could overheat the construction market and jeopardise normal price
relations for the whole business line. It may be argued, however, that
given predictable financing conditions and large, long horizon
contracts, this kind of large project will create its own market much
like the situation has been for the oil & gas and hydropower industries
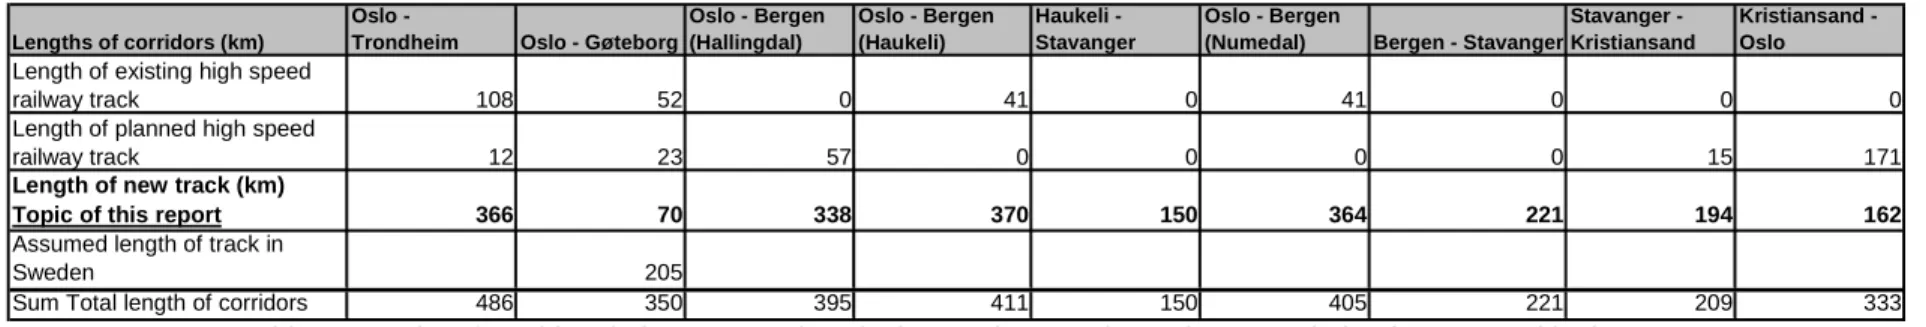
1.5 Project/corridor descriptions
Lengths of corridors (km)Oslo -
Trondheim Oslo - Gøteborg
Oslo - Bergen (Hallingdal) Oslo - Bergen (Haukeli) Haukeli - Stavanger Oslo - Bergen
(Numedal) Bergen - Stavanger
Stavanger - Kristiansand
Kristiansand - Oslo
Length of existing high speed
railway track 108 52 0 41 0 41 0 0 0
Length of planned high speed
railway track 12 23 57 0 0 0 0 15 171
Length of new track (km)
Topic of this report 366 70 338 370 150 364 221 194 162
Assumed length of track in
Sweden 205
Sum Total length of corridors 486 350 395 411 150 405 221 209 333
Table 1 Lengths of corridors in km. Note! It is only the previous unplanned new track that is assessed in the report.
Note that the corridors listed below noted “Existing and planned high speed railway” only comprises parts applicable to high speed
standards. Despite their restrictions with respect to speed, they will be used by the high speed railway.
Detailed assumptions:
Oslo – Trondheim
Existing and planned high speed railway: Trondheim – Heimdal (12 km), Sørli – Eidsvoll (ca. 42 km) and
Eidsvoll – Oslo (ca 66 km)
New track: Heimdal – Sørli (366 km): Topic of the report Concept evaluation, Cost estimate and Uncertainty
Analysis, doc.no 1 dated May 29
th2007.
Oslo – Gøteborg
Existing and planned high speed railway: Oslo – Ski (already planned, 23 km), Ski – Moss (already built, 35
km), Moss – Råde (partly built, 17 km) and Swedish border – Gøteborg (205 km)
Existing lines not anticipated for high speed concept (160 to 200 kph)
New track: Råde – Swedish border (70 km)
Oslo – Bergen via
Hallingdalen
Existing and planned high speed railway: Oslo – Sandvika (14 km) and Sandvika – Hønefoss (43 km)
New track: Hønefoss – Bergen (338 km)
Oslo – Bergen via
Haukeli
Existing and planned high speed track: Oslo – Drammen (41 km)
New track: Drammen – Bergen (370 km)
Oslo – Bergen via
Numedalen
Existing and planned high speed railway: Oslo - Drammen (41 km)
New track: Drammen – Bergen (364 km)
Bergen – Stavanger
New track: Bergen – Stavanger (221 km)
Stavanger
–
Kristiansand
Existing and planned high speed railway: Stavanger - Sandnes (max speed 95 kph, 15 km)
New track: Sandnes – Kristiansand (194 km)
Oslo – Kristiansand
Existing and planned high speed railway: Oslo – Porsgrunn (171 km, planned Oslo – Porsgrunn, 160 to 200
kph with some exceptions)
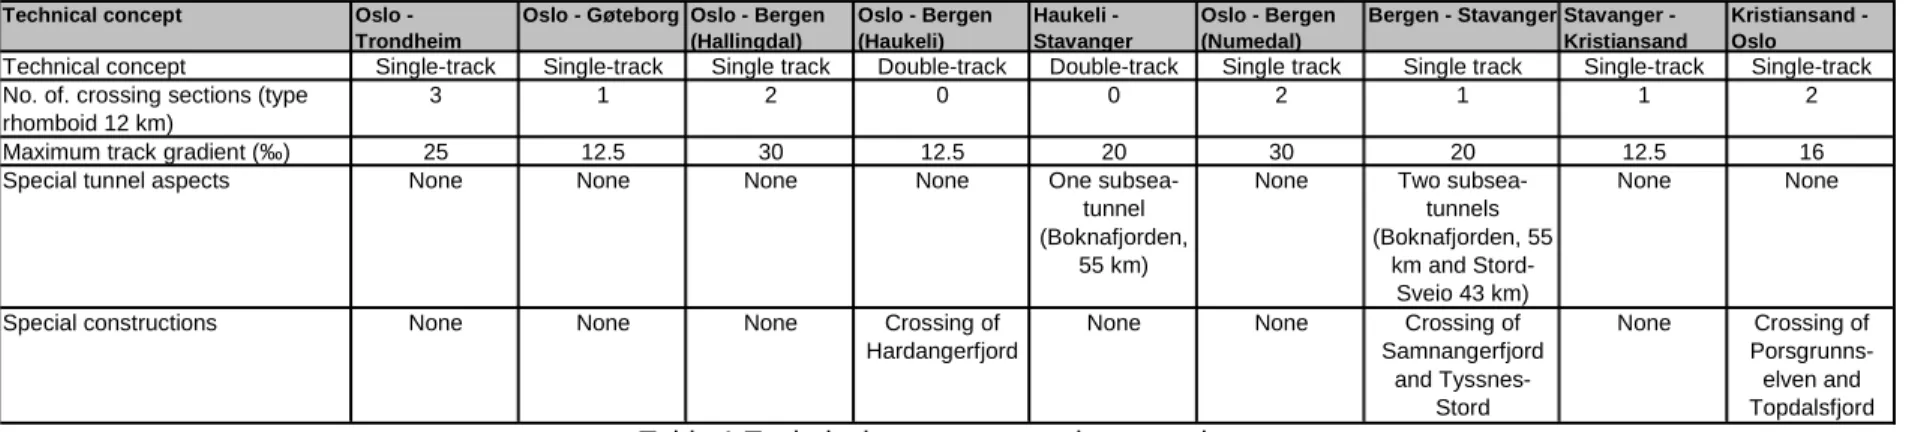
2 Operational and Technical Concept - Planning reference
The following superior technical concept was defined based on the objective of “ousting air traffic on the distance at lowest cost”.
Technical concept Oslo -
Trondheim
Oslo - Gøteborg Oslo - Bergen (Hallingdal) Oslo - Bergen (Haukeli) Haukeli - Stavanger Oslo - Bergen (Numedal)
Bergen - Stavanger Stavanger - Kristiansand
Kristiansand - Oslo
Technical concept Single-track Single-track Single track Double-track Double-track Single track Single track Single-track Single-track
No. of. crossing sections (type rhomboid 12 km)
3 1 2 0 0 2 1 1 2
Maximum track gradient (‰) 25 12.5 30 12.5 20 30 20 12.5 16
Special tunnel aspects None None None None One subsea-
tunnel (Boknafjorden,
55 km)
None Two subsea-
tunnels (Boknafjorden, 55
km and Stord-Sveio 43 km)
None None
Special constructions None None None Crossing of
Hardangerfjord
None None Crossing of
Samnangerfjord and Tyssnes-Stord None Crossing of Porsgrunns-elven and Topdalsfjord
Table 1 Technical parameters and assumptions
General operational and technical assumptions:
1. Design speed 250 kph, except on particular difficult parts
2. Train service: Hourly service in peak time for all corridors
3. Technology: Based on today’s technology, except for the special tunnels and special constructions mentioned above.
4. Tracks: Traditional ballast tracks on open line and slabtrack in long tunnels
5. Signalling system: ERTMS-2 and use of GSMR and GPRS
6. Tunnels:
•
Size: 75 m
2•
Tunnel rescue according to EU requirements. Double-track: Connections every 500 m. Single track: Exits every 1000 m.
•
Single track concept: Single track as much as possible. For tunnels longer than 10 km: Twin tunnels, one for rescue (same size).
For shorter tunnels rescue-tunnels have size: 35 m
2. Using existing tunnels as rescue-tunnels at Finse and Voss – Bergen.
7. Freight traffic: No daytime freight traffic on any of the corridors, except the corridor Oslo – Gøteborg that can be combined with
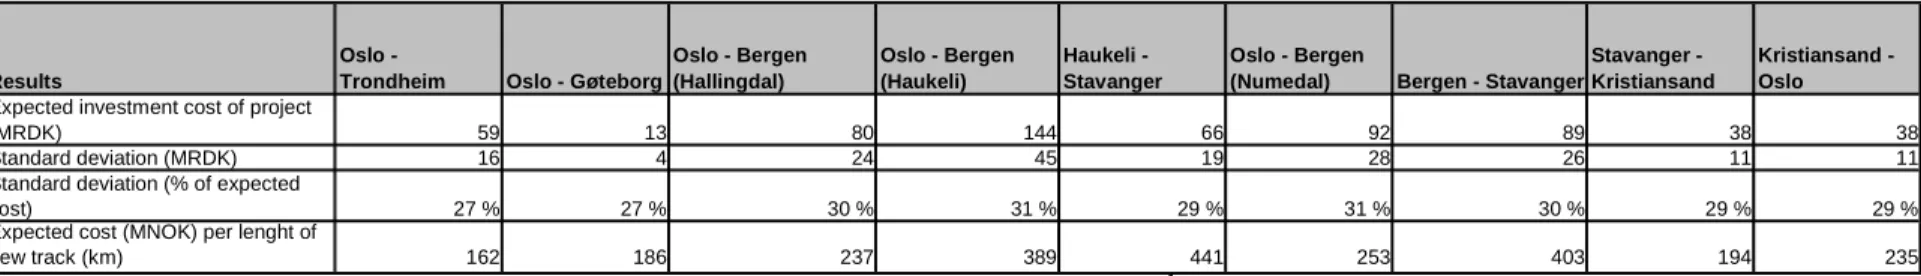
3 Results
The table below presents a summary of the results derived from the analysis.
Results
Oslo -
Trondheim Oslo - Gøteborg
Oslo - Bergen (Hallingdal) Oslo - Bergen (Haukeli) Haukeli - Stavanger Oslo - Bergen
(Numedal) Bergen - Stavanger
Stavanger - Kristiansand
Kristiansand - Oslo
Expected investment cost of project
(MRDK) 59 13 80 144 66 92 89 38 38
Standard deviation (MRDK) 16 4 24 45 19 28 26 11 11
Standard deviation (% of expected
cost) 27 % 27 % 30 % 31 % 29 % 31 % 30 % 29 % 29 %
Expected cost (MNOK) per lenght of
new track (km) 162 186 237 389 441 253 403 194 235
Table 2 Summary results (MRDK)
1The results are presented in the below figure, illustrating the expected investment cost for the corridors and the expected cost per length
of new track.
Expected investment cost and cost per length new track
0
20
40
60
80
100
120
140
160
O
sl
o
- T
ro
nd
he
im
O
sl
o
- G
øt
eb
or
g
O
sl
o
- B
er
ge
n
(H
al
lin
gd
al
)
O
sl
o
- B
er
ge
n
(H
au
ke
li)
H
au
ke
li
-
S
ta
va
ng
er
O
sl
o
- B
er
ge
n
(N
um
ed
al
)
B
er
ge
n
- S
ta
va
ng
er
S
ta
va
ng
er
-
K
ris
tia
ns
an
d
K
ris
tia
ns
an
d
-
O
sl
o
E
x
p
e
c
te
d
i
n
v
e
s
tm
e
n
t
c
o
s
t
(M
rd
N
O
K
)
0
50
100
150
200
250
300
350
400
450
500
C
o
s
t
p
e
r
le
n
g
th
n
e
w
t
ra
c
k
(M
N
O
K
/k
m
)
Expected investment
cost (MrdNOK)
Cost per length new
track (MNOK/km)
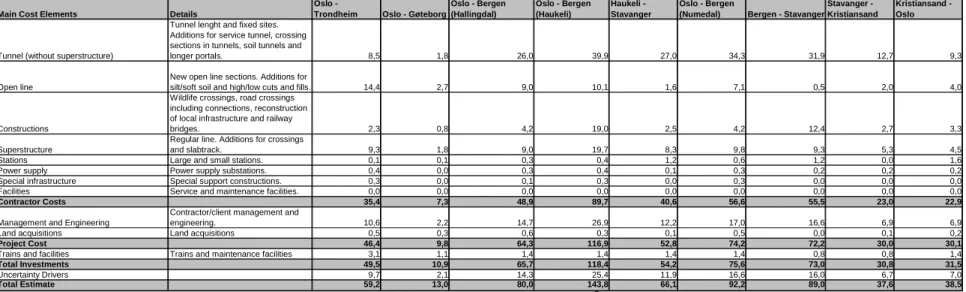
The table below presents detailed results in terms of main cost elements for the corridors.
Main Cost Elements Details
Oslo -
Trondheim Oslo - Gøteborg
Oslo - Bergen (Hallingdal) Oslo - Bergen (Haukeli) Haukeli - Stavanger Oslo - Bergen
(Numedal) Bergen - Stavanger
Stavanger - Kristiansand
Kristiansand - Oslo
Tunnel (without superstructure)
Tunnel lenght and fixed sites. Additions for service tunnel, crossing sections in tunnels, soil tunnels and
longer portals. 8,5 1,8 26,0 39,9 27,0 34,3 31,9 12,7 9,3
Open line
New open line sections. Additions for
silt/soft soil and high/low cuts and fills. 14,4 2,7 9,0 10,1 1,6 7,1 0,5 2,0 4,0
Constructions
Wildlife crossings, road crossings including connections, reconstruction of local infrastructure and railway
bridges. 2,3 0,8 4,2 19,0 2,5 4,2 12,4 2,7 3,3
Superstructure
Regular line. Additions for crossings
and slabtrack. 9,3 1,8 9,0 19,7 8,3 9,8 9,3 5,3 4,5
Stations Large and small stations. 0,1 0,1 0,3 0,4 1,2 0,6 1,2 0,0 1,6
Power supply Power supply substations. 0,4 0,0 0,3 0,4 0,1 0,3 0,2 0,2 0,2
Special infrastructure Special support constructions. 0,3 0,0 0,1 0,3 0,0 0,3 0,0 0,0 0,0
Facilities Service and maintenance facilities. 0,0 0,0 0,0 0,0 0,0 0,0 0,0 0,0 0,0
Contractor Costs 35,4 7,3 48,9 89,7 40,6 56,6 55,5 23,0 22,9
Management and Engineering
Contractor/client management and
engineering. 10,6 2,2 14,7 26,9 12,2 17,0 16,6 6,9 6,9
Land acquisitions Land acquisitions 0,5 0,3 0,6 0,3 0,1 0,5 0,0 0,1 0,2
Project Cost 46,4 9,8 64,3 116,9 52,8 74,2 72,2 30,0 30,1
Trains and facilities Trains and maintenance facilities 3,1 1,1 1,4 1,4 1,4 1,4 0,8 0,8 1,4
Total Investments 49,5 10,9 65,7 118,4 54,2 75,6 73,0 30,8 31,5
Uncertainty Drivers 9,7 2,1 14,3 25,4 11,9 16,6 16,0 6,7 7,0
Total Estimate 59,2 13,0 80,0 143,8 66,1 92,2 89,0 37,6 38,5
Table 3 Summary results (MrdNOK)
24 Conclusion
The analysis is based on information that was gathered, assessed and scrutinized in multidisciplinary workshops to obtain the most
unbiased and complete picture of the project.
Operational and Technical Concept - Planning reference
The superior operational concepts – as a planning reference - are defined based on the objective of “ousting air traffic on the distance at
lowest cost”. Key parameters and assumptions are given in section 1.5. The key-assumptions are:
1. Design speed 250 kph, exceptions on particular difficult parts
2. Train service: Hourly service in peak time for all corridors
3. Freight traffic: No daytime freight traffic on any of the corridors, except the corridor Oslo – Gøteborg that can be combined with
freight traffic.
4. Technology: Based on today’s technology, except for some special tunnels and special constructions for fjord-crossings.
5. Single-track lines on all corridors, except for the corridors Oslo to Bergen and Stavanger via Haukeli which are double-track lines.
Investment Costs
The present investment cost estimates include necessary infrastructure and trains. Cost basis is 2007 Norwegian kroner. Unit prices are
based on prices from recently finished and ongoing comparable railway projects in Norway and Sweden. Future price escalation is not
included in the present analysis according to ordinary planning guidelines for large public projects in Norway. Other general assumptions
are documented in chapter 2 “Operational and Technical Concept - Planning reference”.
The below diagram illustrates, for each corridor, the expected cost per length of new track in addition to share of bridges, tunnels and
open line.
Key figures and cost per length new track
0 %
10 %
20 %
30 %
40 %
50 %
60 %
70 %
80 %
90 %
100 %
O
sl
o
- T
ro
nd
he
im
O
sl
o
- G
øt
eb
or
g
O
sl
o
- B
er
ge
n
(H
al
lin
gd
al
)
O
sl
o
- B
er
ge
n
(H
au
ke
li)
H
au
ke
li
- S
ta
va
ng
er
O
sl
o
- B
er
ge
n
(N
um
ed
al
)
B
er
ge
n
- S
ta
va
ng
er
S
ta
va
ng
er
-
K
ris
tia
ns
an
d
K
ris
tia
ns
an
d
- O
sl
o
Corridors
%
s
h
a
re
o
f
to
ta
l
le
n
g
th
n
e
w
t
ra
c
k
0
50
100
150
200
250
300
350
400
450
500
C
o
s
t
p
e
r
le
n
g
th
n
e
w
t
ra
c
k
(M
N
O
K
/k
m
)
Bridges share (%)
Tunnel share (%)
Open line share (%)
Cost per length new track (MNOK/km)
Figure 3 Key figures and cost per length new track
The three major uncertainties are:
•
Level of planning: The project foundation is at prefeasibility level and is thus bond with high uncertainty in general.
•
Contractors and materials market: This is mainly due to the risk of major shortages in contractor capacity. A heated world market
in materials may amplify this effect.
•
Project ownership: This is mainly due to the risk of a non-optimal funding program, program deviations and owners
indecisiveness.
Appendix 1
Study approach – Details
Main approach and group meetings
The analysis is based on information that was gathered, assessed and scrutinized in multidisciplinary workshops to obtain the most
unbiased and complete picture of the project. The team included people from the German group of VWI with partners, Jernbaneverket,
Sintef, NGI, Direktoratet for Naturforvaltning, Asplan Viak and Metier. Metier facilitated the workshops.
The input to the concept evaluation and uncertainty analysis has been gathered in workshops with different experts. The most important
workshops for the corridor Oslo – Trondheim have been:
•
February 27-28.: Concept evaluation, estimation of quantities and uncertainty analysis
•
March 2.: Need Energy-supply/consumption
•
March 23.: Commissioning of uncertainty analysis
•
The most important workshops for the other corridors have been:
•
June 19-20.: Concept evaluation, estimation of quantities and uncertaint analysis
•
August 14-15.: Concept evaluation, estimation of quantities and uncertaint analysis
The following table presents the group-sessions participants.
Workshops
Name
Role in study/Competance Company
27.2
28.2
2.3
23.3
19.6
20.6
14.8
15.8
Peter Sautter
Alignment, costs
IGV
X
X
X
X
X
X
X
X
Jochen Rowas
Alignment, costs
LFS
X
X
X
Finn Holom
Railway alignment
JBVU
X
Christian Knittler
High speed expert
JBV
X
X
X
X
X
Per Herman Sørlie
Railway alignment
JBVU
X
X
X
X
X
X
Runar Gravdal
Costs
JBVU
X
X
X
X
X
X
Frode Johnsen
Energy-supply/consumption JBV
X
X
Roger Olsson
Geology
NGI
X
X
X
X
X
X
Anders Beitnes
Tunnel
SINTEF
X
X
X
X
X
X
Terje Eidsmoen
Railway
JBV
X
X
X
Halstein Gåsemyr
Wheel/track
JBV
X
X
X
Erik Stabell
Environmental impacts
Direktoratet
for naturforvalting
Workshops
Name
Role in study/Competance Company
27.2
28.2
2.3
23.3
19.6
20.6
14.8
15.8
Randi Birgitte Svånå
Projectleader Jernbaneverket Asplan Viak
X
X
X
X
X
X
Paul Torgersen
Facilitator
Metier
X
X
X
X
X
X
X
X
Jan Erik Eldor
Facilitator
Metier
X
X
X
X
X
X
X
X
Table 2 Contributors to the analysis (participation on workshops)
Method for concept evaluation and establishment of deterministic cost estimate
The Concept Evaluation and establishment of the deterministic estimate consisted of the following activities:
1. Establishment of a most likely operational concept based on the input from the Feasibility Study from the VWI with partners.
2. Establishment of key parameters and assumptions.
3. Establishment of investment cost estimate structure on pre-feasibility level including descriptions and delimitations of cost-elements.
4. Evaluation and re-estimation of quantities.
5. Estimation of unit prices based on relevant reference-projects.
Method for the Uncertainty Analysis
The Uncertainty analysis has been performed according to Metier’s standard methodology for uncertainty analysis The Complete Risk
Manager, using the software tools Risk View and Crystal Ball.
The quantitative analysis is based on a 10/90 model, meaning that the extremities in the triple estimates are quoted as the 10
%-percentile for the minimum value and the 90 %-%-percentile for the maximum value. All parameters are assumed triangular distributed. The
mean value, standard deviation and sensitivities are found by Monte Carlo simulation.
The following main activities were performed:
1. Project characteristics and situation map. The situation map is a graphical representation of the group’s understanding of the project
with respect to specific parameters.
2. Identification of uncertainties facing the concepts.
3. Grouping uncertainties into uncertainty drivers in addition to scenario descriptions of the uncertainty drivers into a planning
reference, a best-case scenario and a worst-case scenario.
4. Quantitative cost analysis, comprising distribution curves and uncertainty profiles, including standard deviation and specific
percentiles.
5. Action/activities prioritization and conclusions.
6. Deterministic estimate - Quantities
Appendix 2
Generic estimate structure
The table below present the generic estimate structure – example corridor Trondheim – Oslo.
Cost elements Unit Prices Total Cost Total Cost
Main ID Detailed Running line
Basis Key assum.
Estimate value
Unit Assumptions Estimate value
Unit (deterministic value)
ID Description Most likely Most likely (expected value) [km] [MNOK/unit] [MNOK] % Value Value Value % % Value Value Value % [MNOK] 1.1 Per lenght - Single track 72 60 20 % 72 km Includes soiltunnels and longer portals. 75 MNOK/km 5 400 1.1 Tunnels Basis (without
superstructure)
-24 % 55 72 100 39 % -27 % 55 75 90 20 % 5 575 1.2 Per lenght - Single track - parallelle 0 km - - -
1.3 Per lenght - Single track - poor rock conditions
0 km - - -
1.4 Per lenght - Double track 0 km - - -
1.5 Special tunnels (Single track) along the hillside
0 km - - - 1.2 Special tunnels (Single track) along the hillside
0 0
1.6 Fixed (pr. sites) 25 Sites 20 MNOK/site 500 1.3 -32 % 2122 3120 3619 16 % 2 898 1.7 Fixed (pr. sites) - virgin area 0 Sites - - -
1.8 Addition for service tunnel 60 km For tunnels longer than 800 m. 35 MNOK/km 2 100
1.9 Addition for passing loops in tunnel 10 km Major part of crossing section in Soknedalen is in tunnel, elsewhere none. Assume 0.8 crossing sections in tunnel.
40 MNOK/km 400
1.10 Addition for soil tunnels and longer portals - Single track
2 km Cut&cover tunnels + portal structures. 60 MNOK/km 120
1.11 Addition for soil tunnels and longer portals - Double track
0 km - - -
1.12 Special underground sites for long distance tunnels
0 Sites - - -
1.13 Special complex underground sites for long distance tunnels
0 Sites - - -
1.14 Addition for subsea tunnel 0 km - - -
Open line 2.1 New open line sections, even terrain - Single track
284 284 km Includes fences and drainage, frost insulation, landscaping and minor waterway crossings. Smaller wildlife crossing. Protection measures for integrity of the line.
20 MNOK/km 5 670 2.1 Open line Basis (without superstructure)
279 -25 % 15 20 30 50 % 6 169
2.2 New open line sections, even terrain - Double track
0 km Includes fences and drainage, frost insulation, landscaping and minor waterway crossings. Smaller wildlife crossing. Protection measures for integrity of the line.
- - -
2.3 Junctions/Links to existing lines 0 km - - - 2.2 Junctions/Links to existing lines
0
2.4 Additons for proximity to existing lines (Oslo - Bergen, Hallingdal)
0 km - - - 2.3 Additons for proximity to existing lines
0
2.6 Additons for proximity to existing lines (Oslo - Bergen, Numedal)
0 km - - -
2.7 Addition for silt soil 25 % 71 km 25 % of total running line, Outside fill
areas 15
MNOK/km 1 063 2.4 -50 % 1134 2268 4536 100 % 2 753 2.8 Addition for soft soil - Single track 17 % 48 km 17% of total running line 25 MNOK/km 1 205
2.9 Addition for soft soil - Double track 0 km - - -
2.10 Addition for low cuts/fills - Single track 50 % 142 km 50 % of total running line. Less than 5 m, average 4 m 15
MNOK/km 2 126 2.5 -50 % 1914 3827 9568 150 % 5 495 2.11 Addition for low cuts/fills - Double track 0 km - - -
2.12 Addition for high cuts/fills - Single track 20 % 57 km 20 % of total running line. Larger than 5 m, average 10 m 30
MNOK/km 1 701
2.13 Addition for high cuts/fills - Double track 0 km - - -
3.1 Wildlife crossings - Single track 284 2 142 nr of const. 1 per 2 km. 3 MNOK/Con 354 3.1 Crossings (wild life and roads)
-50 % 295 591 1181 100 % 717 3.2 Wildlife crossings - Double track 0 nr of const. - - -
3.3 Road crossings including connections - Single track
284 3 95 nr of const. 1 per 3 km. Assume that wildlife crossings sometimes used as road crossings 3
MNOK/Con 236
3.4 Road crossings including connections - Double track
0 nr of const. - - -
3.5 Reconstruction of local villages infrastructure
25 nr of sites - 10 MNOK/Con 250 3.2 Reconstruction of local infrastructure
-50 % 125 250 500 100 % 304 3.6 Reconstruction of local town
infrastructure
0 nr of local
sites -
- -
3.7 Reconstruction of local infrastructure (Oslo - Kristiansand)
0 nr of sites - - -
3.8 Railway bridges - Single track 11 7 50 % 11 km Identified 7 km, non-identified
approximately 50%. 120
MNOK/km 1 260 3.3 Railway bridges -33 % 7 11 14 33 % -30 % 84 120 156 30 % 1 264 3.9 Railway bridges - Double track 0 km - - -
3.10 Addition for Hardangefjord-crossing 0 nr of const. - - - Additions for special crossings
0
3.11 Addition for Samnangerfjord-crossing 0 nr of const. - - -
3.12 Addition for Tyssnes/Stord-crossing 0 nr of const. - - -
3.13 Additions for Porsgrunnselven 0 nr of const. - - -
3.14 Additions for Topdalsfjord-crossing 0 nr of const. - - -
3.15 Additional for snow protection Hardangervidda
0 Lump sum - - - Additions for snow protection
0
3.16 Additional for snow protection Hardangervidda and Sangefjell
0 Lump sum - - -
Constructions
Cost estimate (deterministic/most likely)
Quantities
Tunnel (without superstructure)
Tunnels Additions (without superstructure)
Pessimistic
Open line Poor soil additions
Open line Cuts/fills additions
Uncertainty analysis
Optimistic Elements
Optimistic Pessimistic
Cost elements Unit Prices Total Cost Total Cost Main ID Detailed Running
line
Basis Key assum.
Estimate value
Unit Assumptions Estimate value
Unit (deterministic value)
ID Description Most likely Most likely (expected value) [km] [MNOK/unit] [MNOK] % Value Value Value % % Value Value Value % [MNOK] 4.1 Regular line - Single track 366 366 km Tunnels, bridges and open line. 24 MNOK/km 8 784 4.1 Superstructure Regular
line
-25 % 6588 8784 9487 8 % 8 127 4.2 Regular line - Double track 0 km - - -
4.3 Additional for passing loops 36 km 3 crossings. 21 MNOK/km 756 4.2 Superstructure Additions for crossings
-25 % 567 756 816 8 % 700 4.4 Additional for slabtrack - Single track 72 90 % 65 km Assume 90% of total length of tunnels. 7 MNOK/km 454 4.3 Superstructure Additional
for slabtrack
-29 % 322 454 649 43 % 480 4.5 Additional for slabtrack - Double track 0 km - - -
Stations 5.1 Large station 0 Station - - - 5.1 Stations -23 % 100 130 200 54 % 148 5.2 Large station at Stange 1 Station Stange, 3 tracks. 90 MNOK/station 90
5.3 Large station at Voss 0 Station - - -
5.4 Large Station at Sarpsborg 0 Station - - -
5.5 Large station at Kongsberg 0 Station - - -
5.7 Large station at Stavanger 0 Station - - -
5.8 Large station Porsgrunn 0 Station - - -
5.9 Large station Kristiansand 0 Station - - -
5.10 Small station 2 Station Koppang and Tynset. 20 MNOK/station 40
5.10 Small station (Haugesund) 0 Station - - -
Power supply 6.1 Power supply substations including HV-lines - Oslo - Trondheim
1 428 MNOK 428 6.1 Power supply -25 % 321 428 535 25 % 427 6.2 Power supply substations including
HV-lines - Oslo - Gøteborg
0 - - -
6.3 Power supply substations including HV-lines - Oslo - Bergen (Hallingdal)
0 - - -
6.4 Power supply substations including HV-lines - Oslo - Bergen (Haukeli)
0 - - -
6.5 Power supply substations including HV-lines - Haukeli - Stavanger
0 - - -
6.7 Power supply substations including HV-lines - Oslo - Bergen (Numedal)
0 - - -
6.8 Power supply substations including HV-lines - Bergen - Stavanger
0 - - -
6.9 Power supply substations including HV-lines - Stavanger - Kristiansand
0 - - -
6.10 Power supply substations including HV-lines - Oslo - Kristiansand
0 - - -
Special infrastructure 7.1 Special support Constructions infrastructure
2 sites - 100 MNOK/site 200 7.1 Special support Constructions infrastructure
-50 % 100 200 500 150 % 287 Facilities 8.1 Service and maintenance facilities 2 Stations - 20 MNOK/station 40 8.1 Service and maintenance
facilities
-10 % 36 40 44 10 % 40
Contractor Costs 33 177 Contractor Costs 35 385
9.1 Contractor Management and Engineering
1 na Include detailed engineering and
warranties. 15 % of Contractor Cost 4 977 9.1 Contractor Management and Engineering 12 % 15 % 25 % 6 400 9.2 Client Management and Engineering 1 na Preinvestigation, studies, strategies and
planning. Engineering. 12 % of Contractor
Cost
3 981 9.2 Client Management and Engineering
8 % 12 % 16 % 4 258 Land acquisitions 10.1 Land acquisitions Oslo - Trondheim 1 2 % of Open Line
Cost
664 10.1 Land acquisitions 0,5 % 2,0 % 3,5 % 465 10.2 Land acquisitions Oslo - Gøteborg 0 % - -
10.3 Land acquisitions Oslo - Bergen 0 % - -
10.4 Land acquisitions Oslo - Bergen 0 % - -
10.5 Land acquisitions Haukeli - Stavanger 0 % - -
10.6 Land acquisitions Oslo - Bergen 0 % - -
10.7 Land acquisitions Bergen - Stavanger 0 % - -
10.8 Land acquisitions Stavanger - 0 % - -
10.9 Land acquisitions Oslo - Kristiansand 0 % - -
Project Cost 366 km 42 799 Project Cost 46 508
11.1 Trains 12 trains - 112 MNOK/Train 1 344 11.1 -29 % 2317 3264 3754 15 % 3 071 11.2 Maintenance facilities 1 site - 1 920 MNOK/site 1 920
Total Investments MNOK 46 063 Total Investments 49 579
MRD 46 Most likely Value 0,92 0,98 1,00 0,98 1,02 1,10 0,98 1,01 1,05 0,99 1,00 1,05 0,90 1,00 1,20 0,88 1,00 1,12 0,90 1,00 1,25 0,85 1,00 1,25 1,19 59 076 59 16 27 % Total estimat Oslo - Trondheim (MRD) Management and
Engineering
Trains and facilities
Base estimate
U7 Contractors and Materials Market
Total estimat Oslo - Trondheim (MNOK)
Value Value
U6 Project management
Cost estimate (deterministic/most likely)
Quantities Superstructure U4 External Demands Uncertainty Drivers U1 Technological Development U2 Technical Requirements Optimistic Trains and facilities
U3 Operational Concept optimisation
Standard Deviation (%) Pessimistic Standard Deviation (MRD) Pessimistic Uncertainty Drivers U8 Level of planning U5 Project ownership Uncertainty analysis Optimistic Elements Optimistic Pessimistic
Quanties Unit Prices (MNOK)
Relative uncertainty spans are similar for all corridors, except the two corridors Haukeli – Stavanger and Bergen – Stavanger with very
high tunnel-shares. Uncertainty in tunnel-lengths in Haukeli – Stavanger and Bergen – Stavanger are defined as ± 5% (instead of -24 %
and + 39 %). Uncertainty in unit-prices is defined as ± 27 % for Haukeli – Stavanger and -20%/+ 27 % for Bergen – Stavanger (instead
of -27% and + 24 %) due to the uncertainty of the subsea-tunnel.
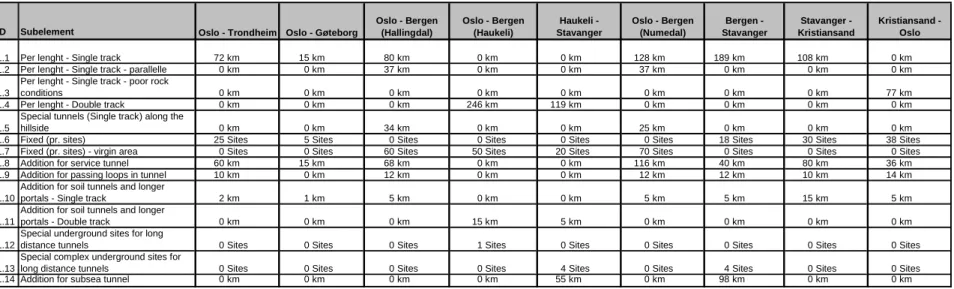
Appendix 3
Input: Deterministic estimate - Quantities
The following tables present the quantities used in the cost uncertainty analysis for each corridor. Note that the main cost elements
Power supply and Land acquisitions are not given in the present Appendix. These elements have been assessed in separate reports,
High Speed Railway Lines in Norway - Power Supply Converter Stations including High Voltage Supply - Input to Cost Estimate,
Rev.000, dated August 21, 2007 and Kvalitetssikring grunnerverv, memo received august 29, 2007.
ID Subelement
1.1 Per lenght - Single track 72 km 15 km 80 km 0 km 0 km 128 km 189 km 108 km 0 km 1.2 Per lenght - Single track - parallelle 0 km 0 km 37 km 0 km 0 km 37 km 0 km 0 km 0 km 1.3
Per lenght - Single track - poor rock
conditions 0 km 0 km 0 km 0 km 0 km 0 km 0 km 0 km 77 km
1.4 Per lenght - Double track 0 km 0 km 0 km 246 km 119 km 0 km 0 km 0 km 0 km 1.5
Special tunnels (Single track) along the
hillside 0 km 0 km 34 km 0 km 0 km 25 km 0 km 0 km 0 km
1.6 Fixed (pr. sites) 25 Sites 5 Sites 0 Sites 0 Sites 0 Sites 0 Sites 18 Sites 30 Sites 38 Sites 1.7 Fixed (pr. sites) - virgin area 0 Sites 0 Sites 60 Sites 50 Sites 20 Sites 70 Sites 0 Sites 0 Sites 0 Sites 1.8 Addition for service tunnel 60 km 15 km 68 km 0 km 0 km 116 km 40 km 80 km 36 km 1.9 Addition for passing loops in tunnel 10 km 0 km 12 km 0 km 0 km 12 km 12 km 10 km 14 km 1.10
Addition for soil tunnels and longer
portals - Single track 2 km 1 km 5 km 0 km 0 km 5 km 5 km 15 km 5 km 1.11
Addition for soil tunnels and longer
portals - Double track 0 km 0 km 0 km 15 km 5 km 0 km 0 km 0 km 0 km 1.12
Special underground sites for long
distance tunnels 0 Sites 0 Sites 0 Sites 1 Sites 0 Sites 0 Sites 0 Sites 0 Sites 0 Sites 1.13
Special complex underground sites for
long distance tunnels 0 Sites 0 Sites 0 Sites 0 Sites 4 Sites 0 Sites 4 Sites 0 Sites 0 Sites 1.14 Addition for subsea tunnel 0 km 0 km 0 km 0 km 55 km 0 km 98 km 0 km 0 km
Kristiansand - Oslo Haukeli - Stavanger Oslo - Bergen (Numedal) Bergen - Stavanger Stavanger - Kristiansand Oslo - Trondheim Oslo - Gøteborg
Oslo - Bergen (Hallingdal)
Oslo - Bergen (Haukeli)
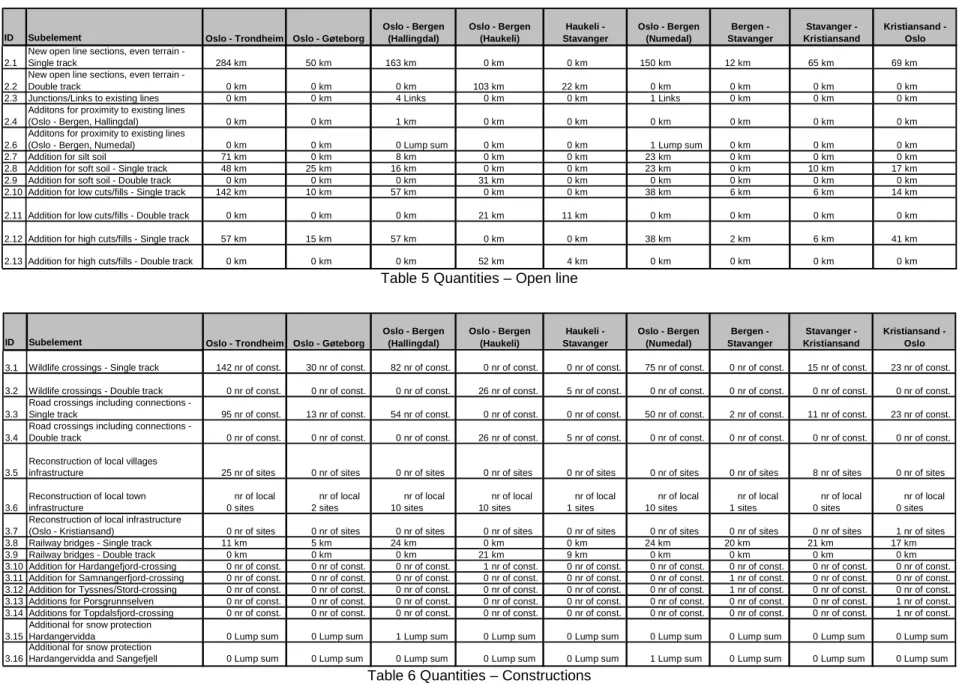
ID Subelement
2.1
New open line sections, even terrain -
Single track 284 km 50 km 163 km 0 km 0 km 150 km 12 km 65 km 69 km 2.2
New open line sections, even terrain -
Double track 0 km 0 km 0 km 103 km 22 km 0 km 0 km 0 km 0 km
2.3 Junctions/Links to existing lines 0 km 0 km 4 Links 0 km 0 km 1 Links 0 km 0 km 0 km 2.4
Additons for proximity to existing lines
(Oslo - Bergen, Hallingdal) 0 km 0 km 1 km 0 km 0 km 0 km 0 km 0 km 0 km 2.6
Additons for proximity to existing lines
(Oslo - Bergen, Numedal) 0 km 0 km 0 Lump sum 0 km 0 km 1 Lump sum 0 km 0 km 0 km 2.7 Addition for silt soil 71 km 0 km 8 km 0 km 0 km 23 km 0 km 0 km 0 km 2.8 Addition for soft soil - Single track 48 km 25 km 16 km 0 km 0 km 23 km 0 km 10 km 17 km 2.9 Addition for soft soil - Double track 0 km 0 km 0 km 31 km 0 km 0 km 0 km 0 km 0 km 2.10 Addition for low cuts/fills - Single track 142 km 10 km 57 km 0 km 0 km 38 km 6 km 6 km 14 km 2.11 Addition for low cuts/fills - Double track 0 km 0 km 0 km 21 km 11 km 0 km 0 km 0 km 0 km 2.12 Addition for high cuts/fills - Single track 57 km 15 km 57 km 0 km 0 km 38 km 2 km 6 km 41 km 2.13 Addition for high cuts/fills - Double track 0 km 0 km 0 km 52 km 4 km 0 km 0 km 0 km 0 km
Oslo - Trondheim Oslo - Gøteborg
Oslo - Bergen (Hallingdal) Oslo - Bergen (Haukeli) Haukeli - Stavanger Oslo - Bergen (Numedal) Bergen - Stavanger Stavanger - Kristiansand Kristiansand - Oslo
Table 5 Quantities – Open line
ID Subelement
3.1 Wildlife crossings - Single track 142 nr of const. 30 nr of const. 82 nr of const. 0 nr of const. 0 nr of const. 75 nr of const. 0 nr of const. 15 nr of const. 23 nr of const. 3.2 Wildlife crossings - Double track 0 nr of const. 0 nr of const. 0 nr of const. 26 nr of const. 5 nr of const. 0 nr of const. 0 nr of const. 0 nr of const. 0 nr of const. 3.3
Road crossings including connections -
Single track 95 nr of const. 13 nr of const. 54 nr of const. 0 nr of const. 0 nr of const. 50 nr of const. 2 nr of const. 11 nr of const. 23 nr of const. 3.4
Road crossings including connections -
Double track 0 nr of const. 0 nr of const. 0 nr of const. 26 nr of const. 5 nr of const. 0 nr of const. 0 nr of const. 0 nr of const. 0 nr of const.
3.5
Reconstruction of local villages
infrastructure 25 nr of sites 0 nr of sites 0 nr of sites 0 nr of sites 0 nr of sites 0 nr of sites 0 nr of sites 8 nr of sites 0 nr of sites
3.6
Reconstruction of local town
infrastructure 0 nr of local sites 2 nr of local sites 10 nr of local sites 10 nr of local sites 1 nr of local sites 10 nr of local sites 1 nr of local sites 0 nr of local sites 0 nr of local sites 3.7
Reconstruction of local infrastructure
(Oslo - Kristiansand) 0 nr of sites 0 nr of sites 0 nr of sites 0 nr of sites 0 nr of sites 0 nr of sites 0 nr of sites 0 nr of sites 1 nr of sites 3.8 Railway bridges - Single track 11 km 5 km 24 km 0 km 0 km 24 km 20 km 21 km 17 km 3.9 Railway bridges - Double track 0 km 0 km 0 km 21 km 9 km 0 km 0 km 0 km 0 km 3.10 Addition for Hardangefjord-crossing 0 nr of const. 0 nr of const. 0 nr of const. 1 nr of const. 0 nr of const. 0 nr of const. 0 nr of const. 0 nr of const. 0 nr of const. 3.11 Addition for Samnangerfjord-crossing 0 nr of const. 0 nr of const. 0 nr of const. 0 nr of const. 0 nr of const. 0 nr of const. 1 nr of const. 0 nr of const. 0 nr of const. 3.12 Addition for Tyssnes/Stord-crossing 0 nr of const. 0 nr of const. 0 nr of const. 0 nr of const. 0 nr of const. 0 nr of const. 1 nr of const. 0 nr of const. 0 nr of const. 3.13 Additions for Porsgrunnselven 0 nr of const. 0 nr of const. 0 nr of const. 0 nr of const. 0 nr of const. 0 nr of const. 0 nr of const. 0 nr of const. 1 nr of const. 3.14 Additions for Topdalsfjord-crossing 0 nr of const. 0 nr of const. 0 nr of const. 0 nr of const. 0 nr of const. 0 nr of const. 0 nr of const. 0 nr of const. 1 nr of const. 3.15
Additional for snow protection
Hardangervidda 0 Lump sum 0 Lump sum 1 Lump sum 0 Lump sum 0 Lump sum 0 Lump sum 0 Lump sum 0 Lump sum 0 Lump sum 3.16
Additional for snow protection
Hardangervidda and Sangefjell 0 Lump sum 0 Lump sum 0 Lump sum 0 Lump sum 0 Lump sum 1 Lump sum 0 Lump sum 0 Lump sum 0 Lump sum
Kristiansand - Oslo Haukeli - Stavanger Oslo - Bergen (Numedal) Bergen - Stavanger Stavanger - Kristiansand Oslo - Trondheim Oslo - Gøteborg
Oslo - Bergen (Hallingdal)
Oslo - Bergen (Haukeli)
ID Subelement
4.1 Regular line - Single track 366 km 70 km 338 km 0 km 0 km 364 km 319 km 194 km 162 km 4.2 Regular line - Double track 0 km 0 km 0 km 370 km 150 km 0 km 0 km 0 km 0 km 4.3 Additional for passing loops 36 km 12 km 24 km 0 km 0 km 24 km 12 km 12 km 24 km 4.4 Additional for slabtrack - Single track 65 km 0 km 136 km 0 km 0 km 171 km 268 km 97 km 58 km 4.5 Additional for slabtrack - Double track 0 km 0 km 0 km 221 km 108 km 0 km 0 km 0 km 0 km
Oslo - Trondheim Oslo - Gøteborg
Oslo - Bergen (Hallingdal) Oslo - Bergen (Haukeli) Haukeli - Stavanger Oslo - Bergen (Numedal) Bergen - Stavanger Stavanger - Kristiansand Kristiansand - Oslo
Table 7 Quantities – Superstructure
ID Subelement
5.1 Large station 0 Station 0 Station 0 Station 0 Station 0 Station 0 Station 0 Station 0 Station 0 Station 5.2 Large station at Stange 1 Station 0 Station 0 Station 3 Station 0 Station 0 Station 0 Station 0 Station 0 Station 5.3 Large station at Voss 0 Station 0 Station 1 Station 0 Station 0 Station 1 Station 0 Station 0 Station 0 Station 5.4 Large Station at Sarpsborg 0 Station 1 Station 0 Station 0 Station 0 Station 0 Station 0 Station 0 Station 0 Station 5.5 Large station at Kongsberg 0 Station 0 Station 0 Station 0 Station 0 Station 1 Station 0 Station 0 Station 0 Station 5.7 Large station at Stavanger 0 Station 0 Station 0 Station 0 Station 1 Station 0 Station 1 Station 0 Station 0 Station 5.8 Large station Porsgrunn 0 Station 0 Station 0 Station 0 Station 0 Station 0 Station 0 Station 0 Station 1 Station 5.9 Large station Kristiansand 0 Station 0 Station 0 Station 0 Station 0 Station 0 Station 0 Station 0 Station 1 Station 5.10 Small station 2 Station 0 Station 2 Station 3 Station 1 Station 1 Station 0 Station 1 Station 1 Station 5.10 Small station (Haugesund) 0 Station 0 Station 0 Station 0 Station 0 Station 0 Station 1 Station 0 Station 0 Station
Kristiansand - Oslo Haukeli - Stavanger Oslo - Bergen (Numedal) Bergen - Stavanger Stavanger - Kristiansand Oslo - Trondheim Oslo - Gøteborg
Oslo - Bergen (Hallingdal)
Oslo - Bergen (Haukeli)
Table 8 Quantities – Stations
ID Subelement
7.1
Special support Constructions
infrastructure 2 sites 0 sites 1 sites 2 sites 0 sites 2 sites 0 sites 0 sites 0 sites 8.1 Service and maintenance facilities 2 Stations 1 Stations 1 Stations 1 Stations 1 Stations 2 Stations 1 Stations 1 Stations 1 Stations 11.1 Trains 12 trains 10 trains 10 trains 10 trains 10 trains 10 trains 6 trains 6 trains 10 trains 11.2 Maintenance facilities 1 site 0 % site 20 % site 20 % site 20 % site 20 % site 10 % site 10 % site 20 % site
Kristiansand - Oslo Haukeli - Stavanger Oslo - Bergen (Numedal) Bergen - Stavanger Stavanger - Kristiansand Oslo - Trondheim Oslo - Gøteborg
Oslo - Bergen (Hallingdal)
Oslo - Bergen (Haukeli)
Appendix 4
Input: Deterministic estimate - Unit prices
The following tables present the unit prices used in the cost uncertainty analysis.
Main cost element Subelement ID Unit Price Unit Assumption
Tunnel (without superstructure)
Per lenght - Single track 1.1 75 MNOK/km 75 m2, D&B 250.-, transport 100.-, SRF + rock bolts 9'/m, drain & invert 10'/m, heavy RS (20%x35'): 7'/m, pregrouting (20% x 400'/ 10m): 8'/m, w&fr insulation (50%x30'): 15'/m. TBM tunnel to be chosen only if economical in comparison.
Per lenght - Single track - parallelle 1.2 75 MNOK/km Generally more poor rock conditions. 75 m2, D&B 250.-, transport 100.-, SRF + rock bolts 12'/m, drain & invert 10'/m, heavy RS (30%x35'): 10'/m, pregrouting (30% x 400'/ 10m): 12'/m, w&fr insulation (50%x30'): 15'/m. TBM tunnel to be chosen only if economical in comparison. Per lenght - Single track - poor rock
conditions
1.3 85 MNOK/km Generally more poor rock conditions. 75 m2, D&B 250.-, transport 100.-, SRF + rock bolts 9'/m, drain & invert 10'/m, heavy RS (20%x35'): 7'/m, pregrouting (20% x 400'/ 10m): 8'/m, w&fr insulation (50%x30'): 15'/m. TBM tunnel to be chosen only if economical in comparison. Per lenght - Double track 1.4 145 MNOK/km 75 m2, D&B 250.-, transport 100.-, SRF + rock bolts 9'/m, drain & invert 10'/m, heavy RS
(20%x35'): 7'/m, pregrouting (20% x 400'/ 10m): 8'/m, w&fr insulation (50%x30'): 15'/m. TBM tunnel to be chosen only if economical in comparison. Efficiency 2nd tube assumed 2/3 of the first. Add 10.000 per tube compared to single-track.
Special tunnels (Single track) along the hillside
1.5 90 MNOK/km Single track. Specific features like shallow tunnels, difficult construction conditions and rock burst phenomenom results in increased unit price, 10 MNOK added compared to ordinary single track. Additional 5 MNOK added due to exits.
Fixed (pr. sites) 1.6 20 MNOK/site Covers fixed cost independent of tunnel length. Workshop, support installation, "learning curve deficiency".
Fixed (pr. sites) - virgin area 1.7 30 MNOK/site Partly virgin area, 50% extra compared to Østerdalen. Covers fixed cost independent of tunnel length. Workshop, support installation, "learning curve deficiency".
Addition for service tunnel 1.8 35 MNOK/km 35 m2, shares resources with main tunnel when good/fair rock, assume 50% of D&B and transport, 80% of rock treatment
Addition for passing loops in tunnel 1.9 40 MNOK/km x 2 normal tunnel (35 + 40) Addition for soil tunnels and longer portals -
Single track
1.10 60 MNOK/km Includes rock cut average 10 m, concrete structure, membrane, backfill & landscaping minus average rock tunnel cost.
Addition for soil tunnels and longer portals - Double track
1.11 120 MNOK/km Includes rock cut average 10 m, concrete structure, membrane, backfill & landscaping minus average rock tunnel cost.
Special underground sites for long distance tunnels
1.12 50 MNOK/site 4 to 5 km access tunnels and underground plant. Special complex underground sites for long
distance tunnels
1.13 75 MNOK/site 4 to 5 km access tunnels and complex underground plant. (Haukeli - Stavanger and Bergen - Stavanger)
Addition for subsea tunnel 1.14 160 MNOK/km 70 MNOK/km (second tube) + 2 *45 MNOK/km (for subsea)
Poor rock (on the shelf rim, tension zones with poorly compacted soil), pregrouting and more expensive lining and drainage system. Railway tunnels need expensive water control measures and higher rate of poor rock protection.
Main cost element Subelement ID Unit Price Unit Assumption
Open line New open line sections, even terrain - Single track
2.1 20 MNOK/km Includes fences and drainage, frost insulation, landscaping and minor waterway crossings. Smaller wildlife crossing. Protection measures for integrity of the line.
Cleaning and debris treatment of 20 m wide roadbase, average 45 m3/m a 100.- (soil replacement + embankment of which 20% by rock blasting). 2 x fence a 1000*/m, drains+cable ducts: 4000*/m, creek and minor wildlife culverts, pole foundations, gravel road, landscaping, revegetation etc. New open line sections, even terrain -
Double track
2.2 35 MNOK/km Includes fences and drainage, frost insulation, landscaping and minor waterway crossings. Smaller wildlife crossing. Protection measures for integrity of the line.
Cleaning and debris treatment of 20 m wide roadbase, average 45 m3/m a 100.- (soil replacement + embankment of which 20% by rock blasting). 2 x fence a 1000*/m, drains+cable ducts: 4000*/m, creek and minor wildlife culverts, pole foundations, gravel road, landscaping, revegetation etc. Junctions/Links to existing lines 2.3 50 MNOK/Link Unit price based on group discussions
Additons for proximity to existing lines (Oslo - Bergen, Hallingdal)
2.4 1 000 MNOK Lump sum based on group discussions Additons for proximity to existing lines (Oslo -
Bergen, Numedal)
2.6 400 MNOK Lump sum based on group discussions
Addition for silt soil 2.7 15 MNOK/km Extensive use of "imported" roadfill, geotextile, extra frost insulation and soil exchange, Addition for soft soil - Single track 2.8 25 MNOK/km Ground improvement by use of LC piles or other measures, wider excavation, imported fill, surface
erosion treatment, environmental care during groundwork.
Addition for soft soil - Double track 2.9 40 MNOK/km Ground improvement by use of LC piles or other measures, wider excavation, imported fill, surface erosion treatment, environmental care during groundwork.
Addition for low cuts/fills - Single track 2.10 15 MNOK/km Wider roadbase corridor,average 100 m3/m excavation/fill, of which 20% rock cuts average. Addition for low cuts/fills - Double track 2.11 25 MNOK/km Wider roadbase corridor,average 100 m3/m excavation/fill, of which 20% rock cuts average. Addition for high cuts/fills - Single track 2.12 30 MNOK/km Even wider roadbase, 250 m3/m excavation/fill, long transport, extensive road building and
landscaping.
Addition for high cuts/fills - Double track 2.13 60 MNOK/km Even wider roadbase, 250 m3/m excavation/fill, long transport, extensive road building and landscaping.
Main cost element Subelement ID Unit Price Unit Assumption
Wildlife crossings - Single track 3.1 3 MNOK/Con Net 20 m passing = 30 m structure, 80'/m + backfill & landscaping = 3 MNOK, but 20% combined with other structures.
Wildlife crossings - Double track 3.2 5 MNOK/Con Net 20 m passing = 30 m structure, 80'/m + backfill & landscaping = 5 MNOK, but 20% combined with other structures.
Road crossings including connections - Single track
3.3 3 MNOK/Con Same as wildlife crossings Road crossings including connections -
Double track
3.4 5 MNOK/Con Same as wildlife crossings Reconstruction of local villages
infrastructure
3.5 10 MNOK/Con Unit price based on group discussions Reconstruction of local town infrastructure 3.6 50 MNOK/Con Unit price based on group discussions Reconstruction of local infrastructure (Oslo -
Kristiansand)
3.7 300 MNOK/Con Unit price based on group discussions Railway bridges - Single track 3.8 120 MNOK/km Unit price based on group discussions
Railway bridges - Double track 3.9 260 MNOK/km Price is doubled compared to single lines, 10 % off. Mostly stable ground, foundations more costly in hillside, add 40. 1/3 of bridges in steep terrain.
Addition for Hardangefjord-crossing 3.10 10 000 MNOK 1.8 km bridge span. Lump sum based on group discussions and memo "HØYHASTIGHETS JERNBANE I NORSK TERRENG - Noen karakteristiske trekk ved grunnforhold og topografi og tilpassede løsninger og kostnader", datert August 2007.
Addition for Samnangerfjord-crossing 3.11 3 000 MNOK 0.8 km bridge span. Lump sum based on group discussions and memo "HØYHASTIGHETS JERNBANE I NORSK TERRENG - Noen karakteristiske trekk ved grunnforhold og topografi og tilpassede løsninger og kostnader", datert August 2007.
Addition for Tyssnes/Stord-crossing 3.12 5 000 MNOK 1.2 km bridge span. Lump sum based on group discussions and memo "HØYHASTIGHETS JERNBANE I NORSK TERRENG - Noen karakteristiske trekk ved grunnforhold og topografi og tilpassede løsninger og kostnader", datert August 2007.
Additions for Porsgrunnselven 3.13 400 MNOK Lump sum based on group discussions Additions for Topdalsfjord-crossing 3.14 400 MNOK Lump sum based on group discussions Additional for snow protection
Hardangervidda
3.15 200 MNOK 10 km, viaducts. Lump sum based on group discussions Additional for snow protection
Hardangervidda and Sangefjell
3.16 300 MNOK Lump sum based on group discussions Constructions
Table 12 Unit prices for construction cost elements. The special construction is based on the memos presented in Appendix 8 and Error! Reference
source not found..
Main cost element Subelement ID Unit Price Unit Assumption
Regular line - Single track 4.1 24 MNOK/km Based on historical data from JBV. Include railway specifics like KL, signal, control, tele etc. Regular line - Double track 4.2 48 MNOK/km Based on historical data from JBV. Include railway specifics like KL, signal, control, tele etc. Additional for passing loops 4.3 21 MNOK/km Based on historical data from JBV. Include railway specifics like KL, signal, control, tele etc. Additional for slabtrack - Single track 4.4 7 MNOK/km Based on historical data from JBV. Include railway specifics like KL, signal, control, tele etc. Additional for slabtrack - Double track 4.5 14 MNOK/km Based on historical data from JBV. Include railway specifics like KL, signal, control, tele etc. Superstructure
Main cost element Subelement ID Unit Price Unit Assumption
Stations Large station 5.1 90 MNOK/station Three tracks. Lump sum based on group discussions Large station at Stange 5.2 90 MNOK/station Three tracks. Lump sum based on group discussions Large station at Voss 5.3 250 MNOK/station Unit price based on group discussions
Large station at Sarpsborg 5.4 90 MNOK/station Unit price based on group discussions Large station at Kongsberg 5.5 250 MNOK/station Unit price based on group discussions
Large station at Stavanger 5.7 1 000 MNOK/station Subsurface station/Station in tunnel. Two-tracks. Comparable to Nationaltheater. Unit price based on group discussions
Large station Porsgrunn 5.8 400 MNOK/station Transit station. Unit price based on group discussions Large station Kristiansand 5.9 1 000 MNOK/station Unit price based on group discussions
Small station 5.10 20 MNOK/station Unit price based on group discussions Small station (Haugesund) 5.10 50 MNOK/station Unit price based on group discussions
Main cost element Subelement ID Unit Price Unit Assumption
Power supply Power supply substations including HV-lines - Oslo - Trondheim
6.1 428 MNOK Ref. document High Speed Railway Lines in Norway - Power Supply - Converter Station including High Voltage Supply - Input to Cost Estimate, rev 000.
Power supply substations including HV-lines - Oslo - Gøteborg
6.2 50 MNOK Ref. document High Speed Railway Lines in Norway - Power Supply - Converter Station including High Voltage Supply - Input to Cost Estimate, rev 000.
Power supply substations including HV-lines - Oslo - Bergen (Hallingdal)
6.3 250 MNOK Ref. document High Speed Railway Lines in Norway - Power Supply - Converter Station including High Voltage Supply - Input to Cost Estimate, rev 000.
Power supply substations including HV-lines - Oslo - Bergen (Haukeli)
6.4 406 MNOK Ref. document High Speed Railway Lines in Norway - Power Supply - Converter Station including High Voltage Supply - Input to Cost Estimate, rev 000.
Power supply substations including HV-lines - Haukeli - Stavanger
6.5 122 MNOK Ref. document High Speed Railway Lines in Norway - Power Supply - Converter Station including High Voltage Supply - Input to Cost Estimate, rev 000.
Power supply substations including HV-lines - Oslo - Bergen (Numedal)
6.7 342 MNOK Ref. document High Speed Railway Lines in Norway - Power Supply - Converter Station including High Voltage Supply - Input to Cost Estimate, rev 000.
Power supply substations including HV-lines - Bergen - Stavanger
6.8 184 MNOK Ref. document High Speed Railway Lines in Norway - Power Supply - Converter Station including High Voltage Supply - Input to Cost Estimate, rev 000.
Power supply substations including HV-lines - Stavanger - Kristiansand
6.9 234 MNOK Ref. document High Speed Railway Lines in Norway - Power Supply - Converter Station including High Voltage Supply - Input to Cost Estimate, rev 000.
Power supply substations including HV-lines - Oslo - Kristiansand
6.10 184 MNOK Ref. document High Speed Railway Lines in Norway - Power Supply - Converter Station including High Voltage Supply - Input to Cost Estimate, rev 000.
Table 15 Unit prices for power supply cost elements
Main cost element Subelement ID Unit Price Unit Assumption
Special infrastructure Special support Constructions infrastructure 7.1 100 MNOK/site Unit price based on group discussions Facilities Service and maintenance facilities 8.1 20 MNOK/station Unit price based on group discussions
Contractor Management and Engineering 9.1 15 % of Contractor Cost
Based on historical data from JBV Client Management and Engineering 9.2 12 % of Contractor
Cost
Based on historical data from JBV Management and
Engineering