OPTIMIZATION OF DISTRIBUTION NETWORK CONFIGURATION:
AN EXPERIMENTAL TESTBED IN THE INTEGRIDY PROJECT FRAMEWORK
M. Delfanti, D. Falabretti, M. Merlo, A. A. Raja Politecnico di Milano – Italy
{maurizio.delfanti, davide.falabretti, marco.merlo, aitazazali.raja}@polimi.it
ABSTRACT
InteGRIDy is a H2020 project aiming at integrating cutting-edge technologies, solutions and mechanisms in a scalable Cross-Functional Platform to address effectively the issues arising from the increasing share of intermittent renewable energy sources, avoiding reduction of power system performance and reliability, and costs for distribution network refurbishing. In this framework, the present paper describes the smart grid architecture and main functionalities put in place in the Italian pilot of San Severino Marche. A major focus regards the strategies implemented to optimize the medium voltage grid configuration: a genetic algorithm, a Monte Carlo method and a heuristic approach are used and benchmarked against an exhaustive research. Energy losses are assumed as objective function of the optimization process. INTRODUCTION
In recent years, the share of Renewable Energy Sources (RES) in the EU power generation mix grew incessantly, from 13% in 1990 to about 20% in 2010. In 2016 renewable energy represented 17% of energy consumed in the EU, on a path to the 2020 target of 20%. By 2030, the EU is committed to reach a 32% share of renewables, aiming at reducing greenhouse gas emissions by 40% [1]. Advances in electric power systems have a fundamental role in meeting these targets: the intermittency and volatility characterizing sources such as PV and wind increasingly impact electricity networks. Distributed Generation (DG) is leading homes and small-scale businesses to become prosumers, pushing distribution networks toward active grids. To overcome these issues, new developments are required to evolve to “smarter” architectures: on the one hand, the High Voltage system and the electricity market need upgrades to manage the scarce RES programmability and to improve the power system balancing [2]; on the other hand, new solutions have to be introduced on distribution networks to face with the reverse power flows and the change in operation caused by DG.
The scale and ambition of research and innovation challenges to be addressed requires enhanced cooperation between all stakeholders involved, including the industry, public authorities, the research community and society at large. In fact, each research area has its own challenges, potentials, risks, and competitive context, making essential
the adoption of specific approaches. Therefore, an enhanced cooperation between stakeholders is a key to ensure designing targeted actions taking into account all the surrounding technical, economic and social aspects. In the depicted framework, the H2020 InteGRIDy project
(www.integridy.eu) has started in 2017. It aims at
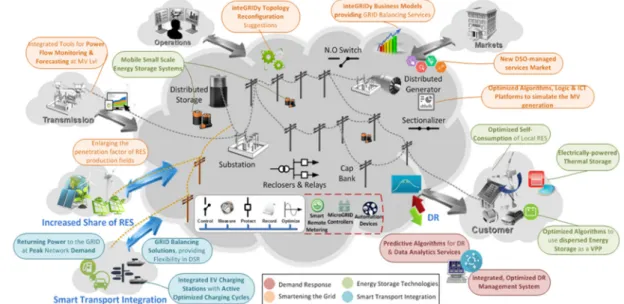
integrating cutting-edge technologies, solutions and mechanisms in a scalable Cross-Functional Platform to address effectively the issues arising from the increasing share of intermittent RES. The envisaged outputs shall be replicable in real-life and regard four thematic pillars: smartening the distribution grid, energy storage technologies, demand response, and electric vehicle integration. The final purpose of the initiative is to facilitate the optimal and dynamic operation of DG, to foster the stability of electricity grid, to coordinate distributed energy resources, to promote the implementation of Virtual Power Plant strategies and innovative collaborative storage schemes.
InteGRIDy involves 10 pilots over 8 EU countries, classified in large-scale and small-scale pilots (respectively, 6 and 4 experiments), where the approach proposed is deployed and validated in real-life. At the moment (early 2019), the WP6 and WP7 are just started: they aim at coordinating project’s partners during the installation in each pilot of all the apparatuses required to carry out the experiment; in addition, these WPs will involve the architecture’s test and the monitoring of its performance in the different use cases considered in the project common view (Figure 1).
The focus of the present paper is, in particular, on the large-scale pilot of San Severino Marche, a small town in the center of Italy, where the InteGRIDy approach is applied on the MV distribution grid managed by the local DSO A.S.S.E.M SpA (www.assemspa.it) [3]. The pilot has the following objectives designed in the framework of the InteGRIDy common view.
Pillar “smartening the distribution grid”
o Perform the short-term and mid-term forecasting of DG production.
o Accomplish the real-time and predictive state estimation of the MV network behavior (up to one year in advance).
o Perform the mid-term (one year) optimization of the MV grid topology.
Pillar “energy storage technologies”
o Develop novel strategies for the real-time monitoring and control of small-scale Battery
Energy Storage Systems (BESS), also experimenting aggregation (VPP) logics. o Use BESS to supply behind-the-meter services
to end-users and ancillary services to the power system.
Pillar “Demand response”
o Collect data about residential load, energy storage and DG production and provide them to end-users and aggregators to improve their
behavior.
In the paper, a description of the smart grid architecture deployed on the MV grid under analysis is reported. Then, its main functionalities are presented, focusing on the MV grid reconfiguration. Finally, the results of some numerical simulations run to assess the performance of the developed optimization strategies based on the actual measurements collected from field devices are discussed and conclusions are drawn.
Figure 1. InteGRIDy project common view. THE PILOT ARCHITECTURE
In the San Severino Marche pilot, an experimental architecture is deployed to achieve benefits on the power system operation and on users’ experience. The placement of new devices and solutions regarded the DSO’s control center, the MV distribution network and the households of some residential users. Moreover, in the inteGRIDy pilot of San Severino Marche, the monitoring system realized in a previous Smart Grid project is exploited to collect data on the MV grid and at the users’ premises [4].
The architecture is based on a workstation, placed in the DSO’s control center, in charge to gather data directly from the SCADA/DMS sited in the primary substation. The flexibility of Mathworks Matlab programming language is used to develop the state estimation algorithms, control strategies and forecasting tools required for optimizing the network operation. Moreover, the MV grid is also modeled in Matlab, representing its topology, electrical parameters, injections/withdrawals of DG/load and the position and state of switching devices. The workstation is aimed at performing all the calculations required by the project. It hosts the following software components:
Matlab-based computational core. It schedules and computes the MathWorks Matlab routines to properly manage the MV Grid topology and the BESS deployed on the grid.
Oracle DB. All the measurements collected by field equipment are managed by the DMS/SCADA unit of the DSO and mirrored on the Oracle DB, which is also the data repository for the outputs of project tools.
Ancillary service market emulator. Given the current evolution of the regulatory framework in place in Italy, the market is emulated through a dedicated platform to provide “realistic” price signals to users. Weather webservice. The platform is linked to an external weather web service, used to perform forecasts about the production of RES power plants in the area of the experiment.
BESS webservice. Data from BESS deployed at residential user’s premises are queried through a webservice and stored in the Oracle DB; the delivery of control commands to the BESS (eg. power setpoints) is also carried out exploiting the web interface.
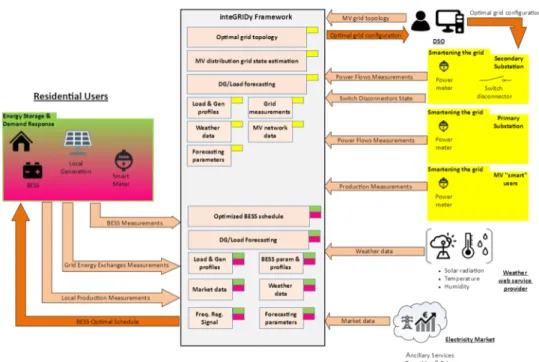
The tools require to operate a number of datasets about the network and users operation, which are collected exploiting an in-depth integration with the monitoring and control architecture of the DSO and the overmentioned webservices (Figure 2):
MV network structure, in terms of grid topology, and electrical parameters of power lines and transformers;
position and open/close state of the protection and switching devices on the MV grid;
measurements (active/reactive power, voltage, etc.) collected in real-time in the Primary Substation and along MV feeders;
measurements and preferences of the users equipped with BESS and enabled to the provision of ancillary services to the power system;
historical data about the grid’s and users’ behavior; weather nowcast and forecast data.
Figure 2. Overview of the San Severino Marche pilot project architecture and relevant datasets involved. OPTIMIZATION OF THE DISTRIBUTION
NETWORK CONFIGURATION
In the San Severino Marche pilot, the optimization of MV network configuration entailed a proper process of research, development and validation. In this context, different strategies have been designed assuming as objective function the minimization of energy losses on grid’s conductors and transformers. The tool is aimed to identify the optimal topology taking into account data collected in real-time and forecasted trends (loads and generators are forecasted up to one year in advance) [5]. Different optimization strategies are considered and benchmarked:
Exhaustive Research (ER). The ER consists in a preliminary analysis of the network structure to identify the set of configurations admissible from a merely topological point of view (absence of electric islands or loops). Then, the energy losses in each configuration are evaluated by power flow calculations over the time period involved in the optimization (one year). Finally, the configuration providing the lowest losses is selected as the optimal one. The advantage of the approach is that it is always able to find the global optimum of the problem; however, it is computationally intensive, since it needs the processing of each topologically
feasible configuration. For this reason, the ER is scarcely applicable in real-life. In this paper, ER is assumed as benchmark to measure the performance of the other optimization strategies.
Genetic Algorithm (GA). The GA operates defining an initial population of candidate configurations that is evolved iteratively toward the best solution. To this purpose, the state of each switching device over the network is modelled as a binary variable (1 = closed; 0 = open). Therefore, a given grid configuration is defined univocally as a binary string of chromosomes, evolving by selection, crossover and mutation of individuals. During the evolutive process, the combinatory generation of new grids is bound to only topologically admissible configurations (i.e. no electrical loops or islands); to this aim, suitable inequality constraints have been introduced in the problem (e.g. to exclude the simultaneous opening or closing of given switching devices). The GA is implemented in the pilot by using the Matlab Optimization Toolbox.
Monte Carlo (MC) algorithm. The MC approach provides assigning proper weights to each grid configuration according to its closeness to the base configuration (the grid configuration that is commonly adopted by the DSO during the standard operation). The coefficients are determined according
to the closeness of the selected configuration to the base case, in terms of number of switching maneuvers that are required to pass from the base configuration to the selected one: i.e. among all the possible grid configurations investigated through the Monte Carlo algorithm, a greater probability is assigned to those more similar to the configuration previously selected as optimal. This strategy is based on the assumption that in real-life, during normal operation (i.e. when the network functioning is only affected by load/generation daily/seasonal fluctuations), the network usually requires limited changes to be rearranged (e.g. passing a few users from a MV feeder to the adjacent one).
Deterministic Heuristic (DH). Commonly, outside of experimentations, DSOs perform the reconfiguration of distribution networks only when strictly necessary or highly beneficial, because a higher number of switching operations increases the wearing of switching devices, the probability of their failure and, consequently, the maintenance costs and risk of supply interruption. According to this consideration, a DR approach has been developed in the project. At each time step involved in the optimization, the optimal configuration for the next period is selected among those ones requiring for the transition a number of switching maneuvers equal to or lower than the limit set by the DSO. Once defined the subset of grid configurations having admissible topology and satisfying this criterion, energy losses in each configuration are evaluated through power flow calculations. The optimal configuration is the one showing lowest losses.
NUMERICAL ANALYSIS
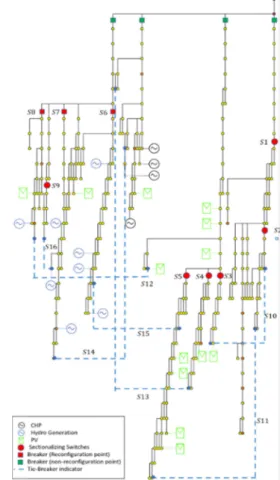
In the present section, each optimization strategy has been applied to the MV network of San Severino Marche to test its practical feasibility and to obtain useful indications for the future implementation within the InteGRIDy project. To this purpose, the MV grid of San Severino Marche has been represented in the Matlab software environment (Figure 3). Power withdrawals of MV/LV users have been modeled over one year and on an hourly basis, according to the historical measurements collected in real-life. The position and open/close state of sectionalizing switches have been also modeled: in Figure 3 along line switches are represented as red dots (circuit breakers at the beginning of MV feeder are assumed not to be used for reconfiguration purpose), while devices at the end of MV lines and useful for back-feed are shown as blue dotted lines.
The procedure developed allows the DSO to select the periodicity to perform the network reconfiguration (eg. monthly, weekly, hourly, etc.). The improvement in network’s losses increases with the increasing of reconfiguration frequency; however, also the effort required to manage the network rises (greater number of
maneuvers), making more complex for the DSO to operate the grid. In the paper, the weekly case is presented in detail, because in authors’ opinion it can be considered a suitable trade-off between losses reduction obtainable by the dynamic grid reconfiguration and effort in charge to the DSO to manage the reconfiguration process.
Figure 3. Mathematical model of San Severino Marche MV network.
Figure 4 shows the energy losses over the computed year in the optimal configuration identified by each optimization method. Losses are reported as percentage variation w.r.t. the ones calculated in the base case (i.e. the configuration, constant over the year, that the DSO would adopt without any optimization). The grid configuration is assumed to be updated weekly: i.e. the grid topology is kept constant for one week and then changed according to the behavior of the grid expected in next 7 days. As one can observe, the ER approach is the method showing the best performance in reducing losses: as expected, it is always able to identify the optimum solution of the problem. The benefits of the optimization procedure on the grid efficiency are important: with the ER method, weekly energy losses reduce up to 27% compared to the base case. Obviously, ER shows better performance than any other optimization approach considered in the study, even though also in the other cases the losses reduction with respect to the standard configuration is significant.
Figure 4. Reduction of energy losses (in % w.r.t. the base case) over one year.
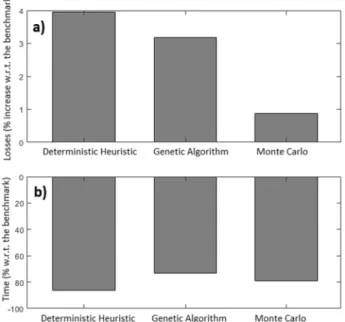
Figure 5-a reports the total energy losses over one year comparing each optimization method to ER. Similarly, Figure 5-b shows the computational time expressed in relative way w.r.t. the time required to find the optimal configuration with ER (equal to 28.9 hours).
Figure 5. Network losses and computational time assuming a weekly reconfiguration (% w.r.t. the ER optimization).
Figure 5-a confirms the yearly trends in Figure 4: MC is the method showing the performance closest to ER, with a missed improvement of energy losses on a yearly basis lower than 1%; the energy lost with GA and DH, on the other hand, is significantly higher than ER (respectively, about 3 and 4%), although, as already mentioned, greatly better than in the base case.
Through the adoption of the optimization methods developed in the InteGRIDy project, the reduction of the computational time required to identify the best configuration is evident. About this aspect, the DH and MC algorithms are the methods performing better, with a reduction of computational time respectively equal to 86 and 79% compared to ER. Due to the iterative generation of populations of grid configurations, the GA needs a longer time to accomplish the optimization. Anyway, also in this case the improvement in comparison to the exhaustive research is huge (-73%).
In practical applications, the optimization approach to be adopted must ensure the best trade-off between
effectiveness of the mathematical solution provided (i.e. closeness to the global optimum of the problem) and computational effort required by the solver to find it. According to the numerical analyses performed, the MC method proved to be the best trade-off between these needs, being able to identify a solution very close to the optimal one in an amount of time greatly lower than the ER. MC outperforms GA on both aspects. DH also showed interesting prospects of application in the InteGRIDy framework, especially considering its time effectiveness and the relatively easy design approach (it is the only deterministic approach among all those considered). CONCLUSIONS
In the present paper, the InteGRIDy project and the relevant San Severino Marche demonstrative initiative have been presented. The EU project will allow for the on-field experimentation of new solutions designed to cope with the issues introduced by the RES generation and fulfilling the evolving needs of end-users. San Severino Marche pilot, in particular, represents a very effective experimental testbed for the inteGRIDy project. The numerical analyses performed proved the effectiveness of the procedures designed to optimize the MV grid configuration. Moreover, they provided numerical figures useful for the identification of the most appropriate method among the considered ones. This strategy represents a suitable trade-off between the ability to improve energy losses on the distribution network and the required computational time.
ACKNOWLEDGMENTS
InteGRIDy project, and all the results presented in this paper, have been funded by the European Union’s Horizon 2020 research and innovation programme, H2020-LCE-2016-2017, LCE-02-2016, project 731268.
REFERENCES
[1] EU Commission, 2012, Energy Roadmap 2050, European Union, doi:10.2833/10759.
[2] S. Goutte, P. Vassilopoulos, 2019, “The value of flexibility in power markets”, Energy Policy, Vol. 125, 347-357.
[3] D. Falabretti, M. Moncecchi, F. Bovera, M. Mirbagheri, M. Delfanti, M. Fiori, M. Merlo, 2018, “San Severino Marche Smart Grid Pilot within H2020 InteGRIDy project”, Energy Procedia. vol. 155, 431-442.
[4] M. Delfanti, D. Falabretti, M. Fiori, M. Merlo, 2015, “Smart Grid on field application in the Italian framework: The A.S.SE.M. project”, Electric Power Systems Research, vol. 120, 56-69.
[5] M. Delfanti, D. Falabretti, M. Merlo, D. Moneta, 2014, “Impact of network reconfiguration on distribution systems performance”, IREMOS, vol. 7(2), 258-269.