NLR TP 96512
Variation in load factor experience - a re-analysis of
Fokker F27 and F28 operational acceleration data
217-02
ORIGINATOR
National Aerospace Laboratory NLR, Amsterdam, The Netherlands
TITLE
Variation in load experience - A re-analysis of Fokker F27 and Foker F28 operational acceleration data
-PRESENTED AT
AUTHORS DATE pp ref J.B. de Jonge and P.A. Hol
960820 52 1
DESCRIPTORS
Accelerometers Fatigue life
Aging (materials) Fokker aircraft Airline operations In-flight monitoring
Counting Loads (forces)
Damage assessment Service life
Data acquisition Statistical analysis
ABSTRACT
Fatigue meter data obtained during operational flights of Fokker F27 and Fokker F28 aircraft were re-processed and analyzed to study the variation in load experience between different aircraft of the same type.
The Data covered about 470000 flights, made by 101 aircraft of 51 different operators. A simple algorithm was developed to quantify the load factor experience in terms of fatigue damage per flight. The data were subjected to a statistical analysis. Considerable variations in load experience were found. The results give an indication of the profits that can be gained from individual aircraft load monitoring.
Summary
Fatigue meter data obtained during operational flights of Fokker F27 and Fokker F28 aircraft were re-processed and analyzed to study the variation in load experience between different aircraft of the same type.
The Data covered about 470000 flights, made by 101 aircraft of 51 different operators. A simple algorithm was developed to quantify the load factor experience in terms of fatigue damage per flight. The data were subjected to a statistical analysis. Considerable variations in load experience were found. The results give an indication of the profits that can be gained from individual aircraft load monitoring.
Contents
List of symbols 5
1 Introduction 7
2 Overview of available data 8
3 Data analysis procedures 10
4 Data analysis 13 5 Discussion 17 6 Conclusions 19 7 Reference 20 7 Tables 18 Figures Appendix 49
A Development of a damage index DI 49
1 Figure
List of symbols
cg = centre of gravity fl(j) = number of flights
fn(j) = number of flight hours (hrs) exp(xi)j = positive incremental exceeding level
exn(xi)j = negative incremental exceeding level
yp(xi)j = positive incremental exceeding per flight level (hrs-1) yn(xi)j = negative incremental exceeding per flight level (hrs-1) y(xi)j = logarithmic mean incremental exceeding per flight level (hrs-1) DI = damage index
DH = damage per hour (hrs-1)
µ = mean
σ, std = standard deviation
dur = average flight duration (hrs) GAG = Ground Air Grand cycle
1 Introduction
Design Fatigue Load Spectra, and the associated safe service lives and the inspection periods for transport aircraft are usually based on an estimated average usage of the aircraft. As the usage, and associated fatigue load experience of an individual aircraft may deviate from this average, adequate safety factors must be applied to the determined service lives in order to cover scatter in load experience.
Unfortunately, relatively little quantitative information about the magnitude of this load experience is available for civil transport aircraft.
In the mid-fifties, the Fokker F27 twin turboprop short haul transport aircraft entered service, followed at the end of the sixties by the Fokker F28 twin jet short haul aircraft. Both aircraft types were bound to be flown by a wide variety of operators with a variety of networks. In order to check the validity of the Design Fatigue Spectra assumed for these aircraft, the Netherlands Civil Airworthiness Authorities required counting accelerometers to be installed in at least two aircraft of each operator. These meters were read out at weekly or monthly intervals and the results sent to Fokker for further processing and analysis.
The measurements started in 1961 and continued until 1976, when it became clear that the fatigue design assumptions for both aircraft types were conservative indeed: design spectra roughly corresponded with the load experience observed for the most severe operator.
By that time a very large set of recorded data had been accumulated. Although the information is limited (only cg vertical acceleration exceeding, number of flights and number of flight hours) it was felt that the data provide highly useful information about scatter in load experience occur-ring in service.
On request of the Netherlands Civil Airworthiness Authority RLD, the Fokker Aircraft Company made the original data available for re-analysis, within the framework of the FAA program on Continuing Airworthiness of aging aircraft.
The present report describes the re-analysis of these data, covering about 470000 flights, made by 101 different aircraft belonging to 51 different operators.
Chapter 2 gives an overview of the recorded data.
The data analysis procedures are presented in chapter 3, including the definition of a "damage index" related to a measured spectrum as a means to quantify the variation in observed usage in terms of fatigue damage.
The actual analysis is presented in chapter 4, followed by a discussion of the results.
It is concluded that even for typical short-haul aircraft considerable variations in load experience occur, resulting in differences in average damage per flight from operator to operator of about a factor up to ten.
The results support the usefulness of in-service load monitoring as a means to optimize maintenance and enhance safety.
2 Overview of available data
The counting accelerometers used were of the so-called "Fatigue meter"-type, produced by Mechanism Ltd, UK. These devices count the number of exceeding of eight predetermined acceleration levels, four above the one-g level and for below the one-g level. These levels were 1.25g, 1.55g, 1.95g and 2.35g "upward" and 0.75g, 0.45g, 0.05g and -0.35g "downward" respectively. (A limited number of the earlier measurements were done with meters having only six counting levels: in that case no 2.35g and -0.35g exceedance counts were made).
The meters were read out at monthly or weekly intervals and the counts were filled out on special forms, together with the number of flight hours and the number of flights of the aircraft over that period.
These forms were sent to Fokker’s for processing and analysis.
It should be noted that no information is recorded with regard to speed altitude and aircraft weight at the instant of acceleration occurrence, and that the acceleration data, as they refer to groups of flights, only present average data per flight.
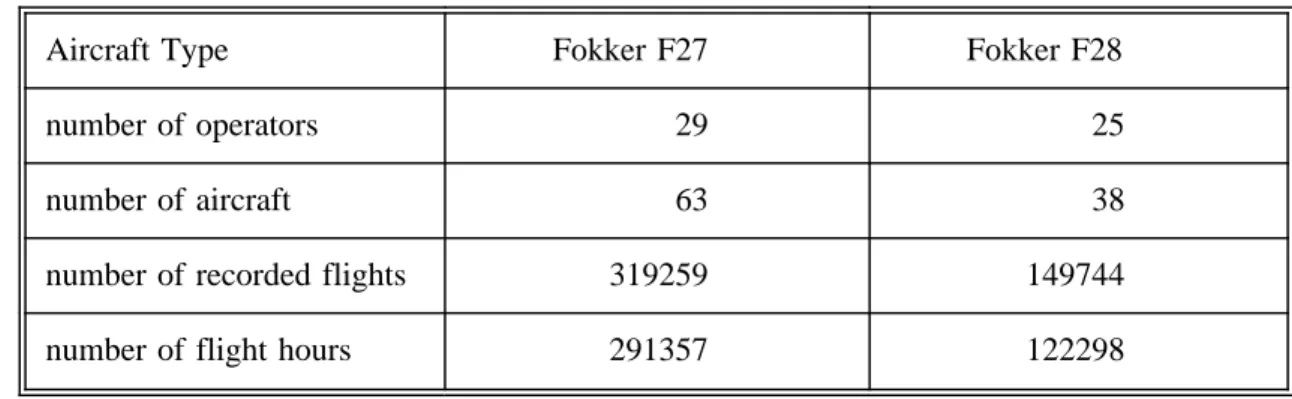
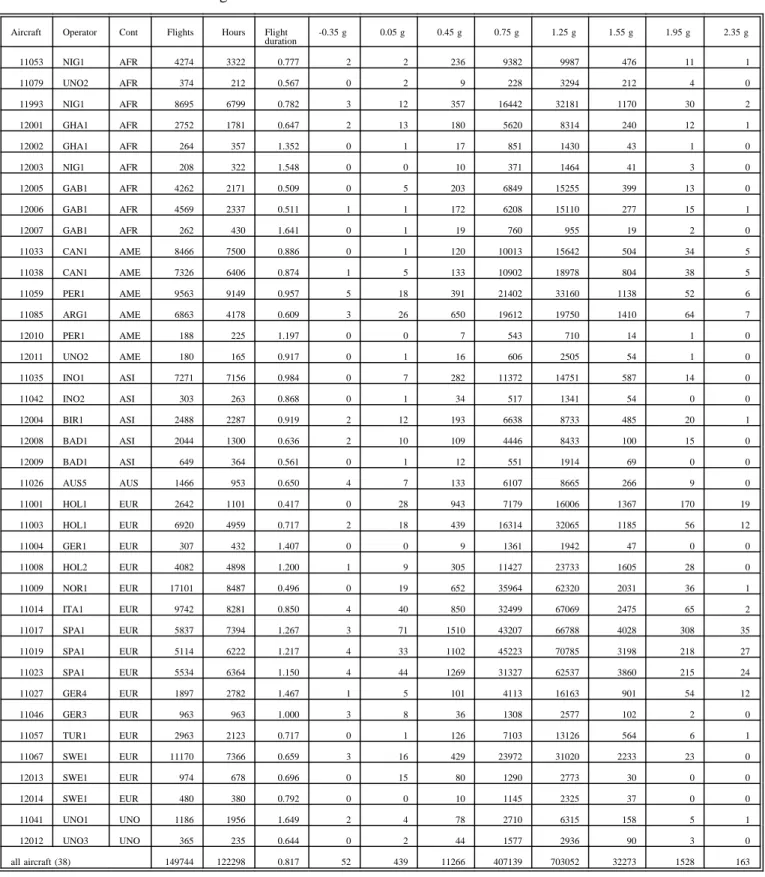
In the present study, the original data forms were re-analyzed. Table 1 gives a general overview of the available data. As data capture for the F28 took place during about 5 years compared to 13 years for the F27, the total batch for the F28 is smaller but still covers 150000 flights, distributed over 38 aircraft, pertaining to 25 operators. For the F27, these figures are 320000 flights, 63 aircraft and 29 operators.
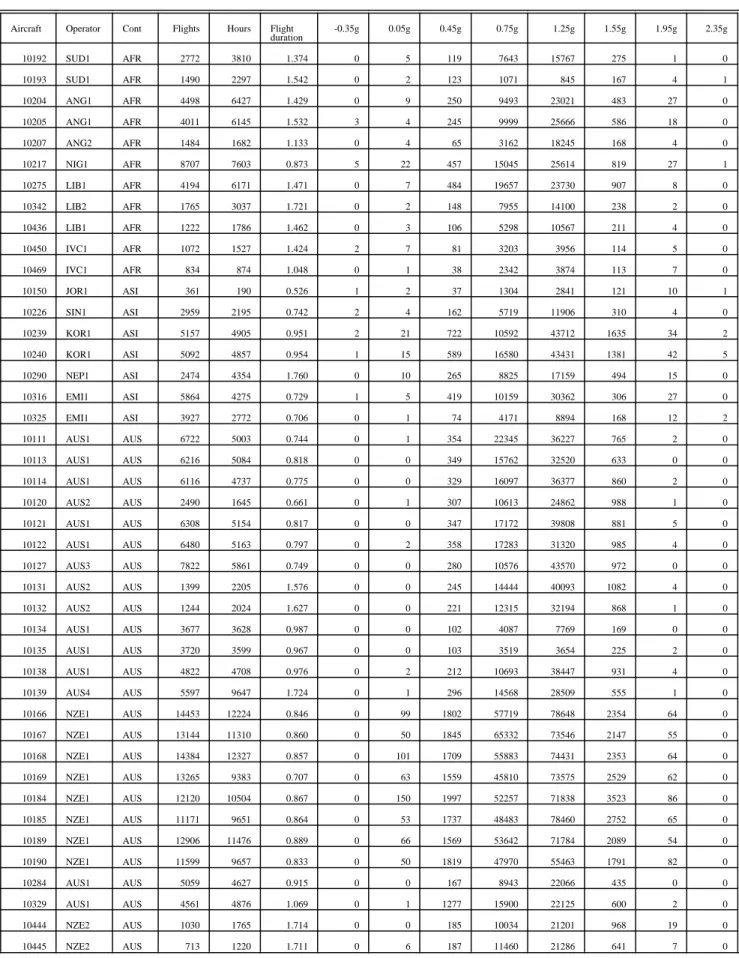
The tables 2 and 3 give a complete overview of the available data for the F27 and F28 respectively. Note that the data have been "sanitized" by replacing the name of the operator by a code. Information on the "Continent of operation", however, has been maintained (For two aircraft, the country of origin is unknown: their "continent" has been indicated in the tables as UNO).
In order to be statistically relevant, the data batch for each aircraft should be sufficiently large. The distributions of the number of recorded flights per aircraft are presented in the figure 1 . In case of the F27, for only three aircraft the batch is smaller than 1000 flights, while the median batch size is about 4000 flights.
For the F28, ten aircraft have a data batch smaller than 1000 flights, but the median batch size is also about 4000 flights.
A careful analysis of the data pertaining to these small batches led to the conclusion that they could be considered as representative, and hence they were included in the full statistical analysis.
Both the F27 and F28 are typical short haul transport aircraft, with an average recorded flight duration (airborne time) of 55 and 49 minutes respectively, but of course with very different
performance characteristics.
Figure 2 presents the average load factor spectrum as recorded for both aircraft. It is remarkable to note that these spectra largely coincide, at least for the load factor range between 2g and 0g.
3 Data analysis procedures
It may be recalled that the data recorded for each individual aircraft j (j=1,...m), consist of 10 figures, namely:
1. Total number of flights, fl(j) 2. Total number of flight hours, fh(j)
3. Total number of exceeding (level crossings ) of:
a. four upward incremental load levels, exp(xi)j(i=1...4) b. four downward incremental load levels, exn(xi)j(i=1...4)
whereby x1=0.25g, x2=0.55g, x3=0.95g and x4=1.35g.
The purpose of the present analysis is to study the difference in load experience between different aircraft. It is a known fact that generally speaking the load spectra of different aircraft types when expressed in terms of "per flight" show better agreement, that means less difference, than when expressed in terms of "per flight Hour". Also, most maintenance schedules are defined in terms of "flights" rather than flight hours.
Hence, it was decided to perform the comparative analysis in this report primarily on a "per flight" basis.
For this, the "overall" data recorded were first reduced to data per flight by division by the number of flights. This results for each aircraft j in:
1. Average flight duration dur(j)= fh(j)/fl(j) 2. Average number of exceeding per flight
a. for upward levels yp(xi)j=exp(xi)j/fl(j) (i=1...4) b. for downward levels yn(xi)j=exn(xi)j/fl(j) (i=1...4)
Usually, the number of crossings of a certain incremental load factor
is larger for the levels larger than 1g than for the levels below 1g: yp(xi)>yn(xi) for all i. The reason for this is that the total load factor experience consists of a combination of loads due to turbulence (largely symmetrical with respect to 1g), and manoeuvre loads, which are predominantly associated with positive incremental loads (all turning manoeuvres and pull-up manoeuvres go with positive load factor increments; only push-down manoeuvre cause a negative load factor increment).
In order eliminate the manoeuvre effect, it is often customary to "symmetrize" the spectrum by calculating the logarithmic mean of the exceeding of corresponding positive and negative load
factor increments:
The relation between the quantities yp, yn,and y is illustrated in figure 3. y(xi)j yp(xi)j yn(xi)j (i 1...4)
The statistical variables defined sofar describe the load factor spectrum, and the variation in severity of this spectrum from aircraft to aircraft.
In order to have a quantitative measure in terms of potential fatigue damage, a quantity has been defined, indicated as Damage Index or DI, which provides a relative figure for "the damage per flight" inflicted in the lower wing skin near the wing root. The derivation of this Damage Index is given in Appendix A. The Damage Index DI for aircraft j is a function of the spectrum variates defined above:
DI(j)= Function(yp(xi)j,yn(xi)j, i=1...4).
The Damage Index DI is a relative measure for the fatigue damage per flight. In addition, a variable DH, describing the fatigue damage per flight hour will be defined:
DH(j)= DI(j)/dur(j)
In summary, we have now defined 15 variables, defining the average load experience per flight for our set of aircraft.
In the next chapter, we will study the statistical behaviour of these variables . For each variable, the mean and standard deviation are calculated.
For example, the mean and standard deviation for the average flight duration are calculated from:
It should be realized that thus equal weight is given to the value dur(j) for each aircraft j, µ(dur) 1 m m j 1 dur(j) σ(dur) 1 m m j 1 dur(j) µ(dur)2
independent of the batch size (nr of recorded flights) of that aircraft j.
It may be recalled from the previous chapter that specifically for the F28 data a number of data batches were relatively small, but analysis of these small batches led to the conclusion that even
these small batches may be considered as representative samples to describe the average load experience of that individual aircraft.
Probability distributions of a variable will be determined by sorting the respective observed values in ascending order, and plotting these against their "plotting position" j/(m+1).
Correlation between variables will be studied by plotting the respective values of the variables against each other.
4 Data analysis
In the previous chapter, 15 statistical variables were defined. Thirteen of these are directly derived from the recorded data presented in the tables 2 and 3. The two damage parameters DI and DH are calculated using the algorithm derived in appendix A.
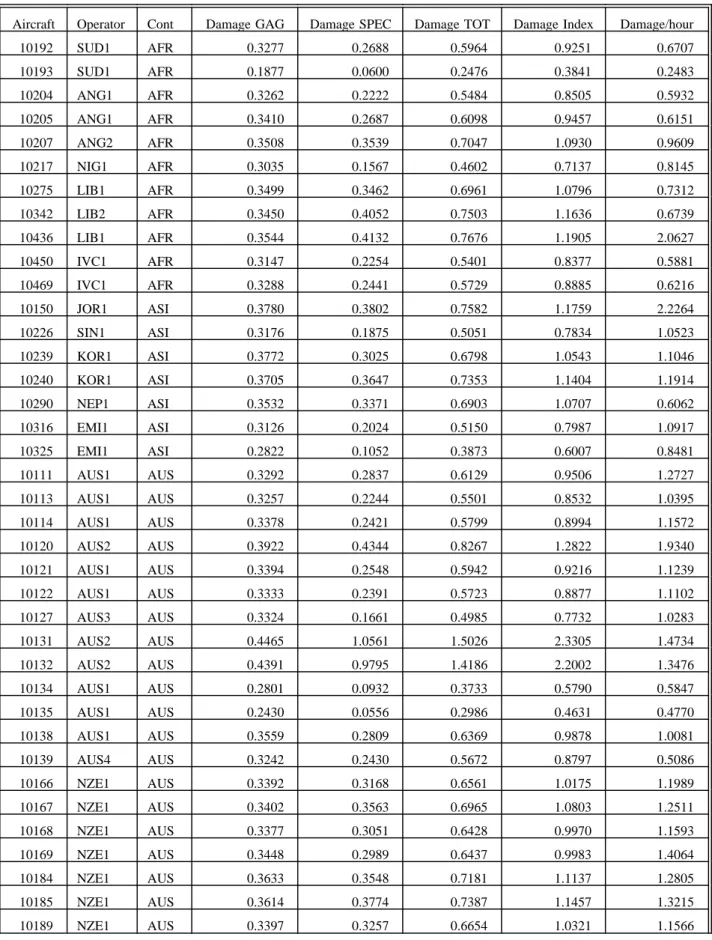
The tables 4 and 5 present the results of the damage calculations for all F27 aircraft and F28 aircraft respectively.
It may be recalled that the "total damage" of a flight is thought to consist of two parts, namely the "spectrum damage" and the "GAG" damage.
The "total damage" for each aircraft is normalized by division by the value found for "all aircraft", resulting in the damage index DI. The damage per hour is found by dividing DI by the average flight duration for that aircraft.
Figure 4 presents the calculated damage values for each aircraft. It may be noted that the damage associated with the Ground-Air-Ground cycle constitutes more than 50 percent of the total damage: this is one of the reasons why the number of flights tends to be more descriptive for the accumulated fatigue damage than the number of flight hours.
The figures 5a and 5b show for F27 and F28 respectively the acceleration spectra per flight for the aircraft with the highest DI, the lowest DI, and
the average spectrum pertaining to all recorded flights.
Tables 6 and 7 summarize some statistical properties of the fifteen defined variables for the F27 and F28 respectively.
As expected, all variables display considerable scatter.
It is interesting to note that the variables dur, DI and DH all have a coefficient of variation of about 0.35 for both aircraft types.
In the following, some statistical properties will be analysed in more detail.
a. Probability distributions: Probability distributions for the different variables were determined. Results for the most relevant parameters are presented in the following figures:
- Figure 6: Average Flight Duration.
We may note that for the F27 only ten percent of the aircraft have an average flight duration of less than 0.7 hours; for about 60 percent, the flight duration lies in a relatively narrow band between 0.7 and 1.0 hours while about 25 percent have a relatively long flight duration of more than 1.4 hours. The flight duration distribution for the F28 appears more "smooth", the mean flight duration of 0.91 hours is slightly less than that of the F27 (1.03 hours).
- Figure 7: Damage Index DI
Both for the F27 and the F28 the majority of aircraft have a DI which falls in a relatively narrow band. For the f27 e.g. about 70 percent of the aircraft have a DI between 0.8 and 1.2, for the F28 70 percent have a DI between 0.7 and 1.2. On the other hand, for both aircraft types a limited number of aircraft experienced considerably higher DI values, up to about 3 and 2 for F27 and F28 respectively. These "severely flown" aircraft will be subject to a detail review furtheron in this chapter
- Figure 8: Damage per Hour DH
As expected, the DH appears to show more scatter than the DI. For example for the F28 70 percent of the aircraft have a DH between 0.7 and 1.6, thus covering a DH range with ratio 1.6/0.7 =2.1 , compared to a DI range of 1.2/0.7=1.7.
Specifically for the F28 the distribution curve approaches a straight line for DH values between 0.6 and 1.7, covering 85 percent of all aircraft. This means that over this range the probability density distribution is flat; all DI values in this range are equally probable.
- Figure 9: Number of exceeding of 1.25g
The number of exceeding has been plotted on a logarithmic scale.
It may be observed that the distribution for the F27 is wider than for the F28. The shape of the distribution pertaining to the F27 slightly resembles the well-known shape pertaining to a normal distribution; for this reason the distribution for the F27 has also been plotted on log-normal probability paper, see figure 10. The resulting plot is still far away from a straight line, indicating that the resemblance with a normal distribution is only superficial.
- Figure 11: Number of exceeding of 1.95g
These distributions have been presented for illustrative purposes only. Keeping in mind that the exceeding of 1.95g is a "rare" event, happening on the average say once in thousand flights in case of the F28, it must be clear that a data batch of at least a few thousand flights is required to get a reliable estimate of the average 1.95g exceedance frequency for a particular aircraft. As shown in figure 1 and figure 2, several aircraft in the data base do not comply with this requirement, and only limited value can be attributed to the derived 1.95g exceedance statistics.
b. Correlations: The statistical variables defined in this study are not necessarily independent: it may even be expected that several variables are highly correlated. In the following figures some of these correlations will be presented.
- Figure 12: Correlation between flight duration and damage index DI.
The two variables are hardly correlated, with very low figures for the square of the correlation coefficient R2. The "best fit" linear regression line suggests in accordance with expectations a certain positive correlation: an increase in flight duration by a factor 10 results in a DI increase of a factor 2.4 for the F27 and 1.9 for the F28.
- Figure 13: Correlation between flight duration and damage per hour DH.
The correlation coefficient remains low, but is higher than in the previous case. Again in accordance with expectations, the linear regression curve indicates a negative correlation: e.g. for the F28 an increase of flight duration by a factor 10 leads to a decrease in DH from 1.8 to appr. 0.25
- Figure 14: Correlation between damage index DI and number of 1.25g exceeding per flight.
As might be expected, the correlation coefficient is high, with a value R2= 0.932 in case of the F27 and 0.837 for the F28. The best fit regression line has an offset of about 0.5: even if the number of 1.25g exceeding is zero, the damage index is non-zero, because of the damage due to the ground-air-ground cycle.
_ Figure 15: Correlation between number of 1.55g exceeding and 1.25g exceeding. In a flight with many 1.25 exceeding, one expects also a relatively large number of 1.55g exceeding. In other words, one expects these exceedance numbers to be correlated. The figure shows this expectation to be reasonably fulfilled: the correlation coefficient R being in the order of 0.8 for both aircraft types.
- Figure 16: Correlation between damage index DI and number of flights in badge. Fortunately, figure 16 shows that such a correlation does not exist: values for R2 are very low and regression lines are practically horizontal.
Yet, it may be observed that for the F27 aircraft with exceptionally high DI values only a relatively small data batch existed. This was not the case for the F28, where the high DI values were associated with medium sized batches. Furtheron, the properties of these data sets with high DI values will be further investigated.
c. Variations per continent of operation.
The data for F27 and F28 pertain to operations in all parts of the world. It is useful to investigate whether a systematic difference in usage severity between different part of the world exists.
Figure 17 shows the DI values per aircraft, arranged in ascending order, per continent of operation.
For the F27, the differences per continent are remarkably small but the average DI value for Australia is about 20 percent higher than in other continents due to the high DI values observed for four specific aircraft. For the F28, the DI-values for Europe appear a little bit higher than for other parts of the world, but this effect is largely due to three specific aircraft included in the data that have a DI value higher than 1.5.
In the following paragraph, the data batches associated with high DI values will be considered in some more detail.
d. Very severe data batches:
Figure 18 shows the Identification numbers of the 10 aircraft in each data set having the highest damage index DI as shown already in figure 17, the four F27 aircraft with a DI value larger than 2 were operated in Australia. For these aircraft the data batches are of a relatively limited size. These aircraft were flown by operators, indicated in table 2 under the code AUS2 and NZE2 respectively. Actually, these were not "normal" commercial operators, but government agencies: the aircraft were used to check the ILS systems at various airports. This obviously explains the very high load experience: the operation will have been characterized by many turns, and a relatively high proportion of the total flight time was spent at low altitude. At the same time, the utilization of these aircraft was relatively low, in the order of 50 flights per month. This explains the relatively small batch sizes. It is interesting to note that a third aircraft of AUS2, aircraft 10120, experienced a DI of 1.28 which is not extremely high. However, this aircraft made flights of relatively short duration (40 minutes), resulting in a relatively very high damage per hour DH of 1.93.
For the F28, three aircraft operated in Europe have a damage index which is well above the fleet average. These three aircraft belong to the same (commercial) operator, and the data batches for each aircraft are larger than 5000 flights. A review of the original data showed that the high load experience was not "incidental", but remained relatively high throughout the whole recording period for this aircraft. The explanation for this relatively severe usage is that these aircraft were probably used for a specific (relatively long) inland stretch over a mountaneous area with high turbulence activity, in combination with a relatively long average flight duration of about 1.2 hours compared to the average of 0.8 hours.
5 Discussion
The main purpose of the present investigation was to get quantitative information about the difference in load experience between aircraft of the same type, but operated by different operators. The only loading parameter for which statistical data were available is the cg. acceleration and although this may be a very relevant parameter one must keep in mind that for certain parts of the structure c.g. acceleration has no relevance at all. For example for the pressure cabin the pressurization cycle is the determining fatigue loading case. For other parts like the wing the aircraft weight, weight distribution, speed etc. also determine the actual loading severity. Hence, one must be careful not to attach absolute value to the damage figures derived in this report. Yet it is felt that the information obtained is very relevant, specifically because of the very large size in terms of flights of the data batch available.
For the pressure cabin the number of pressurization cycles and hence the total number of flights determines the accumulated fatigue damage. Hence, the damage per flight for such structure may be considered as a constant. It is interesting to note from figure 6 that even for typical short haul aircraft like F27 and F28 considerable differences in average flight duration occur; for the F28 all durations between 0.6 and 1.2 hours have about the same probability. In other words, the damage per hour may easily vary from aircraft to aircraft over a factor 2!
Loading in flight of the wing structure is due to gusts and manoeuvres. It is well known that the frequency of these loads does not increase proportionally with flight duration: the majority of gust- and manoeuvre loads occur at low altitude, during climb and descent, and the time spent in these flight phases hardly changes with total flight duration (except for very short flights). Hence, the cg-acceleration experience variation per flight may be expected to be smaller than per flight hour, and this expectation was confirmed by the present data. Still, the difference in average c.g acceleration experience per flight from aircraft to aircraft is considerable, as shown in figure 5. An interesting fact to be noted is that the differences in load factor experience between aircraft operated by the same operator appear small: differences between operators are a result of the differences in network (e.g. mountainous versus overseas stretches) and possibly differences in loading. The latter factor, however, is expected to be of minor importance for the type of aircraft involved.
In this study, a damage index DI was defined to get a quantitative "one figure" measure of the severity of a measured spectrum in terms of fatigue damage. The underlying algorithm is simple, and no absolute accuracy should be expected, but it is felt the DI value is a fair measure. In the derivation of the DI, and in the selection of the material constant k, care was taken not to "overestimate" the variation in damage with variation of acceleration experience. Hence, the
following figures are felt to be no "exaggerations":
- Both for the F27 and the F28, about 80 percent of the aircraft have DI between approximately 0.7 and 1.3, thus covering a range with a width of nearly a factor 2. - A limited number of F27 aircraft, being used in a very specific role, were subject to a load
experience resulting in a DI- value more than two times the fleet average.
- One specific "normal" F28 operator was subjected to a load experience resulting in DI values about 1.8 times the fleet average.
These figures show that inspection intervals and component replacement times, if they are based on an "average" load experience plus an adequate "safety factor" to cover also severely loaded aircraft, must necessarily be very conservative for a large part of the fleet that is subjected to average or "below average" load experience. This implies that considerable advantage could be obtained if inspection schedules for individual aircraft are adapted on the basis of individual aircraft load monitoring data.
6 Conclusions
- Fatigue meter data, obtained during operational flights of Fokker F27 and Fokker F28 aircraft were analysed to study variation in load experience between aircraft.
- The data covered about 470000 flights, made by 101 aircraft owned by 51 operators in different parts of the world.
- The measured average load factor experience per flight was expressed in terms of fatigue damage by means of a derived Damage Index DI. The Damage Index found showed considerable variations from aircraft to aircraft: eighty percent of all aircraft had a DI-value between 0.7 and 1.3, thus covering a range of a factor of about two.
- A limited number of aircraft experienced a DI- value that was more than two times the fleet average.
- The data illustrate the reduction in inspection effort that could be obtained if inspection schemes are be adapted on the basis of individual aircraft load monitoring.
7 Reference
1. Schijve, J., The significance of Flight-Simulation Fatigue Tests.
Table 1 General Overview of recorded data
Aircraft Type Fokker F27 Fokker F28
number of operators 29 25
number of aircraft 63 38
number of recorded flights 319259 149744 number of flight hours 291357 122298
Table 2 Overview of F27 fatigue meter data
Aircraft Operator Cont Flights Hours Flight
duration -0.35g 0.05g 0.45g 0.75g 1.25g 1.55g 1.95g 2.35g 10192 SUD1 AFR 2772 3810 1.374 0 5 119 7643 15767 275 1 0 10193 SUD1 AFR 1490 2297 1.542 0 2 123 1071 845 167 4 1 10204 ANG1 AFR 4498 6427 1.429 0 9 250 9493 23021 483 27 0 10205 ANG1 AFR 4011 6145 1.532 3 4 245 9999 25666 586 18 0 10207 ANG2 AFR 1484 1682 1.133 0 4 65 3162 18245 168 4 0 10217 NIG1 AFR 8707 7603 0.873 5 22 457 15045 25614 819 27 1 10275 LIB1 AFR 4194 6171 1.471 0 7 484 19657 23730 907 8 0 10342 LIB2 AFR 1765 3037 1.721 0 2 148 7955 14100 238 2 0 10436 LIB1 AFR 1222 1786 1.462 0 3 106 5298 10567 211 4 0 10450 IVC1 AFR 1072 1527 1.424 2 7 81 3203 3956 114 5 0 10469 IVC1 AFR 834 874 1.048 0 1 38 2342 3874 113 7 0 10150 JOR1 ASI 361 190 0.526 1 2 37 1304 2841 121 10 1 10226 SIN1 ASI 2959 2195 0.742 2 4 162 5719 11906 310 4 0 10239 KOR1 ASI 5157 4905 0.951 2 21 722 10592 43712 1635 34 2 10240 KOR1 ASI 5092 4857 0.954 1 15 589 16580 43431 1381 42 5 10290 NEP1 ASI 2474 4354 1.760 0 10 265 8825 17159 494 15 0 10316 EMI1 ASI 5864 4275 0.729 1 5 419 10159 30362 306 27 0 10325 EMI1 ASI 3927 2772 0.706 0 1 74 4171 8894 168 12 2 10111 AUS1 AUS 6722 5003 0.744 0 1 354 22345 36227 765 2 0 10113 AUS1 AUS 6216 5084 0.818 0 0 349 15762 32520 633 0 0 10114 AUS1 AUS 6116 4737 0.775 0 0 329 16097 36377 860 2 0 10120 AUS2 AUS 2490 1645 0.661 0 1 307 10613 24862 988 1 0 10121 AUS1 AUS 6308 5154 0.817 0 0 347 17172 39808 881 5 0 10122 AUS1 AUS 6480 5163 0.797 0 2 358 17283 31320 985 4 0 10127 AUS3 AUS 7822 5861 0.749 0 0 280 10576 43570 972 0 0 10131 AUS2 AUS 1399 2205 1.576 0 0 245 14444 40093 1082 4 0 10132 AUS2 AUS 1244 2024 1.627 0 0 221 12315 32194 868 1 0 10134 AUS1 AUS 3677 3628 0.987 0 0 102 4087 7769 169 0 0 10135 AUS1 AUS 3720 3599 0.967 0 0 103 3519 3654 225 2 0 10138 AUS1 AUS 4822 4708 0.976 0 2 212 10693 38447 931 4 0 10139 AUS4 AUS 5597 9647 1.724 0 1 296 14568 28509 555 1 0 10166 NZE1 AUS 14453 12224 0.846 0 99 1802 57719 78648 2354 64 0 10167 NZE1 AUS 13144 11310 0.860 0 50 1845 65332 73546 2147 55 0 10168 NZE1 AUS 14384 12327 0.857 0 101 1709 55883 74431 2353 64 0 10169 NZE1 AUS 13265 9383 0.707 0 63 1559 45810 73575 2529 62 0 10184 NZE1 AUS 12120 10504 0.867 0 150 1997 52257 71838 3523 86 0 10185 NZE1 AUS 11171 9651 0.864 0 53 1737 48483 78460 2752 65 0 10189 NZE1 AUS 12906 11476 0.889 0 66 1569 53642 71784 2089 54 0 10190 NZE1 AUS 11599 9657 0.833 0 50 1819 47970 55463 1791 82 0 10284 AUS1 AUS 5059 4627 0.915 0 0 167 8943 22066 435 0 0 10329 AUS1 AUS 4561 4876 1.069 0 1 1277 15900 22125 600 2 0 10444 NZE2 AUS 1030 1765 1.714 0 0 185 10034 21201 968 19 0 10445 NZE2 AUS 713 1220 1.711 0 6 187 11460 21286 641 7 0
Aircraft Operator Cont Flights Hours Flight duration -0.35g 0.05g 0.45g 0.75g 1.25g 1.55g 1.95g 2.35g 10102 GER1 EUR 3871 4164 1.076 0 10 334 11822 20520 776 20 1 10108 NOR1 EUR 4674 3479 0.744 0 10 331 7510 9187 651 19 0 10116 NOR1 EUR 1992 3051 1.532 0 7 276 2643 1844 1118 14 0 10186 GER1 EUR 1459 2602 1.783 0 8 135 4106 10470 331 17 0 10224 LUX1 EUR 7179 4176 0.582 0 11 797 31007 58508 1894 31 1 10268 GER2 EUR 1537 1409 0.917 0 0 96 3610 7132 192 8 0 10269 LUX1 EUR 8201 5759 0.702 1 10 489 16479 20101 782 23 0 10270 GER2 EUR 1412 1375 0.974 0 8 132 4121 6278 176 9 0 10274 ICE1 EUR 12494 9356 0.749 4 59 1098 45023 88067 5482 250 22 10300 ICE1 EUR 10840 9256 0.854 9 82 1719 41606 90523 5346 280 28 10332 SPA1 EUR 2487 1795 0.722 0 2 121 7480 13339 295 8 0 10341 DAN1 EUR 1335 2193 1.643 1 6 71 2602 7124 268 6 0 10343 SPA1 EUR 2053 1827 0.890 0 5 100 6325 10022 210 5 0 10360 BEL1 EUR 7284 5829 0.800 1 8 401 15245 32277 514 7 1 10366 FRA1 EUR 5844 4381 0.750 2 4 168 7915 40365 2614 85 14 10367 FRA1 EUR 2915 2645 0.907 0 1 180 5705 16238 706 28 4 10369 FRA2 EUR 1011 604 0.597 0 1 78 3181 5712 377 14 1 10370 FRA2 EUR 809 568 0.702 0 3 71 2174 4014 152 10 3 10364 NAN1 SAM 4816 3338 0.693 0 2 103 5193 29481 816 10 1 10365 NAN1 SAM 2145 1165 0.543 0 4 53 2366 6997 208 5 0 all aircraft (63) 319259 291357 0.913 35 1011 30493 1011238 1861662 63500 1686 88
Table 3 Overview of F28 fatigue meter data
Aircraft Operator Cont Flights Hours Flight
duration -0.35 g 0.05 g 0.45 g 0.75 g 1.25 g 1.55 g 1.95 g 2.35 g 11053 NIG1 AFR 4274 3322 0.777 2 2 236 9382 9987 476 11 1 11079 UNO2 AFR 374 212 0.567 0 2 9 228 3294 212 4 0 11993 NIG1 AFR 8695 6799 0.782 3 12 357 16442 32181 1170 30 2 12001 GHA1 AFR 2752 1781 0.647 2 13 180 5620 8314 240 12 1 12002 GHA1 AFR 264 357 1.352 0 1 17 851 1430 43 1 0 12003 NIG1 AFR 208 322 1.548 0 0 10 371 1464 41 3 0 12005 GAB1 AFR 4262 2171 0.509 0 5 203 6849 15255 399 13 0 12006 GAB1 AFR 4569 2337 0.511 1 1 172 6208 15110 277 15 1 12007 GAB1 AFR 262 430 1.641 0 1 19 760 955 19 2 0 11033 CAN1 AME 8466 7500 0.886 0 1 120 10013 15642 504 34 5 11038 CAN1 AME 7326 6406 0.874 1 5 133 10902 18978 804 38 5 11059 PER1 AME 9563 9149 0.957 5 18 391 21402 33160 1138 52 6 11085 ARG1 AME 6863 4178 0.609 3 26 650 19612 19750 1410 64 7 12010 PER1 AME 188 225 1.197 0 0 7 543 710 14 1 0 12011 UNO2 AME 180 165 0.917 0 1 16 606 2505 54 1 0 11035 INO1 ASI 7271 7156 0.984 0 7 282 11372 14751 587 14 0 11042 INO2 ASI 303 263 0.868 0 1 34 517 1341 54 0 0 12004 BIR1 ASI 2488 2287 0.919 2 12 193 6638 8733 485 20 1 12008 BAD1 ASI 2044 1300 0.636 2 10 109 4446 8433 100 15 0 12009 BAD1 ASI 649 364 0.561 0 1 12 551 1914 69 0 0 11026 AUS5 AUS 1466 953 0.650 4 7 133 6107 8665 266 9 0 11001 HOL1 EUR 2642 1101 0.417 0 28 943 7179 16006 1367 170 19 11003 HOL1 EUR 6920 4959 0.717 2 18 439 16314 32065 1185 56 12 11004 GER1 EUR 307 432 1.407 0 0 9 1361 1942 47 0 0 11008 HOL2 EUR 4082 4898 1.200 1 9 305 11427 23733 1605 28 0 11009 NOR1 EUR 17101 8487 0.496 0 19 652 35964 62320 2031 36 1 11014 ITA1 EUR 9742 8281 0.850 4 40 850 32499 67069 2475 65 2 11017 SPA1 EUR 5837 7394 1.267 3 71 1510 43207 66788 4028 308 35 11019 SPA1 EUR 5114 6222 1.217 4 33 1102 45223 70785 3198 218 27 11023 SPA1 EUR 5534 6364 1.150 4 44 1269 31327 62537 3860 215 24 11027 GER4 EUR 1897 2782 1.467 1 5 101 4113 16163 901 54 12 11046 GER3 EUR 963 963 1.000 3 8 36 1308 2577 102 2 0 11057 TUR1 EUR 2963 2123 0.717 0 1 126 7103 13126 564 6 1 11067 SWE1 EUR 11170 7366 0.659 3 16 429 23972 31020 2233 23 0 12013 SWE1 EUR 974 678 0.696 0 15 80 1290 2773 30 0 0 12014 SWE1 EUR 480 380 0.792 0 0 10 1145 2325 37 0 0 11041 UNO1 UNO 1186 1956 1.649 2 4 78 2710 6315 158 5 1 12012 UNO3 UNO 365 235 0.644 0 2 44 1577 2936 90 3 0 all aircraft (38) 149744 122298 0.817 52 439 11266 407139 703052 32273 1528 163
Table 4 Calculation of damage index F27 fatigue meter damage
Aircraft Operator Cont Damage GAG Damage SPEC Damage TOT Damage Index Damage/hour
10192 SUD1 AFR 0.3277 0.2688 0.5964 0.9251 0.6707 10193 SUD1 AFR 0.1877 0.0600 0.2476 0.3841 0.2483 10204 ANG1 AFR 0.3262 0.2222 0.5484 0.8505 0.5932 10205 ANG1 AFR 0.3410 0.2687 0.6098 0.9457 0.6151 10207 ANG2 AFR 0.3508 0.3539 0.7047 1.0930 0.9609 10217 NIG1 AFR 0.3035 0.1567 0.4602 0.7137 0.8145 10275 LIB1 AFR 0.3499 0.3462 0.6961 1.0796 0.7312 10342 LIB2 AFR 0.3450 0.4052 0.7503 1.1636 0.6739 10436 LIB1 AFR 0.3544 0.4132 0.7676 1.1905 2.0627 10450 IVC1 AFR 0.3147 0.2254 0.5401 0.8377 0.5881 10469 IVC1 AFR 0.3288 0.2441 0.5729 0.8885 0.6216 10150 JOR1 ASI 0.3780 0.3802 0.7582 1.1759 2.2264 10226 SIN1 ASI 0.3176 0.1875 0.5051 0.7834 1.0523 10239 KOR1 ASI 0.3772 0.3025 0.6798 1.0543 1.1046 10240 KOR1 ASI 0.3705 0.3647 0.7353 1.1404 1.1914 10290 NEP1 ASI 0.3532 0.3371 0.6903 1.0707 0.6062 10316 EMI1 ASI 0.3126 0.2024 0.5150 0.7987 1.0917 10325 EMI1 ASI 0.2822 0.1052 0.3873 0.6007 0.8481 10111 AUS1 AUS 0.3292 0.2837 0.6129 0.9506 1.2727 10113 AUS1 AUS 0.3257 0.2244 0.5501 0.8532 1.0395 10114 AUS1 AUS 0.3378 0.2421 0.5799 0.8994 1.1572 10120 AUS2 AUS 0.3922 0.4344 0.8267 1.2822 1.9340 10121 AUS1 AUS 0.3394 0.2548 0.5942 0.9216 1.1239 10122 AUS1 AUS 0.3333 0.2391 0.5723 0.8877 1.1102 10127 AUS3 AUS 0.3324 0.1661 0.4985 0.7732 1.0283 10131 AUS2 AUS 0.4465 1.0561 1.5026 2.3305 1.4734 10132 AUS2 AUS 0.4391 0.9795 1.4186 2.2002 1.3476 10134 AUS1 AUS 0.2801 0.0932 0.3733 0.5790 0.5847 10135 AUS1 AUS 0.2430 0.0556 0.2986 0.4631 0.4770 10138 AUS1 AUS 0.3559 0.2809 0.6369 0.9878 1.0081 10139 AUS4 AUS 0.3242 0.2430 0.5672 0.8797 0.5086 10166 NZE1 AUS 0.3392 0.3168 0.6561 1.0175 1.1989 10167 NZE1 AUS 0.3402 0.3563 0.6965 1.0803 1.2511 10168 NZE1 AUS 0.3377 0.3051 0.6428 0.9970 1.1593 10169 NZE1 AUS 0.3448 0.2989 0.6437 0.9983 1.4064 10184 NZE1 AUS 0.3633 0.3548 0.7181 1.1137 1.2805 10185 NZE1 AUS 0.3614 0.3774 0.7387 1.1457 1.3215 10189 NZE1 AUS 0.3397 0.3257 0.6654 1.0321 1.1566
Aircraft Operator Cont Damage GAG Damage SPEC Damage TOT Damage Index Damage/hour 10190 NZE1 AUS 0.3334 0.3045 0.6379 0.9893 1.1841 10284 AUS1 AUS 0.3162 0.1728 0.4890 0.7584 0.8262 10329 AUS1 AUS 0.3295 0.2805 0.6100 0.9461 0.8818 10444 NZE2 AUS 0.4601 0.8414 1.3015 2.0186 1.3763 10445 NZE2 AUS 0.4573 1.4728 1.9301 2.9935 1.7408 10102 GER1 EUR 0.3451 0.2736 0.6187 0.9596 0.8889 10108 NOR1 EUR 0.2918 0.1286 0.4204 0.6521 0.8730 10116 NOR1 EUR 0.2180 0.1298 0.3478 0.5394 0.3509 10186 GER1 EUR 0.3588 0.3072 0.6660 1.0330 0.5772 10224 LUX1 EUR 0.3682 0.3990 0.7672 1.1899 2.0385 10268 GER2 EUR 0.3266 0.1978 0.5244 0.8133 0.8841 10269 LUX1 EUR 0.2960 0.1511 0.4471 0.6934 0.9839 10270 GER2 EUR 0.3251 0.2453 0.5704 0.8847 0.9053 10274 ICE1 EUR 0.3898 0.3617 0.7516 1.1656 1.5511 10300 ICE1 EUR 0.4012 0.4211 0.8223 1.2753 1.4883 10332 SPA1 EUR 0.3301 0.2714 0.6015 0.9329 1.2880 10341 DAN1 EUR 0.3453 0.2200 0.5653 0.8768 0.5319 10343 SPA1 EUR 0.3236 0.2632 0.5868 0.9100 1.0190 10360 BEL1 EUR 0.3130 0.2061 0.5191 0.8051 1.0025 10366 FRA1 EUR 0.3905 0.2130 0.6035 0.9360 1.2442 10367 FRA1 EUR 0.3536 0.2250 0.5786 0.8974 0.9856 10369 FRA2 EUR 0.3741 0.2913 0.6655 1.0321 1.7215 10370 FRA2 EUR 0.3406 0.2511 0.5917 0.9177 1.3025 10364 NAN1 SAM 0.3441 0.1724 0.5165 0.8011 1.1518 10365 NAN1 SAM 0.3082 0.1283 0.4365 0.6769 1.2420 all a/c 0.3479 0.2969 0.6448 1.0000 1.0958
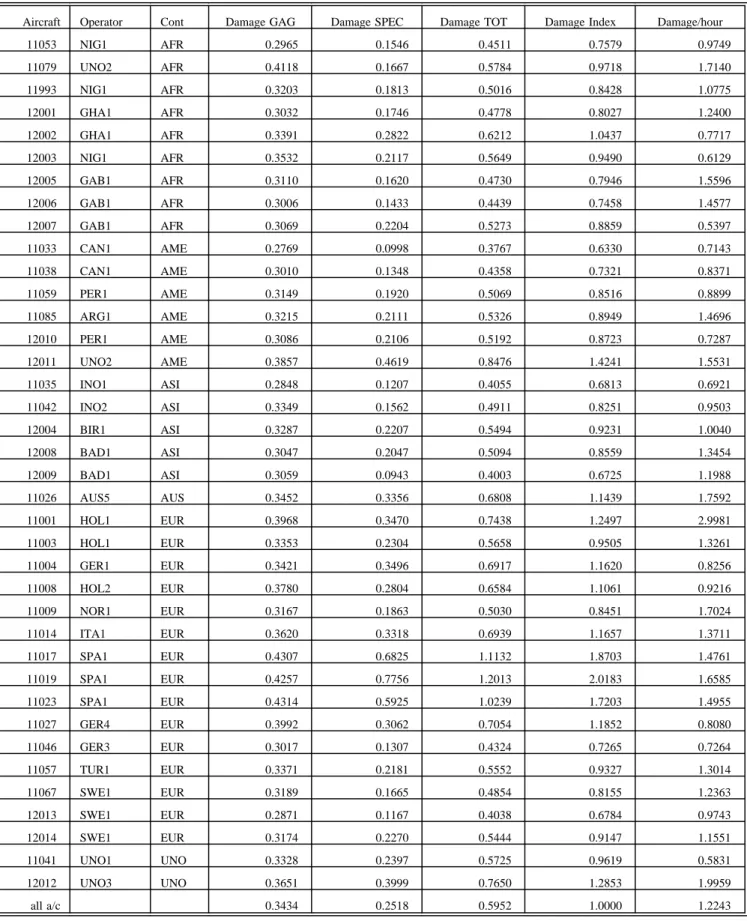
Table 5 Calculation of damage index F28 fatigue meter data
Aircraft Operator Cont Damage GAG Damage SPEC Damage TOT Damage Index Damage/hour 11053 NIG1 AFR 0.2965 0.1546 0.4511 0.7579 0.9749 11079 UNO2 AFR 0.4118 0.1667 0.5784 0.9718 1.7140 11993 NIG1 AFR 0.3203 0.1813 0.5016 0.8428 1.0775 12001 GHA1 AFR 0.3032 0.1746 0.4778 0.8027 1.2400 12002 GHA1 AFR 0.3391 0.2822 0.6212 1.0437 0.7717 12003 NIG1 AFR 0.3532 0.2117 0.5649 0.9490 0.6129 12005 GAB1 AFR 0.3110 0.1620 0.4730 0.7946 1.5596 12006 GAB1 AFR 0.3006 0.1433 0.4439 0.7458 1.4577 12007 GAB1 AFR 0.3069 0.2204 0.5273 0.8859 0.5397 11033 CAN1 AME 0.2769 0.0998 0.3767 0.6330 0.7143 11038 CAN1 AME 0.3010 0.1348 0.4358 0.7321 0.8371 11059 PER1 AME 0.3149 0.1920 0.5069 0.8516 0.8899 11085 ARG1 AME 0.3215 0.2111 0.5326 0.8949 1.4696 12010 PER1 AME 0.3086 0.2106 0.5192 0.8723 0.7287 12011 UNO2 AME 0.3857 0.4619 0.8476 1.4241 1.5531 11035 INO1 ASI 0.2848 0.1207 0.4055 0.6813 0.6921 11042 INO2 ASI 0.3349 0.1562 0.4911 0.8251 0.9503 12004 BIR1 ASI 0.3287 0.2207 0.5494 0.9231 1.0040 12008 BAD1 ASI 0.3047 0.2047 0.5094 0.8559 1.3454 12009 BAD1 ASI 0.3059 0.0943 0.4003 0.6725 1.1988 11026 AUS5 AUS 0.3452 0.3356 0.6808 1.1439 1.7592 11001 HOL1 EUR 0.3968 0.3470 0.7438 1.2497 2.9981 11003 HOL1 EUR 0.3353 0.2304 0.5658 0.9505 1.3261 11004 GER1 EUR 0.3421 0.3496 0.6917 1.1620 0.8256 11008 HOL2 EUR 0.3780 0.2804 0.6584 1.1061 0.9216 11009 NOR1 EUR 0.3167 0.1863 0.5030 0.8451 1.7024 11014 ITA1 EUR 0.3620 0.3318 0.6939 1.1657 1.3711 11017 SPA1 EUR 0.4307 0.6825 1.1132 1.8703 1.4761 11019 SPA1 EUR 0.4257 0.7756 1.2013 2.0183 1.6585 11023 SPA1 EUR 0.4314 0.5925 1.0239 1.7203 1.4955 11027 GER4 EUR 0.3992 0.3062 0.7054 1.1852 0.8080 11046 GER3 EUR 0.3017 0.1307 0.4324 0.7265 0.7264 11057 TUR1 EUR 0.3371 0.2181 0.5552 0.9327 1.3014 11067 SWE1 EUR 0.3189 0.1665 0.4854 0.8155 1.2363 12013 SWE1 EUR 0.2871 0.1167 0.4038 0.6784 0.9743 12014 SWE1 EUR 0.3174 0.2270 0.5444 0.9147 1.1551 11041 UNO1 UNO 0.3328 0.2397 0.5725 0.9619 0.5831 12012 UNO3 UNO 0.3651 0.3999 0.7650 1.2853 1.9959 all a/c 0.3434 0.2518 0.5952 1.0000 1.2243
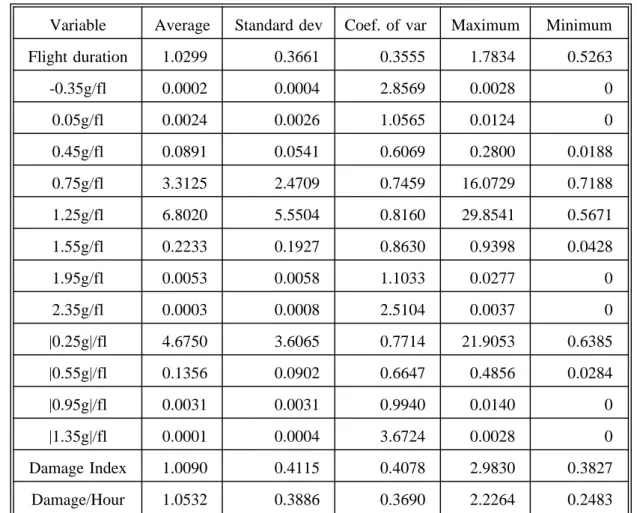
Table 6 Statistical properties F27 fatigue meter date
Variable Average Standard dev Coef. of var Maximum Minimum Flight duration 1.0299 0.3661 0.3555 1.7834 0.5263 -0.35g/fl 0.0002 0.0004 2.8569 0.0028 0 0.05g/fl 0.0024 0.0026 1.0565 0.0124 0 0.45g/fl 0.0891 0.0541 0.6069 0.2800 0.0188 0.75g/fl 3.3125 2.4709 0.7459 16.0729 0.7188 1.25g/fl 6.8020 5.5504 0.8160 29.8541 0.5671 1.55g/fl 0.2233 0.1927 0.8630 0.9398 0.0428 1.95g/fl 0.0053 0.0058 1.1033 0.0277 0 2.35g/fl 0.0003 0.0008 2.5104 0.0037 0 |0.25g|/fl 4.6750 3.6065 0.7714 21.9053 0.6385 |0.55g|/fl 0.1356 0.0902 0.6647 0.4856 0.0284 |0.95g|/fl 0.0031 0.0031 0.9940 0.0140 0 |1.35g|/fl 0.0001 0.0004 3.6724 0.0028 0 Damage Index 1.0090 0.4115 0.4078 2.9830 0.3827 Damage/Hour 1.0532 0.3886 0.3690 2.2264 0.2483
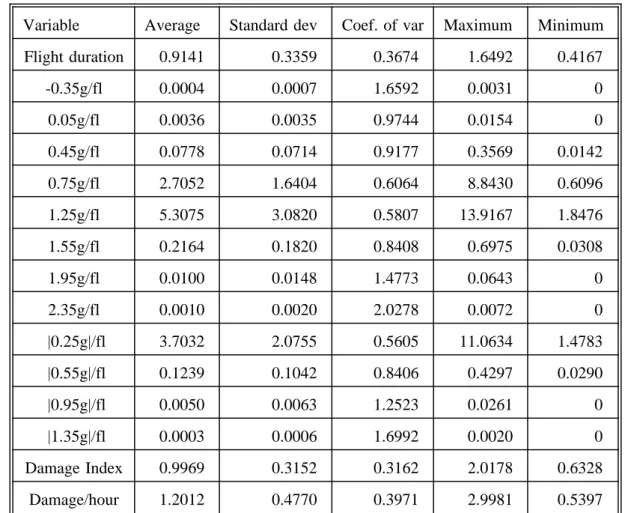
Table 7 Statistical properties F28 fatigue meter data
Variable Average Standard dev Coef. of var Maximum Minimum Flight duration 0.9141 0.3359 0.3674 1.6492 0.4167 -0.35g/fl 0.0004 0.0007 1.6592 0.0031 0 0.05g/fl 0.0036 0.0035 0.9744 0.0154 0 0.45g/fl 0.0778 0.0714 0.9177 0.3569 0.0142 0.75g/fl 2.7052 1.6404 0.6064 8.8430 0.6096 1.25g/fl 5.3075 3.0820 0.5807 13.9167 1.8476 1.55g/fl 0.2164 0.1820 0.8408 0.6975 0.0308 1.95g/fl 0.0100 0.0148 1.4773 0.0643 0 2.35g/fl 0.0010 0.0020 2.0278 0.0072 0 |0.25g|/fl 3.7032 2.0755 0.5605 11.0634 1.4783 |0.55g|/fl 0.1239 0.1042 0.8406 0.4297 0.0290 |0.95g|/fl 0.0050 0.0063 1.2523 0.0261 0 |1.35g|/fl 0.0003 0.0006 1.6992 0.0020 0 Damage Index 0.9969 0.3152 0.3162 2.0178 0.6328 Damage/hour 1.2012 0.4770 0.3971 2.9981 0.5397
Appendix
A Development of a damage index DI
In the following, an algorithm will be derived to calculate a relative damage figure associated with a measured load factor spectrum per flight.
The basic assumptions that underlay this derivation are as follows:
a. "Damage rule": The fatigue damage (or inherent crack growth damage ) of a load cycle is proportional to the amplitude to the power k:
D(cycle dS) ÷ (dS)^k. (A.1)
The value of the slope factor k is a material-dependent constant.
b. "Load cycle content": The load cycle content of a flight consists of two parts, namely the "g-spectrum loads", associated with gusts and manoeuvres, and the "Ground-Air-Ground" or GAG cycle.
The GAG cycle is defined by the lowest stress occurring once per flight while the aircraft is standing on the ground (Sgr), and the highest stress reached on the average once per flight (Sonce).
The load cycles associated with the g-spectrum are defined by the "symmetrized" load factor exceedance data. The number of load cycles with an amplitude equal to dn or larger is taken equal to the symmetrized number of exceedings of dn, y(dn).
The smallest load cycles to be included in the damage calculation have an amplitude corresponding with dn=0.1
c. "Normalization": The Damage Index must give a relative measure of the damage associated with a specific load spectrum: its absolute value is irrelevant: For this reason, calculated damages will be "normalized" by division by the Damage corresponding to the average spectrum pertaining to "all flights" for the specific aircraft type.
d. "Structural Location": In principle, the Damage Index refers to one specific structural location. In the present study, the DI-values for both the F27 and the F28 refer to the lower wing skin near the wing root.
In the present study, the following numerical values were adopted:
Ground stress level: The lowest stress reached on the ground is just equal to zero.
The slope factor k has been taken as k=3; this value lies in the lower band of the values found in flight simulation fatigue and crack growth tests under transport aircraft wing test spectra (ref. 1)
The mathematical derivation of the DI- equation is given below
i) Calculation of GAG damage
Load factor level exceeded once per flight:
Xonceis found by log-linear interpolation between the exceedance frequencies of the acceleration levels x1(∆n = 0.25) and x2(∆n = 0.55):
Amplitude of the GAG cycle:
(A.2) xonce x2 log yp(x1) x1 log yp(x2)
log yp(x1) log yp(x2)
With xground = o
(A.3) SGAG xonce 1 xground
2
Damage due to GAG cycle: DGAG= (SGAG)k (A.4)
ii) Calculation of damage of spectrum loads
Number of cycles with amplitude x*, x < x* < x + dx is equal to
Damage due to cycles with amplitude between x and xu: y (x) d(y) dx with D(x) = xk (A.5) SD ⌡⌠ xu x D(x) y (x)dx
y(x) is an exponential function between xiand xi+1
log y(x) = log y(xi) + ai(x - xi)
(A.6)
y’(x) between xiand xi+1can be written: ai log y(xi 1) log y(xi)
xi 1 xi or y’(x) = bieaix (A.7) y (x) y(xi)e aixi a i e aix (A.8) with bi ai e aixi y(x i)
The spectrum damage SD may now be calculated from: SD 3 i 1 SDi SD1 b1 ⌡⌠ x2 x xk e a1x dx, x 0.10 SD2 b2 ⌡⌠ x3 x2 xk e a2x dx, if y(x 3) ≠ 0 (A.9) SD2 b1 ⌡⌠ x3 x2 xk e a1x dx, if y(x 3) 0 SD3 b3 ⌡⌠ x4 x3 xk e a3x dx, if y(x 4) ≠ 0 SD3 0 if y(x4) 0
iii) Calculation of total damage The total damage is equal to
(A.10) Dtot SD DGAG
iv) Calculation of damage index DI
The total damage per flight pertaining to all aircraft is called Dtot,all. The Damage Index for aircraft j is calculated from:
(A.11) DIj (Dtot)j