Epidemiological analysis of pulmonary tuberculosis
in Sichuan Province, China, 2000—2006
Xiao-yan Yang
a, Ning-mei Zhang
b, Xiang Diao
c, Xiu Mao
a, You-ping Li
a,*
aChinese Evidence-Based Medicine Center, West China Hospital, Sichuan University, Chengdu 610041, Sichuan Province, China
b
Sichuan Provincial Center for Disease Control and Prevention, Chengdu, Sichuan Province, China cEditorial Board, Chinese Journal of Evidence-Based Medicine, West China Hospital, Sichuan University, Chengdu, Sichuan Province, China
Received 20 September 2007; received in revised form 11 January 2008; accepted 22 February 2008 Corresponding Editor:William Cameron, Ottawa, Canada
http://intl.elsevierhealth.com/journals/ijid KEYWORDS Pulmonary tuberculosis; Incidence; Mortality; Epidemiology; Sichuan Province; China Summary
Objectives: To investigate the epidemiological features of pulmonary tuberculosis in Sichuan Province, China, for the period 2000—2006.
Materials and methods: Data from the China Information System for Disease Control and Prevention, the World Health Organization, and the high caseload provinces in China were collected. This was a descriptive study, and the Besag and Newell method was applied.
Results: From 2000 to 2006, the incidence rate of pulmonary tuberculosis increased from 54 to 103/100 000, the mortality rate increased from 0.02 to 0.30/100 000, and the case—fatality rate increased from 0.04% to 0.29%. The age groups 20—24, 65—69, and 70—74 years had higher incidences. There were more cases and deaths in males compared to females. Peasants con-tributed the most to caseloads (64%) and deaths (69%) in the total population. The north and west regions of Sichuan Province had higher incidences. Sichuan had a higher incidence, mortality rate, and case—fatality rate than both the national level and Henan Province between 2001 and 2003. It also had a higher prevalence of active tuberculosis and smear-positive pulmonary tuberculosis than the national level and Guangdong Province after 1990. Multidrug-resistant tuberculosis is a major problem in China compared to India and Indonesia.
Conclusions: Sichuan should be the most important province in China with regard to tuberculosis prevention and control, especially for male peasants from the north and west regions and the active pulmonary tuberculosis and sputum smear-positive cases. The major challenge is multi-drug-resistant tuberculosis.
#2008 International Society for Infectious Diseases. Published by Elsevier Ltd. All rights reserved.
* Corresponding author. Tel.: +86 28 85423040; fax: +86 28 85422253.
E-mail address:ccebm@126.com(Y.-p. Li).
1201-9712/$32.00#2008 International Society for Infectious Diseases. Published by Elsevier Ltd. All rights reserved. doi:10.1016/j.ijid.2008.02.011
Introduction
It is estimated that there are 8.8 million new cases of tuberculosis worldwide every year, among which 3.9 million are infectious cases, and approximately 2 million will die of the disease. The World Health Organization (WHO) declared in 1993 that world tuberculosis control was an emergency. Tuberculosis has become one of the most significant infec-tious diseases worldwide. China is among the top 22 high tuberculosis burden countries in the world, and had the second heaviest caseload in 2005,1being listed top of the countries that need special consideration.
Sichuan Province, located in the southwest of China, consists of 21 regions and 181 counties, with a population of 86.42 million people at the end of 2005.2Sichuan has been
ranked as the second largest tuberculosis caseload province in China in recent years. Tuberculosis is in the top two infectious diseases in Sichuan. Although the planned vacci-nation procedure and the directly observed treatment, short-course (DOTs) have remained unchanged, the trends in incidence and mortality rate have increased.
Comparisons of epidemiological data among high burden tuberculosis countries and studies analyzing epidemiological features of pulmonary tuberculosis over several continuous years at the provincial level in China are sparse. This study aimed to investigate the epidemiological features of pulmon-ary tuberculosis in Sichuan Province, China, from 2000 to 2006, and to make comparisons with other high burden tuberculosis regions in China and worldwide. This should serve to facilitate the updating of pulmonary tuberculosis control strategies and to improve prevention and treatment.
Materials and methods
This study was based on the China Information System for Disease Control and Prevention (CISDCP), using Sichuan data. The Chinese legal infectious diseases reporting system was established in 1950, and the Law of the People’s Republic of China on the Prevention and Treatment of Infectious Diseases was issued in 1989, creating the CISDCP. This system in Sichuan Province covers the whole population (86.42 million people in 2005) as well as three categories of infectious diseases including pulmonary tuberculosis. All the hospitals and clinics in Sichuan Province are obliged to report every newly diagnosed pulmonary tuberculosis patient and any deaths from pulmonary tuberculosis to the local disease prevention and control center. The local center collects data from the hospitals and clinics, checks it, and reports to the upper-level organizations in the same system.
Qualified clinicians make the diagnosis of pulmonary tuberculosis based on the clinical symptoms, results of chest X-ray, etiological detection, and pathological examination.3 Cause of death is identified through expert group discussion, and deaths from pulmonary tuberculosis must satisfy the following criteria: (1) diagnosed as pulmonary tuberculosis, (2) died from conditions resulting directly from pulmonary tuberculosis.
Operational definitions of the indices: Incidence rate — the number of newly diagnosed pulmonary tuberculosis cases in one region divided by the whole population in the same region during one year. Mortality rate — the number of cases
that died of pulmonary tuberculosis in one region divided by the whole population in the same region during one year. Case—fatality rate — the number of cases that died of pulmonary tuberculosis in one region divided by the total number of pulmonary tuberculosis disease cases in the same region during one year.
Besag and Newell’s method was used to analyze the spatial distribution to explore if there were clusters in the incidence of pulmonary tuberculosis in the 181 counties of Sichuan Province. This method sets a circle window in which the threshold of the cases is included, and the window moved in the targeted areas, comparing the incidence with the expected value. Statistical analysis was conducted by means of Monte Carlo simulation sampling to identify the high incidence counties in Sichuan. This was accomplished using ClusterSeer 2.2 software. MapInfo 7.0 was used to present the statistical results.
Using data from the WHO and the high caseload provinces in China (Sichuan, Henan, and Guangdong provinces), a comparison was carried out to reveal the features of pul-monary tuberculosis in Sichuan Province.
Results
Epidemiology of pulmonary tuberculosis in Sichuan Province, 2000—2006
Incidence rate, mortality rate, and case—fatality rate
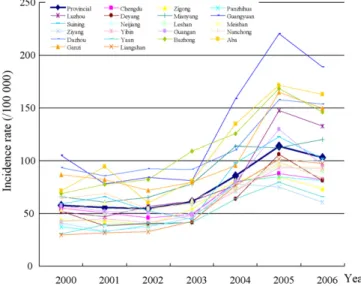
The trend in the incidence of pulmonary tuberculosis in Sichuan Province increased from 2000 to 2006. It remained at 54—61/100 000 from 2000 to 2003, then increased con-siderably and reached 114/100 000 in 2005, after which it dropped to 103/100 000 in 2006. The incidence trend for each of the 21 regions was similar to that of the provincial average level (Figure 1). Regions that had higher incidences than the provincial average level included Aba Tibetan and Qiang Nationality Autonomous Region, Ganzi Tibetan Nation-ality Autonomous Region, Guangyuan, Bazhong, Dachuan, Mianyang, Suining, Guangan, and Luzhou. The sharp increase
Figure 1 Pulmonary tuberculosis incidence rate for the 21 regions of Sichuan Province, 2000—2006.
in the incidence after 2003 revealed an aggravation of pul-monary tuberculosis in Sichuan Province in recent years.
The trend in the mortality rate also increased. It increased slowly from 0.02 to 0.11/100 000 from 2000 to 2004, and then increased more quickly to reach 0.30/100 000 in 2006 (Figure 2). The case—fatality rate also showed an upward tendency, from 0.04% in 2000 to 0.29% in 2006 — a 7-fold increase (Figure 2).
The significant increases in the mortality rate and the case—fatality rate occurred one year after that of the inci-dence rate. The inciinci-dence rate dropped after 2005, while the mortality rate and the case—fatality rate reached a peak in 2006; it was expected that these would go downward in 2007. An increase in the incidence should alert to the possible upward trend in deaths in the next year, showing that it is of vital importance to speed up information feedback in the disease prevention and treatment system to guide patient treatment, follow-up, and management.
Age distribution
The incidence went up gradually in the 0—4 to 10—14 age groups and thereafter it increased steeply to reach its peak in those aged 20—24, and then decreased. It increased again after 50 years of age to a peak in the 65—69 or 70—74 years age groups, and then decreased. There was a small peak in those aged 40—44 in 2004—2006. The incidence in those aged 15 years and older was lower in 2000—2003 than in 2004— 2006, except for the 25—29-years age group in 2004 (74.31/ 100 000) and 2000 (74.95/100 000). There was little differ-ence in the 0—4, 5—9, and 10—14 age groups through 2000— 2006 (Figure 3).
Gender distribution
Taking the denominator female as 1, the gender ratios (male to female) of all cases in 2000—2006 were 1.92, 1.96, 2.14, 2.17, 2.33, 2.36, and 2.35, respectively, and the ratios of deaths were 3.00, 1.69, 4.14, 3.00, 2.54, 2.88, and 3.90, respectively.
Occupational distribution
Peasants contributed the most to new cases of pulmonary tuberculosis with an annual average of 40 768 cases (account-ing for 64% of all cases), followed by students (7%), workers (6%), job-waiting (4%), and retired workers (4%) (Figure 4). Annual average deaths were highest in peasants, accounting for 69% of the total deaths from pulmonary tuberculosis (107 in total); retired worker ranked second (9%).
Spatial distribution of the new cases of pulmonary tuberculosis
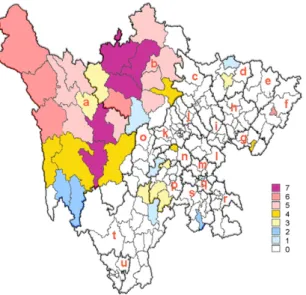
The zone codes of the 181 counties in Sichuan Province, latitude and longitude, new cases, and the exposed popula-tion by county for each year were collected, statistical analysis carried out, and the size of a test (a) equaled to 0.05.Figure 5shows the regions that had significantly higher incidences in Sichuan. It demonstrates that the clustered counties were mainly located in the north and west of Sichuan during the period 2000—2006.
Time distribution
The monthly average new cases of pulmonary tuberculosis fluctuated from 3017 to 7569 with a median of 5379. The sequence from highest to lowest number of new cases was January, March, April, May, June, July, August, February, September, October, November, and December. The monthly average deaths from pulmonary tuberculosis fluctuated from four in December to 14 in August, with a median of nine (Table 1).
Comparison between Sichuan and other high tuberculosis provinces in China
According to Chinese surveillance data (Chinese Center for Disease Control and Prevention, China Tuberculosis 2005 Annual Report), the three provinces that had the most new cases of pulmonary tuberculosis were Henan, Sichuan, and Guangdong, respectively. This study compared the epi-demiological features of pulmonary tuberculosis in these
Figure 2 Pulmonary tuberculosis mortality rate/case—fatality rate in Sichuan Province, 2000—2006.
Figure 3 Pulmonary tuberculosis incidence rate by age group in Sichuan Province, 2000—2006. Age group example: ‘25—29’ means people aged 25 years to 29 years inclusive.
Figure 4 Occupational distribution of year-average new cases of pulmonary tuberculosis in Sichuan Province, 2000—2006.
three provinces using two sources of data, i.e., data from the infectious diseases reporting system and cross-sectional sur-veys.
Comparison of infectious diseases reporting data4—6— incidence rate, mortality rate, and case—fatality rate (Table 2)
The incidence of pulmonary tuberculosis increased in the period 2001 to 2003. Sichuan had a higher incidence com-pared to Henan and the national level throughout this period. The national mortality rate remained stable, and in Sichuan it fluctuated around the national level, but was higher than that of Henan for all years.
The case—fatality rate in Sichuan was higher than that in Henan for the period 2001—2003.
Comparison of infectious diseases reporting data — time distribution
December, November, October, and February had the least new cases of pulmonary tuberculosis in Henan and at the national level (data not presented), while the months with the least average new cases in Sichuan were December, November, October, and September (Table 1).
Comparison of infectious diseases reporting data — age distribution
According to the CISDCP reporting data for 2002, the age groups of 30—34 (national) and 25—29, 30—34, 35—39 (Sichuan) reached the proportion of 10% and above. The age groups 20—24, 25—29, 35—39 (national), 20—24 (Sichuan), and 20—24, 30—34, 35—39, 50—54 (Henan) had a proportion between 8% and 10%. At the national level and in Sichuan and Henan provinces, the age groups 0—4, 5—9, 10—14, 75—79, and 80— were the same, with proportions of less than 4% (Figure 6). It was found that
Figure 5 Regions of high incidence rate for pulmonary tuberculosis in Sichuan Province, 2000—2006. Colors 0 to 7 indicate how many years the county had higher incidence rates than the provincial average level between 2000 and 2006. For example, color 7 means that the county had a higher incidence rate every year throughout the seven years, color 6 means that the county had a higher rate in 6 years during this period, and color 0 means that the county never had an incidence rate higher than the average level between 2000 and 2006. Letters a—u represent the 21 regions in Sichuan Province; these are: a, Ganzi Tibetan Nationality Autonomous Region; b, Aba Tibetan and Qiang Nationality Autonomous Region; c, Mianyang; d, Guangyuan; e, Bazhong; f, Dazhou; g, Guangan; h, Nanchong; i, Suining; j, Deyang; k, Chengdu; l, Ziyang; m, Neijiang; n, Meishan; o, Yaan; p, Leshan; q, Zigong; r, Luzhou; s, Yibin; t, Liangshan; u, Panzhihua.
Figure 6 Age distribution of pulmonary tuberculosis new cases in 2002: China, Sichuan, and Henan.
Table 1 Pulmonary tuberculosis–—new cases and number of deaths by month in Sichuan Province, 2000—2006
Month New cases Deaths
January 7569 9 February 5132 7 March 6068 10 April 6004 10 May 5707 9 June 5567 11 July 5387 10 August 5371 14 September 4859 7 October 4792 7 November 4178 9 December 3017 4 Median 5379 9
Sichuan had more cases in the young and the middle-aged compared to Henan.
Comparison of infectious diseases reporting data — gender distribution
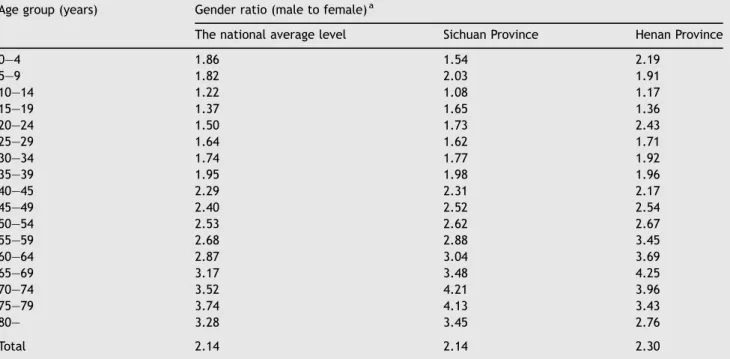
The 2002 reporting data showed that, taking the denomi-nator female as 1, the gender ratios (male to female) of new cases were 2.14, 2.14, and 2.30 at the national level and for Sichuan Province and Henan Province, respectively. Males were more involved than females in all age groups, and the gender difference was obvious (Table 3).
Comparison of cross-sectional surveys7—9
Four large-scale cross-sectional surveys were ever carried out in 1979, 1985, 1990, and 2000 in China. Our study used the 1979, 1990, and 2000 data as representative of the changes over every ten-year period (Figure 7).
The prevalence of active pulmonary tuberculosis and sputum smear-positive pulmonary tuberculosis decreased gradually from 1979 to 2000 in Guangdong and the same trend was seen at the national level, whereas it increased from 1979 to 1990 in Sichuan. After 1990, these same indices were higher in Sichuan than those in Guangdong and at the national level.
Sichuan Province is located in the southwest of China, while Guangdong is located in the southeast; the results of
Table 3 Gender ratio of pulmonary tuberculosis new cases by age group in Sichuan and Henan provinces, 2002 Age group (years) Gender ratio (male to female)a
The national average level Sichuan Province Henan Province
0—4 1.86 1.54 2.19 5—9 1.82 2.03 1.91 10—14 1.22 1.08 1.17 15—19 1.37 1.65 1.36 20—24 1.50 1.73 2.43 25—29 1.64 1.62 1.71 30—34 1.74 1.77 1.92 35—39 1.95 1.98 1.96 40—45 2.29 2.31 2.17 45—49 2.40 2.52 2.54 50—54 2.53 2.62 2.67 55—59 2.68 2.88 3.45 60—64 2.87 3.04 3.69 65—69 3.17 3.48 4.25 70—74 3.52 4.21 3.96 75—79 3.74 4.13 3.43 80— 3.28 3.45 2.76 Total 2.14 2.14 2.30
aTaking the denominator female as 1, e.g. 1.86 represents a gender ratio (male to female) of 1.86:1.
Table 2 Comparison of pulmonary tuberculosis reporting data: national level and Sichuan and Henan provinces Regions Incidence rate (/100 000) Mortality rate (/100 000) Case—fatality rate (%)
2001 2002 2003 2001 2002 2003 2001 2002 2003
National 45.00 43.58 52.36 0.08 0.08 0.08 0.07 0.08 0.15
Sichuan 55.42 54.44 61.14 0.04 0.09 0.07 0.08 0.16 0.11
Henan 31.12 38.32 47.72 0.01 0.02 0.03 0.02 0.04 0.07
Figure 7 Comparison of cross-sectional surveys: China, Sichuan, and Guangdong. ATB, active pulmonary tuberculosis; SS+, sputum smear-positive pulmonary tuberculosis.
the large-scale cross-sectional surveys reveal a gap between the southwest and the southeast provinces in pulmonary tuberculosis prevention and control.
Comparison between China and other high tuberculosis countries worldwide
According to the WHO report, in the year 2005, the top three countries with the highest tuberculosis caseload were India, China, and Indonesia, respectively.1 The incidence rate, incidence rate of sputum smear-positive cases, prevalence, mortality rate, prevalence of human immunodeficiency virus (HIV) in new adult tuberculosis cases, and multidrug-resis-tance rates in new tuberculosis cases and in previously treated tuberculosis cases are compared inTable 4.
China had the highest multidrug-resistance rates in both new tuberculosis cases and previously treated tuberculosis cases. Multidrug-resistance was the main problem in pulmon-ary tuberculosis prevention and control in China, and is also a major difficulty for global tuberculosis control. This indicates that China could be an important base to research multidrug-resistant tuberculosis.
The main problems in India were high prevalence and tuberculosis co-infected with HIV. In Indonesia, the incidence and mortality rates were relatively high.
Discussion
The CISDCP, which covers all the population in China, has been developed over nearly 20 years of practice. To a great extent, the accuracy and timeliness of the data can be relied upon. The results of data analysis revealed the following features of pulmonary tuberculosis in Sichuan Province, 2000—2006.
Rising trends were seen both in the incidence and the mortality rate in recent years, especially after 2003. To determine if this is related to increasing anti-tuberculosis drug resistance requires further research.
Compared to the years 2000—2002, large increases were observed in the incidence of pulmonary tuberculosis in the population aged 15 years and above, especially those aged 20—24, 40—44, 65—69, and 70—74 from 2003 to 2006, bring-ing challenges to its control.
Peasants constituted more than one half of new cases and deaths, which corresponds to the results of a study at the national level.9This is explained, on the one hand, by the
fact that Sichuan is a province predominantly dependent on
agriculture and 78% of its population lives in rural areas.10On the other hand, the gap between peasants and urban citizens in terms of economic status, living conditions, availability of healthcare, education, and awareness of the importance of healthcare might contribute to this significant difference.11 With regards to spatial distribution, the high incidence counties were clustered in the north and west mountainous regions of Sichuan, where the minority groups of Tibetan and Qiang Nationality live. In these areas, economic development falls far behind that of the provincial average level. Is the onset of pulmonary tuberculosis related to geomorphy, char-acteristics of the minority ethnic groups, genetic predisposi-tion, economic development, or cultural differences? Further studies are needed to answer these questions.
According to the data from the National Bureau of Sta-tistics of China,12 the four highest populated provinces in China are Henan, Shandong, Guangdong, and Sichuan. Henan ranked first in terms of new pulmonary tuberculosis cases in 2005, which relates to its large population. However, the incidence, mortality, and case—fatality rates were actually higher in Sichuan than those in Henan.
Sichuan’s economic development falls behind that of the eastern provinces in China, and the proportions of pulmonary tuberculosis in the 25—39-year-old labor force in Sichuan were higher than the national level and those in Henan, which aggravates the vicious circle of illness resulting in poverty, poverty hampering economic development, and economic maldevelopment affecting disease prevention and control.
Male cases were greater than female ones in the Chinese population, which is consistent with other populations in low-income countries,13and also in accordance with other
stu-dies.14,15 The reasons for these differences vary and have included the following factors: smoking (according to the results of the national survey among Chinese people, the prevalence of smoking among males is 66.9% and among females, 4.2%),4biological and epidemiological
characteris-tics,14,15alcoholism, drug abuse and males being more likely to become infected,16 and socioeconomic/cultural barriers
in access to healthcare.17
The results of cross-sectional surveys showed that the prevalences of active pulmonary tuberculosis and sputum smear-positive pulmonary tuberculosis in Sichuan were sig-nificantly higher than those at the national level and in Guangdong. The study of Wang et al.18 demonstrated that the prevalence of active pulmonary tuberculosis increased from the east to the west in China. The prevalence in the eastern region was lower than that of the national level, while the prevalences in the middle and western regions
Table 4 Tuberculosis burden in China, India, and Indonesia, 2005
Tuberculosis burden India China Indonesia
Incidence (all cases/100 000 population/year) 168 100 239
Incidence (smear-positive/100 000 population/year) 75 45 108
Prevalence (all cases/100 000 population) 299 208 262
Mortality (deaths/100 000 population/year) 29 16 41
Prevalence of HIV in new adult TB cases (15—49 years, %) 5.2 0.5 0.8
New TB cases multidrug-resistant (%) 2.5 5.3 1.6
Previously treated TB cases multidrug-resistant (%) 15 27 14
TB, tuberculosis. Source: Global tuberculosis control: surveillance, planning, financing. WHO report 2007 (WHO/HTM/TB/2007.376). Geneva: World Health Organization.1
were higher than those of the national level, which is con-sistent with the results of our study. It demonstrates that tuberculosis prevention and control in Sichuan, especially for active pulmonary tuberculosis and sputum smear-positive pulmonary tuberculosis, should be prioritized in the Chinese tuberculosis control strategy.
The comparison among countries showed that the multi-drug-resistance rates in both new and previously treated tuberculosis cases in China were higher than those in India, which has the heaviest tuberculosis caseload in the world. This is consistent with other studies showing the problem of multidrug-resistant tuberculosis in China.19,20It is estimated that there are approximately 300 000 to 600 000 new multi-drug-resistant tuberculosis cases with an actual number of one million patients every year in the world. The WHO estimates that the multidrug-resistant tuberculosis patients in China account for about one forth to one third of the total in the world,21indicating that China should be the focus of global tuberculosis control. Data from the Sichuan survey showed that the multidrug-resistant tuberculosis rate was 28.3% in patients whose sputum was tested, and among those resistant to at least one anti-tuberculosis drug, the propor-tion of multidrug-resistant tuberculosis patients was 74% (Tuberculosis Control Project Office of Sichuan Province: Compilation of material on tuberculosis control in Sichuan Province, 1991 to 2002). There was a significant increase in the prevalence of multidrug-resistant tuberculosis from 1985 to 2000 in Sichuan Province.22The prevalence of multidrug-resistant tuberculosis was higher in Sichuan (28%) than the average level of 49 countries (20%),23,24and also higher than those in China and Guangdong, Shandong, Henan, and Zhe-jiang provinces (10.7%, 2.8%, 2.9%, 10.8%, and 4.5%, respec-tively).9,25This implies that Sichuan should be a priority for
multidrug-resistant tuberculosis control in China. A study conducted in a specialty hospital for pulmonary tuberculosis in Sichuan Province26 showed that intermittent treatment
was the main characteristic in multidrug-resistant tubercu-losis patients (52.2%), followed by non-rational therapeutic regimens (18.9%), initial resistance (14.4%), incomplete treatment course (13.3%), and drug withdrawal due to adverse events (hepatic toxicity) (1%). The causes of drug resistance identified in other hospital-based studies in China may be summarized into three categories: doctor-, patient-, and drug-related factors. Studies suggest that multidrug-resistant tuberculosis is one of the factors contributing to tuberculosis recrudescence.14,27—30It has always been diffi-cult and expensive to treat multidrug-resistant tuberculosis, which gives developing countries a double challenge. Great efforts should be made to solve the problem of multidrug-resistant tuberculosis, so as to reverse the rising trend of tuberculosis in Sichuan Province.
Our study revealed the epidemiological features of pul-monary tuberculosis in Sichuan Province. Accordingly, the pulmonary tuberculosis prevention and treatment practice in Sichuan should emphasize the following points, to contribute to global tuberculosis control:
1. Strengthen further the governments’ responsibility in combating this disease.
2. Policy and finance be targeted towards the poverty-stricken population (such as residents in the north and west mountainous regions), and those infectious
pulmon-ary tuberculosis cases who cannot afford the treatment expenses be treated free of charge.
3. Implement substantively centralized management by specified departments for pulmonary tuberculosis patients.
4. Speed up the information feedback in the disease pre-vention and treatment system.
5. Improve high-risk population monitoring (such as pea-sants), new cases notification, patient management, and contact tracing through better cooperation between hospitals and centers for disease control and prevention. 6. Train the medical staff and educate the community
people.
7. Research tuberculosis chemotherapy and vaccine devel-opment, as well as early detection of drug-resistant isolates in an attempt to combat this disease.
In conclusion, Sichuan should be the most important province in China with regard to tuberculosis prevention and control, especially for male peasants from the north and west regions and the active pulmonary tuberculosis and sputum smear-positive cases. The major challenge is multi-drug-resistant tuberculosis.
Acknowledgements
Prof. Jian-lin Wu, assistant director of Sichuan Provincial Center for Disease Control and Prevention, Dr Qiao-lan Liu, teaching assistant of the Health Statistics Department of Sichuan University, and Mrs Yuan Yuan, editor of the Chinese Journal of Evidence-Based Medicine, are sincerely thanked for their valuable advice. We also thank all the members in CISDCP for their hard work.
Conflict of interest:No conflict of interest to declare.
References
1. Global tuberculosis control: surveillance, planning, financing. WHO Report 2007 (WHO/HTM/TB/2007.376). Geneva: World Health Organization; 2007.
2. Sichuan Statistical Bureau.Sichuan statistical yearbook 2006. Sichuan, China: China Statistical Press; 2006. p. 69.
3. Guidelines for pulmonary tuberculosis diagnosis and treatment. Chinese Medical Association.China J Tuberc Respir Dis2001;24: 70—4.
4. Sheng Z, Chen Z, He T, Chen Y, Li Y. Comparison of the epidemic feature of tuberculosis between Henan Province and the nation, 2002.Henan J Prev Med2004;15:345—6.
5. Zhang G, Zhao D. Analysis of prevalent features of tuberculosis and the influential factors in Henan Province in 2003.China Trop Med2004;4:743—4. 741.
6. Sheng Z, Chen Z, He T, Chen Y, Li Y. Analysis of epidemiological features of pulmonary tuberculosis in Henan Province, 2003.
China J Epidemiol2004;25:465.
7. Chen Q, Zhong Q, Huang G, Li J. Analysis on the epidemic situation of tuberculosis in Guangdong Province.J Chinese Anti-tuberc Assoc2003;25:156—9.
8. Wu J, Xiong G, Feng S, Cao H, Rao Z, Jiang T,et al.Study on epidemic trend and control policy of tuberculosis in Sichuan Province.China J Tuberc Respir Dis2002;25:12—4.
9. National Technical Steering Group of the Epidemiological Sam-pling Survey for Tuberculosis. Report on nationwide random survey for the epidemiology of tuberculosis in 2000. J Chinese Antituberc Assoc 2002;24:65—108.
10. Sichuan Statistical Bureau. Sichuan statistical yearbook 2005. Available at: http://www.sc.stats.gov.cn/stats_sc/nj/nj.asp (accessed April 2008).
11. Yang J. Comment on the utility of Sichuan labour resources.
Sichuan Provincial Conditions2003;2:10—3.
12. National Bureau, of Statistics of China. Available at:http:// www.stats.gov.cn/tjgb/rkpcgb/qgrkpcgb/
t20020331_15435.htm(accessed April 2008).
13. World Health Organization.Global tuberculosis control: surveil-lance, planning, financing. WHO report 2004. Geneva: WHO; 2004. 14. Martinez AN, Rhee JT, Small PM, Behr MA. Sex differences in the epidemiology of tuberculosis in San Francisco.Int J Tuberc Lung Dis2000;4:26—31.
15. Borgdorff MW, Nagelkerke NJ, Dye C, Nunn P. Gender and tuberculosis: a comparison of prevalence surveys with notifica-tion data to explore sex differences in case detecnotifica-tion. Int J Tuberc Lung Dis2000;4:123—32.
16. Heldal E, Dahle UR, Sandven P, Caugant DA, Brattaas N, Waaler HT,et al.Risk factors for recent transmission ofMycobacterium tuberculosis.Eur Respir J2003;22:637—42.
17. Uplekar M, Rangan S, Ogden J.Gender and tuberculosis control: towards a strategy for research and action (WHO/CDS/TB/ 2000.280). Geneva: World Health Organization; 1999. 18. Wang Y, Gong Y, Liu J, Jiang S, Liu X. Comparative analysis on the
prevalence of active pulmonary tuberculosis in the eastern, mid and western China.Chin J Nat Med2003;5:76—7.
19. Zignol M, Hosseini MS, Wright A, Lambregts-van Weezenbeek C, Nunn P, Watt CJ,et al.Global incidence of multidrug-resistant tuberculosis.J Infect Dis2006;194:479—85.
20. World Health Organization.Anti-tuberculosis drug resistance in the world. WHO third global report. Geneva: WHO; 2004. 21. Ministry of Health of the People’s Republic of China. Steady
progress of the tuberculosis prevention and control work in China. Available at: http://www.moh.gov.cn (accessed April 2008).
22. Liu Y, Duan W, Xiong G, Wu J, Cao H, Xia L,et al.The dynamic change of drug resistance of tuberculosis in Sichuan Province.J Prev Med Inf2002;18:9—10.
23. Report of the meeting of the WHO Global Task Force on XDR-TB, 2006 (WHO/HTM/TB/2007.374). Geneva: WHO; 2007.
24. Centers for Disease Control and Prevention (CDC). Emergence of Mycobacterium tuberculosis with extensive resistance to sec-ond-line drugs–—worldwide, 2000—2004. MMWR Morb Mortal Wkly Rep2006; 55:301—5.
25. Liu J, Jiang S, Cheng S. Analysis of current status of tuberculosis control and its strategy in China.J Chinese Antituberc Assoc
2003;25:129—31.
26. Yi Y. Study on the causes of 90 multidrug-resistant tuberculosis cases.Chengdu Yiyao1998;24:69—70.
27. Wang S, Guo X, Qiu S, Liu F. The new control strategy for the resurgence of tuberculosis.Med Philosophy2004;25:23—4. 28. Liu J. Recrudescence of tuberculosis and its control strategy.
Foreign Medical Sciences Epidemiology Lemology 2004;31: 321—4.
29. Iademarco MF, Castro KG. Epidemiology of tuberculosis.Semin Respir Infect2003;18:225—40.
30. Kremer L, Besra GS. Re-emergence of tuberculosis: strategies and treatment.Exp Opin Investig Drugs2002;11:153—7.