An Investigation into the Effects of
Classroom Acoustics on Teachers’ Voices
Nicholas David Durup
A thesis submitted in partial fulfilment of the requirements of
London South Bank University for the degree of Doctor of Philosophy
December 2017
First Supervisor: Dr S. Dance, London South Bank University
Second Supervisor: Professor Emerita B. Shield, London South Bank University Third Supervisor: Dr R. Sullivan, Sharps Redmore Acoustic Consultants
http://orcid.org/0000-0002-4824-320X
Declaration
This thesis is submitted to London South Bank University in support of my application for the degree of Doctor of Philosophy.
I, Nicholas Durup, declare that the work, research and results presented within this thesis are my own, having been generated by myself as a result of my own original investigation and research and have not been submitted in any previous application for any degree at any institution.
……… Nicholas Durup
Preface
I have always been fascinated with all things related to sound ever since I can remember. This has led me through the playing of musical instruments and Technics 1210s to building loudspeakers and recording, via sound engineering at concerts and conferences and finally into acoustic consultancy and research.
I have been fortunate to meet inspirational people throughout this journey who have fired my imagination and guided me to the next step. I owe a great debt to those who have helped me along this path which has taken me to places, and enabled experiences I never expected in a field which I find endlessly fascinating.
Nick Durup
Acknowledgements
This project would not have been possible without the constant support and understanding of my wife Faith and my family who have been with me solidly through the last seven years.
My parents Janet and Ivan Durup for imparting the importance of knowledge and a lifelong love of learning. My sister Lu Ismail whose teaching experiences provided me with an insight into voice issues for teachers.
My supervisory team:
Professor Emerita Bridget Shield, London South Bank University, for the constant and consistent support, patience and guidance.
Dr Stephen Dance, London South Bank University Dr Rory Sullivan, Sharps Redmore Acoustic Consultants
For reasons of confidentiality it is not possible to thank the schools and teachers by name that have been so instrumental in the success of this project. Without their generous assistance none of this would have been possible – thank you.
All at Sharps Redmore Acoustic Consultants for their sponsorship and support throughout but specifically:
Dr Tim Redmore Jackie Redmore Jeremy Fosker Dawn Cullum Annette Hunter Claire Renvoize John F. Bridges
Kieran Gayler, Sharps Gayler Acoustics Geoff Batty, Anglia Ruskin University Dr Doug Nunn, Anglia Ruskin University John Ward, Anglia Ruskin University
Dr Luis Gomez- Agustina, London South Bank University Richard White, London South Bank University
Professor Joan Curzio, London South Bank University Dr John Sellig, London South Bank University
Dr Bob Peters, Applied Acoustic Design
Dr Emma Greenland, WSP Parsons Brinckerhoff Dr Gizem Otken, WSP Parsons Brinckerhoff Dr Rob Conetta, Sandy Brown Associates Dr Nicky Shiers
Dr Charlotte Clark, Queen Mary University Dr Valdis Jónsdóttir
Dr Stephanie Martin, City University London Roz Comins, Voice Care Network
Sarah Lyons, National Union of Teachers
Richard Fraser, Voice: The union for educational professionals David Brierley, Voice: The union for educational professionals Paul Tiley, Kay Pentax
Shane Cryer, Saint-Gobain Ecophon Colin Campbell, Saint-Gobain Ecophon
Cosimina Drago, London South Bank University Ryan Arbabi, Farrat Isolevel
Paul Herwin, Herwin Acoustics
Dr Ben Dymock, Clarke Saunders Associates Jack Harvie-Clark, Apex Acoustics
Les and Di Rayner
Graeme and Louise McGinty Sally Roach
Roy Hutchinson and Adam Lyons, The Sound Base UK Steve Carter
Glossary
To assist the reader, this section includes details of technical terms, abbreviations and their definitions as used in this thesis.
Term Abbreviation Units Definition
A-weighting dBA - Frequency specific weightings for sound across the frequency range to mirror the ear's response. Absorption
coefficient
α - The ratio of sound absorbed by a material to the sound incident upon its surface, 0 is total reflection, 1 is total absorption. Acoustic
absorption
A m2 Sabine The amount of sound absorption in a room.
Acoustic
absorption mid-frequency
Amf m2 Sabine The amount of sound absorption
in a room in the 500, 1 k and 2 kHz octave bands.
Approved Document E
ADE - The Building Regulations
Resistance to the passage of sound Approved Document E (various versions).
Ambient noise level
- Decibels Noise levels that do not include school activity noise but include traffic, mechanical services and other environmental noise sources.
Ambulatory Phonation Monitor
APM - A portable device worn by a participant which is able to measure parameters of vocal behaviour.
Term Abbreviation Units Definition
Association of Noise Consultants
ANC - UK-based organisation of
companies that are engaged in the business of acoustics, noise and vibration consulting.
Aphonia - - Absence of voice.
Alternative performance standards
APS - Alternative criteria to those in BB93 which can be proposed on a project.
Arithmetic average
- - The arithmetic averaging of noise data as opposed to logarithmic averaging.
A-weighted sound pressure level
dBA Decibels A sound pressure level which has had an A-weighting applied. Background noise
level
L90/LA90 Decibels L90 is the sound pressure level
exceeded 90% of the measurement time. British Association
of Teachers of the Deaf
BATOD - Professional association for teachers of the deaf in the UK.
Building Bulleting 93
BB93 - Explains minimum performance
standards for the acoustics of school buildings. Editions published in 2003 and 2015. Building Research Establishment Environmental Assessment Method
BREEAM - A method of assessing, rating, and certifying the sustainability of buildings used by the Building Research Establishment.
British Standards Institute
BSI - The national standards body of the UK.
Term Abbreviation Units Definition
Building Control Body
BCB - Has the role of checking that building regulations are being complied with. BCBs are either Local Authority or Approved Inspectors.
Chi-square test for independence
X2 - A statistical test used to determine if there is a significant relationship between two categorical variables. Correlation
coefficient
p - A numerical measure of a
statistical relationship between two variables.
Decibel dB Decibels A unit used to measure the intensity of a sound by comparing it with a given reference level using a logarithmic scale. Degrees of
freedom
df - Equivalent to the number of
possible outcomes minus one. Direct field - - The region where the direct sound
from the source is dominant.
Dysphonia - - Voice disorder.
Early decay time EDT Seconds A reverberation time parameter calculated from the initial decay from 0 dB to -10 dB and represents initial reflections from nearby surfaces.
Early decay time mid frequency
EDTmf Seconds EDT values arithmetically averaged
for the 500, 1 k and 2 kHz octave bands.
Term Abbreviation Units Definition
Equivalent
continuous sound pressure level
Leq, T Decibels The equivalent constant sound
pressure level of a time-varying signal that has the same total energy over the same time period. LAeq is the A-weighted value.
Fundamental frequency
SF0 Hertz The voice fundamental frequency
is the lowest frequency in the periodic waveform of the voice's acoustic output.
Hertz Hz Hertz SI unit of frequency, 1 Hz is equal to 1 cycle per second.
Health and Safety Executive
HSE - The body responsible for the encouragement, regulation and enforcement of workplace health, safety and welfare in the UK. Impulse response - - A plot of sound pressure, by time,
as a result of an impulsive
excitation of the room with a Dirac Delta function.
Independent-samples t-test
- - Compares the means of two
independent groups to determine if the population means are significantly different. Indoor ambient
noise level
IANL Decibels The unoccupied, internal, ambient noise level (LAeq) as defined in
BB93. Measured in the absence of school operational noise.
Institute of Acoustics
IoA - The UK's professional body for those working in acoustics, noise and vibration.
Term Abbreviation Units Definition
Independent School Standards Regulations
ISS - Equivalent of SPR for independent schools.
Logarithmic average
Log. av. - Averaging of noise data by
logarithmic rather than arithmetic averaging.
Lombard effect - - An involuntary response whereby the speaker modifies their voice level, SF0, speech speed and
syllable duration to enhance audibility.
Maximum noise level
Lfmax Decibels The maximum sound pressure
level during the measurement period. LAfmax is the corresponding
A-weighted value. Mid frequency
reverberation time
Tmf Seconds Arithmetic average of the RT60
values in the 500, 1 k and 2 kHz octave bands.
Near field - - In the immediate vicinity of a
sound source. Here the sound pressure level may not decrease with distance.
Octave bands - Hertz The audible frequency range is divided into sets of frequencies an octave in width. The upper band frequency is twice the lower band frequency.
Term Abbreviation Units Definition Office for Standards in Education, Children's Services and Skills
Ofsted - Ofsted is responsible for inspecting a range of educational institutions, including state schools and some independent schools.
Phonation - - The production or utterance of
speech sounds. Phonation
percentage
Phonation % % The phonation percentage is the phonation time as a percentage of the measurement period.
Phonation time Tphonation Seconds Phonation time is the length of
time (seconds) for which the vocal folds are producing speech
excluding gaps or pauses. Phoniatrics - - The medical speciality of voice,
speech, language, hearing and swallowing disorders.
Reverberant field - - In this region the sound level is constant and sound is diffused. The level does not change with distance from the source. Reverberation
time
RT60 Seconds The time in seconds for sound in
an enclosed space to reduce by 60 decibels once interrupted, from -5 dB to -65 dB.
Room radius - Metres The distance from a noise source when the direct component and the reverberant component of the sound are equal.
Term Abbreviation Units Definition
Signal-to-noise ratio
SNR Decibels The difference in decibels between wanted sound such as the
teacher's voice, and unwanted sound such as traffic noise. Sound Level Meter SLM - Electronic device for measuring
variations in sound pressure levels. Sound pressure
level
SPL, Lp Decibels A logarithmic measure of the
effective pressure of a sound relative to a reference value of 2 x 10⁻⁵ Pascal (SI unit of pressure). Speech
intelligibility
- - How comprehensible speech is in
given conditions. Speech
Transmission Index
STI - A method of quantifying how a given space will affect
intelligibility. STI has a value between 0 and 1, the higher the value the better the speech intelligibility.
School Premises Regulations
SPR - Prescribes standards for the premises of all Local Authority maintained schools in England. Standard deviation SD - A quantity expressing by how
much the members of a group differ from the mean value for the group.
T20 reverberation
time
T20 Seconds A measurement of reverberation
time over the -5 to -25 dB decay, this is multiplied by a factor of three to give the RT60 value.
Term Abbreviation Units Definition
T30 reverberation
time
T30 Seconds A measurement of reverberation
time over the -5 to -35 dB decay, this is multiplied by a factor of two to give the RT60 value.
Unoccupied ambient noise level
UANL Decibels Unoccupied internal noise level parameters measured in the absence of school operational noise.
Variance - - Variance is a measurement of the
spread between numbers in a data set.
Vocal Fold Distance
VFD Metres Total movement of vocal folds includes SF0 and phonation time.
Vocal loading - - Vocal loading describes additional vocal demands resulting from occupational voice use. Vocal loading
index
VLI - A measure of relative ‘work’ done by the voice system incorporating phonation time and SF0.
Voice level LpZ, 1 m Decibels Voice level given as a linear sound
pressure level at 1 m from the mouth.
World Health Organisation
WHO - A specialised agency of the United Nations that is concerned with international public health.
Table of Contents
Abstract ... 1
Chapter 1 Introduction and research objectives ... 2
Chapter 2 The teacher’s voice ... 4
2.1 The human voice ... 4
2.2 Voice parameters ... 6
2.2.1 Speech fundamental frequency (SF0) ... 6
2.2.2 Phonation time ... 7
2.2.3 Vocal loading ... 9
2.2.4 Voice dose parameters ... 9
2.3 Voice levels of adults and children... 10
2.4 Signal to noise ratio ... 14
2.5 Conclusions... 15
Chapter 3 Teachers’ voice problems ... 16
3.1 Voice problems ... 16
3.1.1 Defining voice problems ... 16
3.1.2 Causes of voice problems ... 17
3.2 Teacher demographics ... 17
3.3 Voice problems among teachers ... 18
3.3.1 Prevalence of voice problems in teachers ... 18
3.3.2 Voice clinic attendance ... 18
3.3.3 Questionnaires ... 19
3.3.4 Phoniatric examination ... 20
3.3.5 Prevalence summary ... 21
3.4 Impact of teachers’ voice problems ... 21
3.4.1 Effects on pupil learning ... 22
3.4.2 Economic and societal costs ... 22
3.4.3 Personal costs ... 22
3.5 Risk factors ... 24
3.5.1 Pupil age group ... 24
3.5.2 Subject taught ... 25
3.5.3 Socio-economic factors... 25
3.5.4 Teacher age ... 26
3.5.6 Stress ... 28
3.5.7 Voice related effects of stress ... 29
3.6 Voice training and management ... 29
3.6.1 Types of voice training and management ... 30
3.6.2 Vocal hygiene ... 30
3.6.3 Prevalence of voice training ... 31
3.6.4 Influence of voice training on voice problem prevalence ... 31
3.7 Conclusions... 31
Chapter 4 Classroom acoustics... 33
4.1 Room acoustic parameters ... 33
4.1.1 Reverberation time ... 33
4.1.2 Early decay time ... 35
4.1.3 Speech transmission index (STI) ... 35
4.2 Noise levels ... 36
4.2.1 Hearing ... 36
4.2.2 The measurement of sound in decibels ... 37
4.2.3 Noise measurement parameters ... 37
4.3 Noise levels in classrooms ... 39
4.3.1 Unoccupied classroom noise levels ... 39
4.3.2 Occupied classroom noise levels ... 39
4.3.3 Signal to noise ratios (SNR) in classrooms ... 40
4.4 Speech intelligibility in classrooms ... 41
4.4.1 Reverberation times in classrooms ... 41
4.4.2 Interaction of reverberation time and noise ... 42
4.4.3 Influence of reverberation time on speech intelligibility ... 42
4.5 Conclusions... 43
Chapter 5 Current guidance and legislation ... 44
5.1 Health and safety legislation ... 44
5.1.1 Directive 89/391/EEC ... 44
5.1.2 Health and Safety at Work etc. Act ... 45
5.1.3 The Management of Health and Safety at Work Regulations 1999 ... 45
5.1.4 BSI and HSE guidance... 46
5.1.5 Summary ... 47
5.2 Building Regulations ... 48
5.3 School Premises Regulations ... 50
5.4 Building Bulletin 93 ... 50
5.4.1 BB93:2003 ... 50
5.4.2 BB93 2015 revision ... 52
5.4.3 Alternative performance standards (APS) ... 55
5.5 Other recommendations ... 56
5.5.1 BREEAM ... 56
5.5.2 BS 8233 ... 56
5.5.3 BS EN 614-1:2006 ... 57
5.5.4 The World Health Organisation ... 57
5.5.5 The Essex Study... 58
5.6 Conclusions... 59
Chapter 6 The effect of classroom acoustics on the teacher’s voice ... 60
6.1 Lombard effect ... 60
6.2 Influence of different noise types on voice parameters ... 61
6.3 Influence of reverberation time on voice parameters... 62
6.4 Conclusions... 63
Chapter 7 Measurement of the teacher’s voice: choice of instrumentation and pilot study ... 64
7.1 Introduction... 64
7.2 Requirements of the measurement approach ... 64
7.3 Voice measurement methods – microphone and statistical ... 65
7.4 Voice measurement methods - ambulatory phonation monitors (APMs) .. 66
7.5 Choice of APM ... 67
7.5.1 Sonvox VoxLog ... 67
7.5.2 KayPENTAX APM 3200 ... 68
7.6 Accuracy of the APM ... 69
7.7 Dynamic range of APM ... 71
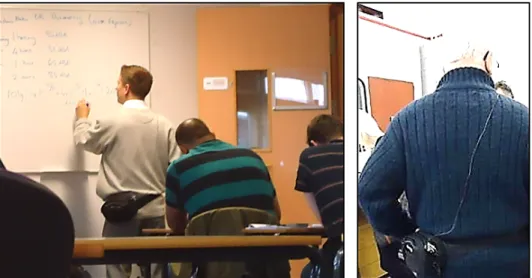
7.8 Accelerometer attachment and placement ... 71
7.9 APM calibration procedure ... 73
7.10 APM measurement and data retrieval ... 76
7.11 APM software data analysis ... 77
7.12 Initial pilot measurements ... 79
Chapter 8 Acoustic measurements of classrooms: equipment and methodology .... 81
8.1 Introduction... 81
8.2 Unoccupied classrooms... 81
8.2.1 Unoccupied ambient noise levels (UANLs) ... 81
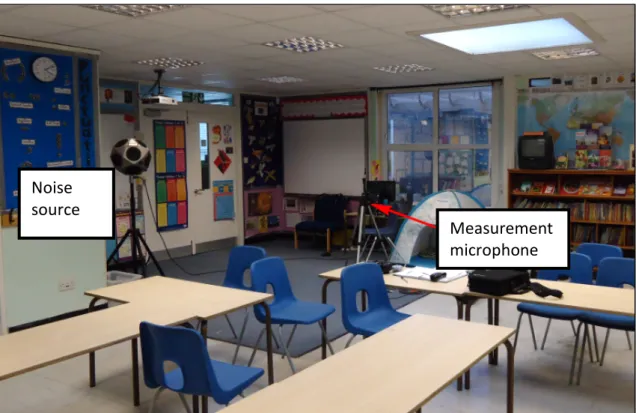
8.2.2 Room acoustics ... 82
8.3 Occupied classrooms ... 84
8.4 Conclusions... 86
Chapter 9 Voice and acoustic surveys... 87
9.1 Introduction... 87
9.2 Ethical approval ... 87
9.3 Recruitment of schools and teachers... 88
9.4 Preliminary information ... 89
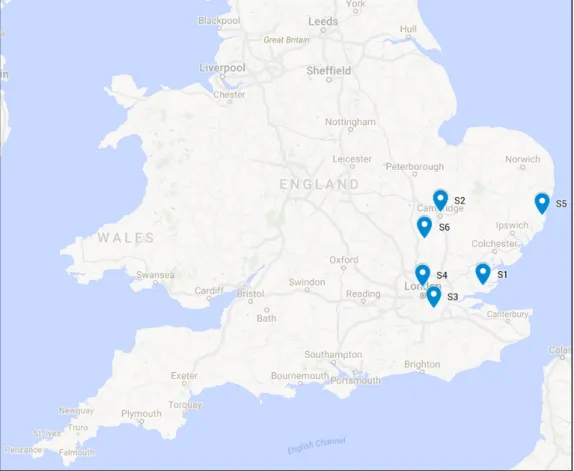
9.5 Details of participating schools ... 89
9.6 Classroom information ... 91
9.6.1 Physical properties of classrooms ... 94
9.7 Participating teacher information ... 94
9.7.1 General... 95
9.7.2 Gender of participants ... 96
9.7.3 Age of participants ... 96
9.7.4 Teaching experience of participants ... 96
9.7.5 Voice training of participants ... 97
9.7.6 Participant questionnaires ... 97
9.8 Conclusions ... 98
Chapter 10 Acoustic survey results ... 99
10.1 Introduction ... 99
10.2 Classroom acoustics data ... 99
10.3 Unoccupied classroom noise levels ... 100
10.4 Reverberation times ... 103
10.5 Compliance with current standards ... 106
10.6 Occupied classroom noise levels ... 107
10.7 Low frequency noise ... 110
10.8 Conclusions ... 111
Chapter 11 Voice measurements: results and analysis ... 112
11.1 Introduction ... 112
11.3 Voice levels ... 113
11.4 Fundamental frequency (SF0) ... 121
11.5 Phonation time and percentage ... 123
11.6 Vocal loading indices ... 128
11.7 Further analysis of voice data ... 130
11.7.1 Voice level and gender ... 130
11.7.2 Voice level and school type ... 131
11.7.3 Voice level and voice training ... 132
11.7.4 Phonation percentage, phonation time and gender ... 132
11.7.5 Phonation percentage, phonation time and school type ... 133
11.7.6 Phonation percentage, phonation time and voice training ... 134
11.7.7 SF0 and gender ... 135
11.7.8 SF0 and school type ... 136
11.7.9 SF0 and training ... 136
11.7.10 Vocal loading indices and gender ... 137
11.7.11 Vocal loading indices and school type ... 138
11.7.12 Vocal loading indices and training ... 139
11.8 Summary of analysis... 140
11.9 Conclusions... 141
Chapter 12 Relationships between voice and acoustic data ... 143
12.1 Introduction ... 143
12.2 Comparison of voice parameters and unoccupied noise levels ... 144
12.2.1 Voice level ... 144
12.2.2 Phonation percentage and time ... 150
12.2.3 Vocal loading indices... 150
12.2.4 SF0 ... 151
12.2.5 Participant questionnaires ... 151
12.3 Comparison of voice parameters and occupied noise levels ... 151
12.3.1 Voice level ... 151
12.3.2 Phonation percentage and time ... 154
12.3.3 Vocal Loading Index ... 154
12.3.4 SF0 ... 155
12.4 Comparison of voice parameters and room acoustic data ... 155
12.4.1 Voice level ... 155
12.4.2 Phonation percentage and time ... 155
12.4.4 SF0 ... 156
12.5 Summary ... 156
12.6 Conclusion ... 157
Chapter 13 Design of online survey and pilot survey ... 158
13.1 Introduction ... 158
13.2 Design of survey ... 158
13.3 Pilot survey distribution ... 160
13.4 Results of pilot survey ... 161
13.4.1 Profile of respondents ... 161
13.4.2 Classroom information ... 162
13.4.3 Classroom acoustics ... 162
13.4.4 Voice use and problems ... 163
13.4.5 Hearing loss and tinnitus ... 164
13.4.6 General health ... 164
13.5 Conclusions... 164
Chapter 14 Results of online survey ... 166
14.1 Distribution of survey ... 166 14.2 Survey respondents ... 166 14.3 Survey results ... 167 14.4 Personal information ... 168 14.4.1 Gender (Q1) ... 168 14.4.2 Age (Q2) ... 168
14.4.3 English as first language (Q3) ... 170
14.4.4 Teaching status (Q4) ... 170
14.4.5 Length of teaching career (Q5) ... 171
14.4.6 Location (Q6) ... 172
14.4.7 Type of teaching (Q7) ... 172
14.4.8 Subject taught (Q8) ... 173
14.4.9 Private or state sector (Q9, Q10) ... 174
14.5 Classroom details ... 174
14.5.1 Classroom layout (Q11) ... 174
14.5.2 Period of classroom construction (Q12) ... 175
14.5.3 Open plan spaces (Q13, Q13A) ... 176
14.5.4 Class size (Q14) ... 177
14.6 Voice problems ... 179
14.6.1 Experience of voice problems (Q16-Q17) ... 179
14.6.2 Help with voice problems (Q18, 19, 20) ... 181
14.6.3 Variations in voice problems (Q21) ... 182
14.6.4 Time off work due to voice and other health reasons (Q22, 23) ... 183
14.6.5 Voice tiredness (Q25) ... 185
14.6.6 Voice training (Q26, 26a, 27) ... 185
14.6.7 Voice training (Q28) ... 187
14.7 Classroom acoustics ... 189
14.7.1 Problems being heard (Q29) ... 189
14.7.2 Acceptability ratings of different noise sources in classrooms (Q32) ... 191
14.7.3 Effect of teaching rooms on voice sound (Q33) ... 193
14.7.4 Strategies for being heard (Q34) ... 193
14.7.5 Voice use (Q35) ... 194
14.8 Implications of voice problems ... 195
14.8.1 Significance of voice problems for teachers (Q36) ... 195
14.8.2 Retirement or career change related to voice problems (Q37) ... 196
14.8.3 Voice amplification systems (Q39, 40, 41) ... 196
14.9 Hearing and other health issues ... 198
14.9.1 Hearing loss (Q42-45) ... 198
14.9.2 Tinnitus (Q46-48) ... 200
14.9.3 General health (Q49-57) ... 202
14.10 Conclusions... 207
Chapter 15 Further analysis of online survey results ... 210
15.1 Voice problems ... 210
15.1.1 Voice problems and gender ... 211
15.1.2 Voice problems and respondent age ... 211
15.1.3 Voice problems, respondent age and gender ... 211
15.1.4 Voice problems and years teaching ... 212
15.1.5 Voice problems and school type ... 213
15.1.6 Voice problems and open plan classrooms ... 214
15.1.7 Voice problems and difficulty being heard in classrooms ... 215
15.1.8 Voice problems and classrooms too reverberant ... 215
15.1.9 Voice problems and classrooms too noisy ... 216
15.1.11 Voice problems with ceiling and floor finishes ... 217
15.1.12 Voice problems and health rating ... 218
15.1.13 Other parameters ... 218
15.2 Voice training ... 219
15.2.1 Voice training by gender ... 219
15.2.2 Voice training by age ... 219
15.2.3 Voice training and years teaching ... 220
15.2.4 Voice training and voice problems ... 220
15.3 Classrooms reported as too reverberant ... 221
15.3.1 Classrooms too reverberant and ceiling finish ... 221
15.3.2 Classrooms too reverberant and high pupil noise ... 222
15.4 Difficulty being heard ... 222
15.4.1 Difficulty being heard and classroom construction era ... 222
15.4.2 Difficulty being heard and ceiling finish ... 223
15.5 Conclusions... 224
Chapter 16 Conclusions and further work ... 226
16.1 Introduction ... 226
16.2 Voice and acoustic measurements ... 226
16.3 Online survey ... 228
16.4 Limitations of the research ... 229
16.5 Further work ... 230
16.6 Overall conclusions and implications for acoustic design of schools ... 232
References ... 233234 APPENDIX A - Template health and safety checklists and risk assessments ... 252
APPENDIX B - Ethical approval documentation ... 257
APPENDIX C - Invitation letter, participant information sheet and consent forms ... 259
APPENDIX D - Classroom floorplans and photographs ... 267
APPENDIX E - Participant questionnaire for voice measurements ... 276
APPENDIX F - Unoccupied classroom acoustic data ... 283
APPENDIX G - Occupied classroom acoustic data ... 289
APPENDIX H - Online survey for teachers ... 296
APPENDIX I - Journal and conference papers... 319
APPENDIX J - APM software images ……….. 322
Abstract
The acoustic design of classrooms has traditionally focused on pupils hearing the teacher. There is a need for guidance on the consideration of voice ergonomics for teachers in classroom design.
This project undertook measurements of teachers’ voices in classrooms with different acoustic properties to examine possible relationships between voice parameters and classroom acoustics. The mean voice level measured was classified as ‘loud’ (based on guidance values) and the participants spoke for a large proportion of the day (average 21%).
Those teaching in rooms with higher unoccupied noise levels spoke with a higher sound level. There was a significant, moderate, positive correlation between voice levels in female participants and the unoccupied noise levels in the same region of the noise spectrum as the fundamental frequency of the female voice. There were signs of a similar relationship for male participants. This indicated that the control of low frequency noise levels and reverberation times (not currently covered by schools guidance documents in England) may be important in reducing voice levels and the associated vocal risks.
An online survey was also undertaken which gathered 153 responses and included questions on voice problems, voice training, classroom acoustics and general health. The respondents reported a number of interesting findings. 66% reported having experienced voice problems, with many continuing to work despite these problems. A relatively small proportion of respondents had received voice training (41%), and many reported shouting or raising their voice.
There were greater rates of reported voice problems in teachers of young children and those teaching in open plan classrooms. Subjectively the main acoustic issues for teachers were inadequate internal sound insulation and excessive reverberation. External noise intrusion was not reported as significant.
Chapter 1 Introduction and research objectives
The voice is an essential communication tool and an intrinsic part of an individual’s personality and identity. With the change in occupations away from mass industrial and manual employment in post-industrial economies, a greater proportion of the population now depend on their voice as an essential part of their professional lives. Teaching is one such occupation with a heavy reliance on the voice. There are indications that teaching may carry a significant risk of developing voice problems. The size of the teaching population means that such problems have the potential to affect large numbers of people.
The acoustic design of classrooms has predominantly been driven by the aim of ensuring that pupils can hear the teacher clearly. The voice ergonomics of the teacher would not normally be considered.
This project has been born out of the need for guidance for those involved with the acoustic design in schools in terms of whether classroom acoustics play a role in how the teacher’s voice is used, and how the voice ergonomics of teachers can be considered in practical terms.
This thesis aims to examine the relationship between classroom acoustic conditions and voice parameters in teachers as well as exploring teachers’ subjective impressions of voice problems and classroom acoustics.
The thesis has two main strands:
1) Measurements of the voice parameters of teachers speaking in various classroom types with different acoustic conditions, the aim being to understand whether classroom acoustics have a relationship with teachers’ voice parameters and hence with potential voice problems.
2) An online questionnaire for teachers to gather subjective data on their experiences of voice problems, voice training and classroom acoustics in general. The motivation for this is to gain insight into the subjective impressions teachers have of the rooms they teach in, and to examine their experiences of voice problems in more detail.
The thesis begins with a brief explanation of how the human voice operates and describes the common voice parameters.
There then follows a review of voice problems in general, their prevalence among teachers, the impacts of such problems, the associated risk factors and voice training. This is then followed by a chapter covering classroom acoustics and a further chapter on current acoustic guidance and legislation. In the final background chapter, the current literature on the effects of classroom acoustics on the teacher’s voice is summarised.
The methodology developed for measuring the teacher’s voice is then detailed, together with the selection of instrumentation and the pilot study. The voice and acoustic surveys carried out are described along with results and analysis of the voice measurements survey.
The second element of the thesis describes the development of the online survey for teachers (including the pilot study), presenting the results and analyses undertaken. The outcomes of the two strands are summarised in the conclusions chapter which also includes details of further work that could be undertaken to develop and extend the research undertaken in this thesis.
The appendices include details of template health and safety checklists and further information on the ethical approval process, as well as copies of the invitation letter, participant information sheet, consent forms and participant questionnaires used in the voice measurements element of this thesis. Data on occupied and unoccupied classroom noise levels is also included as is a copy of the online questionnaire. Details of journal and conference papers which have been published, and presented, in relation to this thesis are included in an additional appendix. The penultimate appendix contains enlarged images from the APM software and the final appendix includes a copy of the presentation given by the author at the viva voce examination.
Chapter 2 The teacher’s voice
The first section of this chapter will provide a brief introduction to the voice and how it operates; the second section will detail the main voice parameters used to quantify the voice.
2.1 The human voice
Speech is a complex pattern of behaviour which involves the conversion of emotions, language and concepts in the brain into sound via the control and articulation of various structures in the body. The physical mechanisms involved are shown schematically in Figure 2.1.
Figure 2.1: Vocal schematic [1]
Sound generation starts with air from the lungs and diaphragm passing through the larynx tube where it is modulated by the vocal folds which are able to close and open within the airflow to effectively vary the resonant qualities of the tube. This is where voice pitch and tone is controlled. Sound is further controlled by the mouth, nose and throat providing articulation for speech. The anatomy of the speech production mechanisms are shown in Figure 2.2.
Figure 2.2: The anatomy of the speech production mechanism [2, fig. 5.2]
The larynx is shown in Figures 2.3 and 2.4 and generates sound by the vocal folds temporarily blocking (termed adduction - see Figure 2.4) and releasing (abduction) the flow of exhaled air. This generates pressure pulses which determine the speech fundamental frequency (SF0) (see section 2.2.1) and contribute to the perceived pitch
of the voice.
Figure 2.4: Vocal folds abducted and adducted [4]
2.2 Voice parameters
The voice can be quantified using a number of parameters which enable objective comparisons between different individuals and groups. These are fundamental to investigating potential relationships between voice behaviour and external factors.
2.2.1 Speech fundamental frequency (SF0)
The natural speaking fundamental frequency SF0 varies by gender and age and has the
potential to be altered by voice use. It is a function of vocal fold dimensions and tension. The mean values of SF0 by age and gender for adults are shown in Table 2.1
[112].
Table 2.1: Mean SF0 in adults by age [77] and overall [6]
Age (years) Mean SF0 Hz Male Female 20-29 120 224 30-39 112 213 40-49 107 221 50-59 118 199 60-69 112 199 Overall [6] 128 225
The significantly higher mean SF0 in women would be expected to result in a greater
vocal load, or vocal dosage, for a given phonation time if all other factors are equal [7]. Research by Jian et al. (1994) indicated that speaking at a higher SF0 increases the
number and force of impacts between the vocal folds with an associated risk of voice fatigue and problems [8]. The SF0 gender difference may be a factor in the apparent
higher prevalence of voice problems in women in general, and in women teachers, as discussed in section 3.5.5.
The mean SF0 typically decreases with age after peaking at age 20-29 meaning that the
youngest teachers (of both genders), with the least workplace voice use experience, would typically have the highest SF0 value, and potentially the highest voice loading if
other risk factors such as phonation time (see section 2.2.2) were equal.
The relative SF0 values for adults and children are important, as for the signal-to-noise
ratio in classrooms, the noise is often the speech signal from pupils. SF0 varies with age
differently for boys and girls as they move through puberty and adolescence. For young children of both genders the SF0 would normally be in the range 250-400 Hz [9].
Girls have the highest mean SF0 at around 7-8 years of age reducing to an adult level
between ages 11-15. Therefore many children would have the same SF0 range as
female teachers with implications for the signal to noise ratio in the frequency domain. This may be a contributing factor to the seemingly greater prevalence of voice problems in teachers of younger children as discussed in section 3.5.1.
2.2.2 Phonation time
Phonation time is the length of time (seconds) for which the vocal folds are producing speech excluding gaps or pauses. The percentage value is the phonation time as a percentage of the measurement period and allows for relative comparisons between speakers.
Teachers necessarily spend a large proportion of their working life speaking for extended periods and this cannot be readily avoided.
A number of studies have looked at typical phonation time percentages for teachers while at work, compared with non-occupational use, as well as with other professions. These are summarised in Table 2.2.
Table 2.2: Phonation time percentages for teachers
Reference Phonation time % Teachers occupational voice use Teachers non-occupational voice use Other professions voice use
Masuda et al. (1993) [10] 21% - Office workers 7%
Titze et al. (2007) [11] 23% 12% -
Sala et al. (2002) [12] 40% - Nurses 28%
Rantala et al. (1994) [13] 25-40% - -
Hunter et al. (2010) [14] 30% 14% -
Based on the data in Table 2.2 teachers have a high phonation time percentage, comparable to that of nurses and around three times that of office workers. The phonation time percentage during teaching is significantly higher than when not working.
It has also been found that among teachers as well as having high phonation times, half of this phonation was at a high voice level of 80 dB LpZ, 0.2 m, or above [10]. This
indicates that high phonation times may modify the natural speaking voice level. A study by Shield et al. (2015)[15] of secondary schools found that plenary sessions with the teacher speaking accounted on average for 46% of lesson time. Although different to the phonation time percentage, this indicates that teachers may speak for almost half of lesson times. For teachers of younger children, the phonation time percentage is likely to be higher than for older children due to the greater amount of oral instruction involved.
It is important to consider that the phonation time factor is not restricted solely to voice use in the workplace. Unlike some other workplace hazards such as manual handling, chemical or noise exposure, voice use is a fundamental part of general life. Therefore how an individual uses their voice outside the workplace will also have a bearing on the overall phonation time and percentage. It is possible for two individuals with similar workplace voice uses to have different leisure voice use resulting in
different overall patterns of phonation and a different voice problem risk profile as a result.
2.2.3 Vocal loading
Vocal loading describes additional demands resulting from occupational voice use and is considered as a significant contributor to voice problems [16]. These demands include a number of different factors which have been identified in the literature [17] and are summarised below:
• Amount of voice use • SF0
• Voice level • Phonation time • Voice quality
Vocal loading does not appear to carry the same risk of developing voice problems for all individuals. Some individuals appear to have a greater pre-disposition to voice problems when under the same vocal loading [18]. Speaking in classrooms with high noise levels has been reported in studies to increase vocal loading [19] and to be a primary risk factor relating to voice problems for teachers [20, 21].
2.2.4 Voice dose parameters
It has been suggested in the literature that vocal loading can be considered analogous to exposure to the sun or chemicals. Such exposures are normally quantified in terms of a dosage and a similar approach has been proposed in the literature for vocal loading.
An index of vocal loading [22] is given by the Vocal Loading Index (VLI) defined by:
1000
0 tPhonation
SF VLI = ×
The study in which the VLI was proposed showed that phonation time, tPhonation, rather than SF0 was the dominant risk factor, with the implication that rest periods and the
planning of teaching timetables could be used to mitigate some of the risks of voice problems. One study [23] found that there was a strong correlation between phonation time (termed ‘time dose’ in the study) and subjective and objective voice problems. Dose parameters have been further developed by other researchers with the proposal of other metrics which are summarised in Table 2.3 [7].
Table 2.3: Voice dose parameters
Parameter Abbreviation Unit Notes
Time dose Dt s Phonation time only
Vocal loading index VLI - Includes SF0 and phonation time
Distance dose Dd m
Total movement of vocal folds includes SF0
and phonation time Energy dissipation dose De J m-3
Energy dissipated over unit volume of vocal folds
Radiated energy dose Dr J Total energy radiated from mouth during phonation
There are currently no definitive safety limits against which the various dose parameters can be assessed. Titze et al. (2003) [24] proposed that the vibration exposure of the vocal folds could be considered analogous to hand-arm vibration dose limits, in which a safe dose limit was approximately 520 m. The pauses in voicing in normal speech are hypothesised by Titze et al. (2003) [24] to aid recovery of the vocal folds and extend the effective safe dose limit. In addition there are significant differences between vocal fold and hand/arm tissues and structures, with the former perhaps being better adapted to cope with vibration compared with the latter, meaning that the dose limits may not be interchangeable and further research and refinement is needed to determine suitable safe limits.
2.3 Voice levels of adults and children
Early studies established nominal voice levels but were often undertaken in low ambient noise levels, which did not represent normal speaking conditions [25, 26, 27]. Subsequently researchers undertook measurements to examine the influence of
ambient noise level on voice levels, such as the Lombard effect [28], however, these were undertaken in laboratory rather than field conditions [29]. Mean sound pressure levels for adults speaking at different voice levels, used in different standards, are summarised in Table 2.4.
Table 2.4: Average voice effort levels for adults
Source Parameter
Voice level at 1 m Relaxed Normal Raised Loud Very
loud Shout Max IoA/ANC Acoustics of
Schools Design Guide [30] dBA - 60 70 - - 80 -
BS ISO 9921-1 1996 and 2003 (male speaker) [31, 32]
dBA 54 60 66 72 78 84 90
ANSI S3.5:1997 [33]
(male & female speakers) dB - 62 68 75 - 82 -
The average voice levels in Table 2.4 do not take account of gender and age differences which are shown in Table 2.5 [34]:
Table 2.5: Mean dBA and dBZ voice effort levels for adults and children in anechoic conditions [34]
Speaker Age Voice level dBA at 1 m (dBZ)
Casual Normal Raised Loud Shouted Female 13-60 50 (54) 55 (58) 63 (65) 71 (72) 82 (82) Male 13-60 52 (56) 58 (61) 65 (68) 76 (77) 89 (89) Young children Under 13 53 (56) 58 (61) 65 (67) 74 (75) 82 (82)
The values in Tables 2.4 and 2.5 are not for teachers specifically, and were measured under laboratory conditions. Teachers may speak in a different manner to conversational speech when teaching and therefore these levels may not be representative.
A study by Pearsons et al. (1977) [34] reported that mean voice levels for teachers in the classroom were 13 dB higher than for non-occupational voice use. There is likely to be variability between individuals when requested to speak at self-determined voice levels. Individuals may identify the voice level they use the majority of the time as a
The values in Table 2.5 indicate that female teachers who teach children under 13 would have dBZ voice levels 2-3 dB below those of their pupils in the ‘casual’, ‘normal’, ‘raised’ and ‘loud’ voice levels. Therefore if, for discipline or instructional reasons, the teacher had to speak over pupils who were also speaking then they may need to raise their voice above the ‘normal’ level. A number of studies that have looked specifically at teachers’ voice levels are summarised in Table 2.6.
Table 2.6: Summary of average voice levels for teachers
School type Gender Average voice level at 1 m dBA Reference
Primary All 72 [35] Primary Female 72 Primary Male 69 Secondary All 65 [36] Secondary All 71 [34] Primary Female 61 (dBZ) [37] Primary Male 55 (dBZ) [37]
The levels in Table 2.6 are all above ‘normal’ based on Table 2.5 and may represent a significant voice problem risk factor. Where data was split by gender, females had higher voice levels than males, which is the opposite of data for the general population (see Table 2.5).
The variation in frequency content is shown in Table 2.7 and Figure 2.5 for different voice levels and speaker groups [34].
Table 2.7: Average voice level LpZ, 1 m dB spectrum for different voice levels and
speakers [34]
Vocal effort Speaker Octave band centre frequency Hz
250 500 1 k 2 k 4 k Casual Men 50 51 43 41 39 Women 49 50 42 39 35 Children 49 52 45 42 38 Normal Men 55 58 51 47 43 Women 51 54 49 44 43 Children 53 56 51 46 44 Raised Men 59 64 59 54 49 Women 55 60 58 54 49 Children 56 61 60 56 52 Loud Men 65 72 71 66 60 Women 58 64 67 64 57 Children 56 64 67 65 58 Shouted Men 70 80 84 80 73 Women 56 70 77 76 69 Children 55 70 76 75 70
Table 2.7 and Figure 2.5 indicate that for ‘casual’, ‘normal’ and ‘raised’ speech, children have higher mean voice levels than female teachers and a similar spectrum shape, creating a potential signal to noise challenge.
In terms of the link to voice problems, studies have indicated that, for speech generated at higher sound pressure levels, the resulting force between the vocal folds is increased, with an associated risk of voice fatigue and problems [8]. This suggests that teachers who raise their voices, for example, to maintain discipline, or to be heard above noise in the classroom, may increase the risk of vocal loading. Other studies have indicated that speaking at levels above ‘normal’ is likely to have adverse physical effects [38].
2.4 Signal to noise ratio
Signal to noise ratio (SNR) is the difference between the wanted sound such as the teacher’s voice, and unwanted sound such as traffic noise. SNR is given as the decibel difference between the two signals and is a good indication of speech intelligibility at the listener position.
The SNR contributes to the audibility and intelligibility of the teacher’s voice for pupils and largely determines how loud the teacher needs to speak to be heard and understood. The interference effect of noise is a function of the SNR, how the SNR varies with time and the relative spectral content of the speech and the noise [39]. BS ISO 9921-1:1996 Ergonomics Assessment of Speech Communication [31] includes guidance on suitable signal to noise ratios shown in Table 2.8.
Table 2.8: Signal to noise ratio at the listener [31]
Signal to noise ratio at listener's position dBA Assessment
<-6 Insufficient -6 to -3 Unsatisfactory -3 to 0 Sufficient 0 to 6 Satisfactory 6 to 12 Good 12 to 18 Very good >18 Excellent
Recommended SNR values given in the literature for classrooms include: • 12 dB [40].
• 15 dB throughout the classroom [41]. • 15-20 dB [42, 43].
• High speech intelligibility 10 dB SNR and appropriate reverberation times [34].
2.5 Conclusions
Having identified the main voice parameters in this section, and typical values for these parameters for both the general and teaching populations, the next chapter will look at the issue of voice problems in teachers in terms of prevalence, costs and risk factors.
Chapter 3 Teachers’ voice problems
This chapter will give further information on voice problems and will review the literature relating to voice problems specifically in teachers, risk factors and voice training.
In this thesis the teachers considered are those teaching in primary (children aged 5-11) and secondary schools (children aged 11-18). This reflects the remit of mandatory acoustic guidance in England (see Chapter 5). The English school system is organised as shown in Table 3.1.
Table 3.1: English state school system[44]
School Key stage School year Typical age range
Primary Reception and KS1 Years R - 2 4 - 7
KS2 Years 3 - 6 7 - 11
Secondary KS3 Years 7 - 9 11 - 14
KS4 (GCSEs) Years 10 - 11 14 - 16
Further KS5 (AS-levels, A-levels, NVQs, HNDs Years 12 - 13 16 - 18
3.1 Voice problems
3.1.1 Defining voice problems
There is no overarching definition of voice problems that is universally accepted. A number of authors have proposed definitions:
Aronson (1985) suggested that ‘A voice disorder exists where the quality, pitch, loudness or flexibility differs from the voices of others of similar age, sex and cultural group’ [45, p. 7].
Moore (1971) considered that ‘When an individual speaks habitually with a voice that differs in pitch, loudness, or quality from the voices of others of the same age and sex within his cultural group, he is considered to have a voice disorder.…It follows that the perceived defectiveness of any one voice will vary among listeners without change in the actual voice. It is apparent that a voice is abnormal for a particular individual when he judges it to be so’ [46, p. 535].
Voice problems do not always have associated physical manifestations. For the purposes of this thesis, voice problems are considered as including conditions (with or without associated physical pathology) which cause sufficient concern or impediment for the individual to identify themselves as having voice problems or to seek treatment.
3.1.2 Causes of voice problems
Individuals from all parts of society suffer from occasional voice problems, such as sore throats or hoarseness. This can cause the subject of occupational voice problems in teachers, or others, to be trivialised, or seen as an unavoidable occupational hazard. In contrast to occasional issues, there are more serious conditions which can cause significant problems for the individuals who suffer from them.
Aphonia (absence of voice) and dysphonia (voice changes) can be caused by a range of functional issues in different body systems and for a variety of reasons including voice misuse, trauma, infections, stress and illness.
3.2 Teacher demographics
Teaching is a large profession globally and the number of people potentially affected could be very large if an enhanced risk of voice problems applies. There are estimated to be 506,000 full time teachers in the UK (604,000 including part time teachers). In England there are around 420,000 teachers based on the most recently available data [47-51].
Teaching assistants would have similar patterns of occupational voice use as teachers. Head teachers and managerial or pastoral staff would be expected to have different patterns of voice use to classroom-based teachers.
In 2014 globally there were an estimated 62.1 million teachers in primary and secondary education [52]. Occupational voice risks for teachers are likely to be universal as the risk factors and voice use patterns would be similar in different countries even with pedagogical variations.
Gender is a factor in voice problems as men and women have physical differences in the voice system; the gender balance of the teaching profession is therefore important. In England 74% of teachers are female (86% of primary and 64% of secondary) [53]. Globally in primary education 62% of teachers are female (83% in developed countries), and 52% in secondary education (59% in developed countries) [54].
The following sections will look at the various risk factors for voice problems.
3.3 Voice problems among teachers
3.3.1 Prevalence of voice problems in teachers
Professionals requiring effective voice use (including actors, lawyers, singers as well as teachers) are potentially at risk of voice problems due to occupational voice use [55]. Anecdotally it is often considered that teachers experience voice problems disproportionately, as a result of their occupational voice use.
There have been a number of studies to determine the prevalence of voice problems among teachers using three primary methods:
1) Voice clinic attendance. 2) Questionnaire surveys.
3) Phoniatric examination of the body systems involved in speech production. Between studies there was considerable variation in how, or if, voice problems were defined. This is a factor when comparing data from different studies. The findings of the studies using different methodologies are summarised in the following sections.
3.3.2 Voice clinic attendance
A number of studies in different countries analysed attendance at voice clinics by occupation. The underlying assumption is that the greater the attendance by a given occupational group, the greater the prevalence in the group as a whole. However, there may also be other possible explanations if a group is over represented.
Investigations of attendees in US and Swedish voice clinics (2001) [56] looked at the prevalence of voice problems by occupation along with the proportion of the general population who had that occupation. Based on clinical attendance teachers were 19.6% of attendees but only 4.2% of the population. Teaching was not the occupation with the highest risk factor; professional singers formed 11.5% of attendees but 0.02% of the population. The numbers of individuals who work in professions identified as high risk may have a bearing on how important this is considered by society.
Research by the Voice Care Network (1992) [20] in the UK identified that teachers made up 34% of attendees at the sampled speech therapists’ clinics, a much higher percentage than their proportion of the population.
Sapir et al. (1993) [57] suggested that teachers may be reluctant to seek medical help, with fewer than 1% of respondents having sought help. This may be due to teachers being aware of small changes to their voices but not considering these serious enough to seek help.
Other researchers have suggested that even though members of a particular profession are over represented at voice clinics, voice problems may not necessarily be greater in that occupation [58]. The impact that voice problems have on that group may be problematic and disruptive to their work. Other professions with a similar prevalence of voice problems, but for which voice problems do not interfere with critical tasks, may result in less disruption to the individuals involved and a smaller proportion seeking help [58].
One additional factor that is not always considered is the relative rate of voice problems in teachers and the general population. The prevalence of voice problems in the general population is not well established [59]; estimates include 6% experiencing significant communication effects [45], and 3-4% of a population (Australia) having voice disorders [60, 71] which is lower than the apparent prevalence in teachers.
3.3.3 Questionnaires
reported and are not normally followed up by medical examinations. Some studies used selected participant and control groups, whereas others relied on self-selection which may potentially have introduced bias.
Smith et al. in the United States (1997) [61] found that 15% of primary and secondary school teachers (n = 242) had voice problems versus 6% of a control group, and 20% of the teachers had been absent from work due to voice problems compared with 0% of the control group. This gives a 2.5 times over representation, similar to the report of 4.6 times incidence of voice problems among teachers from a voice clinic attendance study [56].
Russel et al. (1998) [59] found that 35% of teachers sampled in an Australian study reported voice issues every six months or more frequently during their career. These levels were considered significant, however, the study referred to the absence of statistics for the prevalence of voice problems in the general population referring to estimates by others [45].
A survey of secondary school teachers in England (n = 200) in 2011, found that 51% of respondents had experienced voice or throat problems in the previous two years and 17% had been absent from work as a result of these voice problems. Of these 20% had been absent for between one and four weeks [62].
3.3.4 Phoniatric examination
A robust method of identifying objective voice problems is by medical examination by a phoniatrician. Phoniatrics is the medical speciality of voice, speech, language, hearing and swallowing disorders. The expense and logistical difficulties of this approach as a research method, particularly with large sample groups, means that this approach has only been employed in a small number of studies which have generally been cross-sectional in design.
Lejska (1967) [63] undertook examinations (n = 722), finding symptoms of vocal pathology in 5.7% of female, and 1.4% of male teachers. Participants had ‘weak voices’ without vocal pathology at a rate of 16.5% for female, and 7% for male teachers.
Other research found higher rates of vocal pathology in female teachers, with two studies showing vocal nodules present in 9.7% [64] and 13% [65] of female participants. This indicated that the prevalence of vocal pathology was higher in female teachers than their male counterparts. This gender differential was not present in an equivalent (control) group of non-teachers.
The examination approach may underestimate the prevalence of voice problems as it may not include those who experience voice problems but do not present with physical pathology. Mathieson (1993) [5] indicated that at least 33% of patients who reported voice problems did not have identifiable voice pathology, emphasising that voice problems can still be significant for the sufferer irrespective of vocal pathology.
3.3.5 Prevalence summary
Despite indications in various studies that teachers have a higher risk of voice problems, the nature of the various studies and a lack of statistical controls mean that overall the link cannot be confirmed and that the evidence is not definitive. This is in line with the view of other reviews of the literature such as that carried out by Mattiske et al. in 1998 [66].
There is an argument that, irrespective of definitive evidence, the size of the teaching profession globally warrants particular attention and further investigations due to the large number of individuals potentially at risk. An elevated risk of voice problems has the potential to have substantial impacts for the teachers concerned, as well as for pupils, schools and wider society, as discussed in the following section.
3.4 Impact of teachers’ voice problems
Voice problems are important not only for individual teachers who experience the effects directly but they may also affect school communities and wider society both academically and economically.
3.4.1 Effects on pupil learning
Research has shown that children perform less well during tests when instructed by a dysphonic, rather than a healthy voice, such as may happen when a teacher continues to teach with voice problems [67]. If a teacher is absent due to ill health this may also adversely affect the continuity of pupil learning. If voice problems and related absences are widespread among teachers, this has the potential to impact on the educational progress of many children.
3.4.2 Economic and societal costs
The reasons for teacher absences are not fully recorded as part of publicly available data, however based on the questionnaire surveys detailed in Chapter 14 voice problems appear to be a significant reason for absence. The most recent figures showed 2.21 million teaching days lost annually to sickness in England [68].
If voice problems are responsible, or contribute, to a proportion of teacher absences then this must be considered as an economic cost in terms of the need to employ substitute teachers. In the United States the cost of treatment and substitute teachers as a result of voice problems has been estimated at $2.5 billion annually [56]. For the UK the estimated annual figure is £15 million [68]. If teachers leave the profession or retire early due to voice problems, this has a substantial cost to society in terms of lost talent and the wasted costs of training teachers.
3.4.3 Personal costs
On a psychological level our voices are intrinsically linked to our sense of identity, with each voice being unique to the individual. Changes to voice quality can influence how individuals see themselves and influence the perceptions of others. When voice problems severely reduce the ability to speak there may be a sense of enforced isolation due to an inability to convey emotions or communicate effectively.
With the sea change in post-industrial economies away from mass manual employment, a greater proportion of the population now depend on their voice as an
essential part of their occupation compared with past generations. The result is that voice problems now may be considered analogous to physical impairments in the industrial age in terms of the impact on an individual’s livelihood.
As well as the general shift towards the importance of voice use in the workplace, there are specific professions for which voice quality is vital and where the demands on the voice are high such as for teachers, barristers, actors, singers and similar.
In these professions the impact of voice problems can be significant when substantial loads are placed on the voice as part of the occupation, and where speaking for long periods and/or with heavy loading cannot readily be avoided. The nature of teaching is such that during term times the voice cannot easily be rested nor the load on the voice readily reduced as a precautionary or reactionary measure without significant interventions such as with the use of voice amplification systems.
Voice quality itself is also important for teaching compared with other occupations where the need is only for effective communication but where voice quality is not a substantive requirement.
For sufferers of occupational voice problems the psychological impacts can be significant, with a study showing that nearly 76% felt that voice problems would negatively affect their future work [56]. This would be expected to cause or increase stress which as noted in section 3.5.7 is a risk factor in its own right.
There have been examples of teachers leaving the profession as a result of voice problems which indicate that the concerns of sufferers of occupational voice problems are justified. One case in 2010 [69] highlighted the apparent risks of working in classrooms with high external noise levels and the low levels of awareness of voice problems among those responsible for the occupational health and safety of teachers. The teacher in question accepted an out-of-court settlement from her employer due to claimed chronic occupational voice problems which resulted in her no longer being able to teach. This settlement was for £145,000 and at the time of the settlement the individual had at least 15 years remaining in her career. This indicates that those who leave teaching through ill health may not be compensated fully for future lost earnings and may show why many continue teaching with voice problems.
The impact of voice problems on individuals can be assessed according to the World Health Organisation International Classification of Functioning, Disability and Health framework [70] with an example shown in Table 3.2 [71].
Table 3.2: Impact of voice disorders [71]
ICF Dimension Impact
Impairment
Phonation difficulties Vocal fatigue Altered voice quality Altered pitch Altered resonance
Altered breath control for sustaining voice and volume Hyper and hypotension in musculature
Vocal cord changes, e.g. oedema, inflammation, nodules Impact on speech & language development
Pain/discomfort when vocalising
Activity
Diminution of a speaker's ability to communicate effectively Reduction in speaking time from discomfort in speaking Inability to communicate by phone
Dependence on synthetic voice
Reduction in communicative interactions
Avoidance of difficult communicative environments Reliance on communicative partners
Need for assistive/augmentative communication (e.g. amplification, writing)
Participation
Effect on ability to participate fully in educational curriculum Disruption of career in professional voice users,
Adverse effects on job performance, attendance, and future career choices Social isolation
Limited participation Loss of autonomy Avoidance of situations Well-being
Frustration, anxiety, mood, self-esteem, depression, repression of emotions, stress Impact on peer/adult perception
Reduced self-image
Table 3.2 illustrates the wide range of impacts that voice problems can have on the sufferer and highlights how these can influence many areas of life.
3.5 Risk factors
The literature relevant to risk factors will be discussed in this section.
3.5.1 Pupil age group
Preciado et al. (1998) [72] found an increased prevalence of self-reported voice problems in teachers of lower age groups with rates of 36% in nursery, 25% in
![Figure 2.1: Vocal schematic [1]](https://thumb-us.123doks.com/thumbv2/123dok_us/10892686.2978356/25.892.286.698.449.867/figure-vocal-schematic.webp)
![Figure 2.2: The anatomy of the speech production mechanism [2, fig. 5.2]](https://thumb-us.123doks.com/thumbv2/123dok_us/10892686.2978356/26.892.236.741.86.449/figure-anatomy-speech-production-mechanism-fig.webp)
![Figure 4.2: T 20 and T 30 derivations [93]](https://thumb-us.123doks.com/thumbv2/123dok_us/10892686.2978356/55.892.190.793.84.359/figure-t-t-derivations.webp)
![Figure 7.4: Anatomy of the neck showing suprasternal (jugular) notch [150]](https://thumb-us.123doks.com/thumbv2/123dok_us/10892686.2978356/92.892.261.735.681.1106/figure-anatomy-neck-showing-suprasternal-jugular-notch.webp)
![Figure 7.7: Calibration procedure using a microphone with distance guide [149]](https://thumb-us.123doks.com/thumbv2/123dok_us/10892686.2978356/95.892.194.816.86.340/figure-calibration-procedure-using-microphone-distance-guide.webp)